COLLEGE THE COMPASSGUIDE TO - SPRING 2021 - Compass Education Group
←
→
Page content transcription
If your browser does not render page correctly, please read the page content below

THE   C O M PA S S G U I D E   TO

COLLEGE
 ADMISSION
         TESTING

            SPRING 2021
Introduction                                   4–5
                                                                                      College Admission and Testing                  6–7
                                                                                      Test Optional                                  8–9
                                                                                      The Competitive Landscape                    10–18
                                                                                      Understanding and Comparing Scores           19–23
                                                                                      SAT & ACT Percentiles                        24–25
                                                                                      Popular Testing Timelines                    26–29
                                                                                      SAT & ACT Content and Timing                 30–44
                                                                                             Reading                               32–33
                                                                                             English                               34–37
                                                                                             Math                                  38–41
                                                                                             Science                               42–43
                                                                                             Writing                                 44
                                                                                      The Compass Approach                           45
                                                                                      PreACT, PSAT, and National Merit             46–51
                                                                                             National Merit Scholarship Program    50–51
                                                                                      Subject Tests                                52–53
                                                                                      AP Exams                                     54–55
                                                                                      Test Dates and Score Requests                56–59
                                                                                      Score Choice and Superscoring                60–61
                                                                                      Securing Testing Accommodations                62
                                                                                      The Compass Team                             63–65
                                                                                      References and Resources                     66–67
                                                                                      Compass Commitments to Anti-Racism, Diversity,
                                                                                      Equity, & Inclusion                           68

For updates, please visit www.compassprep.com/guide.

The electronic versions of the Compass Guide may be redistributed for
non-commercial use so long as no changes are made to the document.
Please contact guide@compassprep.com for additional licensing or
distribution options.

Copyright © 2021 by Compass Education Group, LLC. All rights reserved.
Version 21.1 updated 2/1/2021

OWNERSHIP OF TRADEMARKS
*For all references herein, PSAT, SAT, and AP are trademarks owned by the College
Board, and ACT and Aspire are trademarks owned by American College Testing, neither
of which were involved in the production of, nor do they endorse, these materials.
Frequently Asked Questions
We’ve listed some of the most common questions and the pages where you can find the answers. Of
course, we welcome the chance to talk directly to you about these or other college admission testing
questions.

                 QUESTION                                                                                    PAGE(S)

 College         How important are my test scores?                                                           6–7
 Admission       What do test optional policies mean?                                                        8-9
                 Is the SAT or ACT essay required? What does “recommended” or “optional” mean?               44
                 What score do I need to get into College XYZ? What is a “good” score?                       10–18
                 Will colleges see only my best scores?                                                      60–61

                 How do colleges compare ACT and SAT scores?                                                 19–23

 Test Planning   When should I begin preparation and when should I take the tests?                           26–29
                 Are some test dates easier than others?                                                     19
                 Should I prepare to take the SAT or ACT? What are the main differences between the tests?   22–23, 30–44
                 How do I register for the test, view my scores, and send my scores to colleges?             56–59
                 What are the requirements and steps to get testing accommodations?                          62
                 What should I expect from test prep? Does it work? What will I learn?                       45
 PreACT &        What score do I need on the PSAT to receive National Merit recognition?                     51
 PSAT            Why is 1520 a perfect score on the PSAT?                                                    48
                 What is the PreACT?                                                                         46
                 Is the PSAT easier than the SAT? What do my scores mean?                                    47–49
 SAT             Will guessing help my score? Do all questions count toward my score?                        19
                 How do my scores compare to those of other students?                                        24–25
                 How much reading will I have to do? What does it look like?                                 32–33
                 What grammar should I study for the Writing and Language Test?                              36
                 How does the math on the SAT compare to the math on the ACT?                                40–41
 ACT             How difficult is the ACT English Test?                                                      34
                 What topics come up on the ACT Math Test, and how difficult are the problems?               38–41
                 What factors inform the testing strategy for ACT Math?                                      39
                 How is the ACT Reading Test different from the SAT’s? Is one easier?                        32–33
                 Does the ACT Science Test require knowledge from science classes?                           43
                 What’s a good Writing Test score?                                                           44
 Subject Tests   What happened to the SAT Subject Tests?                                                     52–53

                                                                                                                   3
About Compass Education Group
ABOUT US

                               Compass is one of the world’s leading providers of comprehensive, one-on-one tutoring for
                               high school students aspiring to attend competitive colleges. We provide individualized test
                               preparation and academic subject tutoring anywhere in the world via live online tutoring,
                               and we offer in-home tutoring in select cities.

                                We have earned an unmatched level of trust from college counselors and administrators
                                at thousands of high schools. Beyond private tutoring for students, we offer a range of
           resources to assist schools in their efforts to support students’ transitions to higher education. Compass also
           has a proud tradition of partnering with schools and nonprofit organizations to help more students receive
           high-quality preparation regardless of financial means.

           Compass leaders serve as keynote speakers at hundreds of high schools, colleges, and conferences annually. We
           partner with schools to provide advising seminars for parents, diagnostic assessments and analyses for students,
           and professional development for faculty and counselors. Our reputation in the education community dating
           back to 1989 is due to the outstanding successes our students achieve, our relentless commitment to research
           and sharing accurate information about tests, and the high ethical standards evident in our relationships with
           our constituents.

                                                                                                              FOUNDERS

                                        ADAM INGERSOLL | PRINCIPAL
                                        Adam began his career in test prep in 1993 while at the University of Southern California, where he
                                        was a student-athlete on the basketball team, worked in the admission office, and graduated magna
                                        cum laude. Now in his third decade guiding families to successful experiences with standardized
                                        tests, Adam is recognized as a leading expert on college admission testing and presents on this
                                        topic at conferences and institutions nationally and abroad. He regularly leads training on test
                                        interpretation for admission teams on college campuses, including Caltech, Rochester, and USC.

                                        ART SAWYER | PRINCIPAL
                                        Art graduated magna cum laude from Harvard University, where he was the top-ranked liberal arts
                                        student in his class. Art pioneered the one-on-one approach to test prep in California in 1989 and has
                                        written more than a dozen test prep books. Although he has routinely attained perfect scores on the
                                        SAT and ACT, Art is far prouder of the thousands of students he has helped over the past 30 years.
                                        Nobody knows more about standardized tests and tutoring than Art, and we make sure all Compass
                                        students benefit from his wisdom.

                                        BRUCE REED | EXECUTIVE DIRECTOR
                                        Bruce graduated from Colby College and has served in leadership roles in education for more
                                        than 20 years. He founded our Northern California office in 2004 and continues to serve as its
                                        hands-on leader while also mentoring our management team nationally. Bruce is recognized in
                                        the Bay Area and beyond as a visionary and passionate voice in the realm of teaching, testing, and
                                        educational development. He is a frequent presenter at higher education conferences, and his
                                        writings on college admission testing are regularly published or cited in national media.

           4
Introduction

                                                                                                                             INTRODUCTION
College admission testing and the context within which the tests operate have never lacked for controversy or
failed to create confusion and anxiety. Even so, 2020 was a year without precedent in the testing realm. The
pandemic limited testing availability and resulted in a roughly 30% reduction in the number of students taking
the SAT or ACT. Keeping testing going for the 70% who did manage to test proved to be chaotic for schools and
families. The impact of unavailable testing sites was uneven and will continue to be so at least into the summer of
2021. That disproportionate impact brings even more attention to the long-standing concerns about inequities
in standardized testing and college admissions. Compass is committed—in our partnerships with schools, in our
guidance for families, in our support for students, and in our relationships with our employees and coworkers—to
centering equity and justice for those historically most underrepresented in higher education. We declare that
Black Lives Matter, and we expand on what that means to us and requires of us in our Compass Commitments to
Anti-Racism, Diversity, Equity, and Inclusion inside the rear cover of this book. We are grateful to all those who
share these commitments and help hold us accountable to them.

The Compass Guide to Testing that you are reviewing is in its 22nd edition. This resource has always sought to
provide definitive and detailed answers to the questions posed by college admission testing. That goal feels more
challenging now than at any point in our company’s history. We are in the midst of a period of unprecedented
upheaval when the most fundamental questions about the tests’ accessibility and necessity are in doubt. This
means we—and our readers—must embrace more ambiguity and speculation than is comfortable. This edition of
the Guide reflects the uniqueness of the moment and more than ever before is best utilized in conjunction with
timely, complementary resources on our website and with the direct support of our team of Directors.

Due to the pandemic, we have not had a fully available, unimpacted national SAT or ACT date since February
2020. The vast majority of colleges and universities waived testing requirements for at least the class of 2021, and
most will extend this flexibility to include at least the class of 2022. Despite testing being not required and not
reliably available, roughly two thirds of the testing volume from the prior year remained intact. Well over a million
students in the class of 2021 have test scores; an as yet unknown fraction included those scores in their college
applications. Most colleges continue to weigh test scores in admission decisions when scores are submitted. The
necessity and impact of showing strong test scores is murky and controversial, as we discuss at length in later
pages. Broadly, predictions of testing’s imminent demise appear to have been premature. Availability of national
testing sites will likely stabilize by fall 2021, the popularity of “School Day” testing and unlisted sites has grown, and
new modes of online test administration including an at-home option are in the pipeline.

As always, we will be here to help students make sense of an ever-evolving landscape, settle on the most sensible
testing plans, and then maximize their potential on the tests. Please use this resource as a starting point and reach
out to our team of directors for personalized guidance and support. We are proud to offer diagnostic testing,
sophisticated analyses, and thoughtful feedback and recommendations for all families, including those who do
not proceed with tutoring. We wish you good health, good humor, and great success as you pursue your higher
education goals.

          “OUR DIRECTOR WAS INVALUABLY COMMITTED AND INVOLVED. SHE’S BEEN ON OUR TEAM,
     STRATEGIZING A GAME PLAN TO GET THE BEST PERFORMANCE OUT OF MY KIDS. OUR TUTORS TOOK
        THE STRESS OUT OF THE PROCESS AND HELPED MY KIDS BECOME MORE ACCURATE TESTERS.”

                  –KERRY C, MOTHER OF SAM, 11TH GRADER AT CRYSTAL SPRINGS UPLANDS SCHOOL

                                                                                                                        5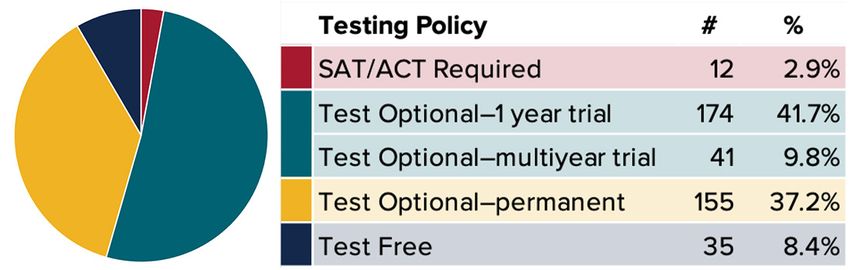
College Admission and Testing
COLLEGE ADMISSION AND TESTING

                                There are approximately 2,300 accredited, non-profit, four-year colleges and universities in the United States.
                                Their admission protocols have never been uniform, and even prior to 2020, applicants faced an increasingly
                                complex range of requirements and expectations. The “Varsity Blues” scandal, the pandemic, and rising
                                awareness of the inequities in college opportunities have fueled the debate over how significant a role
                                standardized test scores should play in admission decisions.

                                The trend at selective colleges is toward more flexible testing requirements even as the competition to gain
                                admission to these schools continues to intensify. The ACT and SAT are now optional at a majority of US
                                colleges and will remain so. SAT Subject Tests and the SAT Essay are being discontinued by College Board; we
                                expect that ACT will
                                phase out the essay
                                component of their
                                                              ADMISSION FACTORS
                                exam as well. Several
                                dozen schools have                   PERCENTAGE OF COLLEGES REPORTING “CONSIDERABLE OR MODERATE IMPORTANCE”

                                even gone test-free,                     GRADES IN ALL COURSES                                                 90%
                                                              GRADES IN COLLEGE PREP COURSES                                                   90%
                                meaning test scores                   STRENGTH OF CURRICULUM                                               84%
                                are not considered at                   ADMISSION TEST SCORES                                             83%
                                                                 COUNSELOR RECOMMENDATION                                  56%
                                all even if submitted.
                                                                      ESSAY OR WRITING SAMPLE                                  56%
                                                                    TEACHER RECOMMENDATION                                   54%
                                GPA and course                    EXTRACURRICULAR ACTIVITIES                              49%
                                rigor continue to be       STUDENT'S DEMONSTRATED INTEREST                           40%
                                                                                  CLASS RANK                       38%
                                the most important
                                                                                        WORK                   33%
                                factors in a student’s                           AP/IB SCORES            24%
                                application despite                                INTERVIEW            22%
                                                                                  PORTFOLIO          18%
                                the pandemic’s                STATE GRADUATION EXAM SCORES       11%
                                                                                                        SOURCE: 2019 NACAC STATE OF COLLEGE ADMISSIONS
                                impact on school                     SAT SUBJECT TEST SCORES   8%

                                attendance and
                                grading policies.
                                Colleges have had no choice but to become more flexible and creative in how they evaluate applications from
                                students coping with a global health crisis. Colleges assure students that they can expect compassion and
                                understanding during these trying times.

                                PATHWAYS TO COLLEGE ADMISSION
                                A generation ago, most high school students took the SAT or ACT with little awareness of the other test,
                                despite the fact that colleges have long accepted the SAT and ACT interchangeably. Today’s universal
                                acceptance of either test and myriad testing-related options allow students greater choice but also cause more
                                confusion for families.

                                ACT offers the eponymous ACT and PreACT, and the College Board oversees the PSAT, SAT, and AP exams.

                                6
GPA AND STANDARDIZED TESTS

                                                                                                                       COLLEGE ADMISSION AND TESTING
Performance in a rigorous high school curriculum is the best predictor of success in college and is the most heavily
weighted factor at most colleges. However, the GPA is imperfect as a sole academic criterion for admission for
two reasons. First, course difficulty and grading policies vary from teacher to teacher, school to school, and state
to state. Second, grade inflation has compressed the GPA scale. As more students earn As, it becomes harder to
distinguish applicants from one another.

The proper role of standardized tests is to complement the use of GPA and other factors in the admission process.
The SAT and ACT attempt to mitigate the two primary limitations of grades. They provide a common baseline for
all students, and they are designed to provide a useful and consistent distribution of scores.

                                                                                                 These GPA charts
                                                                                                 illustrate the
          GPA REPORTED BY COLLEGE BOUND SENIORS
                                                                                                 trend toward
                                                                                                 higher grades,
                                        1999                               2019                  with more
                          50                                50                                   students at
                                                                                     A+          the top of the
   PERCENT OF STUDENTS

                          40                                40
                                                                                                 scale. The ACT
                          30                      A+        30
                                                                                     A           distribution,
                                                                                                 on the other
                          20                       A        20
                                                                                                 hand, shows
                          10                                10                                   how scores
                                 C        B        A-               C        B       A-          are predictably
                           0                                 0
                                                                                                 distributed—
   SOURCE: COLLEGE BOARD
                                                                                                 particularly above
                                                                                                 the mean.

          ACT COMPOSITE SCORE DISTRIBUTION—CLASS OF 2019

          7%

          6%

          5%

          4%

            3%

           2%

          1%

                         ≤10 11 12 13 14 15 16 17 18 19 20 21 22 23 24 25 26 27 28 29 30 31 32 33 34 35 36

  SOURCE: ACT PROFILE REPORT—NATIONAL, GRADUATING CLASS OF 2019

                                                                                                                 7
Test Optional
TEST OPTIONAL

                Prior to the pandemic, a movement away from inflexible testing policies was already afoot. For decades, test
                optional proponents have argued that the incremental value of standardized test scores is modest, and that
                pursuing high scores imposes unjustifiable burdens on students. Flexible policies have helped colleges reach
                a broader, more diverse pool, and competitive considerations vis-a-vis peer institutions have also fueled this
                trend.

                The pandemic then
                upended testing               NUMBER OF COLLEGES / UNIVERSITIES WITH TEST OPTIONAL
                policy across the             OR TEST FLEXIBLE ADMISSION POLICIES
                entire landscape of
                college admissions.           1400
                In just a few weeks
                                              1200
                in the spring
                of 2020, test                 1000
                optional became
                                               800
                ubiquitous, at least
                                                                                  2007–2008

                                                                                                                      2011–2012

                                                                                                                                                                                                                                  2019–2020
                                                                                                          2009–2010

                                                                                                                                                                                                                                              2020–2021
                                              2004–2005

                                                          2005–2006

                                                                      2006–2007

                                                                                              2008–2009

                                                                                                                                  2012–2013

                                                                                                                                              2010–2011

                                                                                                                                                          2013–2014

                                                                                                                                                                      2014–2015

                                                                                                                                                                                  2015–2016

                                                                                                                                                                                              2016–2017

                                                                                                                                                                                                          2017–2018

                                                                                                                                                                                                                      2018–2019
                temporarily. As test
                site cancellations
                continued through
                                             Source: Fairtest.org
                the fall, these
                policy changes
                were not merely
                freeing, they proved necessary. Thousands of students reached their senior year without an opportunity to
                fulfill their testing plans. But thanks to the collective foresight of most colleges and universities, class of 2021
                students did not find their possibilities much constrained by not submitting test scores; the absence of scores
                was not a conspicuous omission.

                Whereas in prior years some colleges might have surmised that uncompetitive scores were being concealed,
                students applying without scores from the class of 2021 got the benefit of the doubt. Test optional colleges
                could not assume that applicants had safe, readily available chances to test. As testing opportunities begin to
                climb again, many of the more selective colleges will expect and receive scores from most applicants, although
                the option to withhold scores will remain common.

                Instead of focusing on what they can forgo, serious applicants will consider what other applicants with similar
                opportunities are apt to present as strengths. Strong test scores—like other discretionary qualities volunteered
                in an application—may still help at most competitive schools. When colleges allow an applicant to choose, they
                are ceding more control to the applicant. To keep that control, the most prudent path is to attain scores, if
                feasible. All things being equal, applicants who have scores to report retain a potential advantage over those
                who opt out of testing right from the start. Students seem to grasp this reality; we have not seen a reduced
                interest in testing by applicants to competitive colleges.

                Deciding how much to pursue testing requires risk calculations that were unimaginable before March 2020.
                Families must first determine whether any local test centers are open and available and then whether those sites

                8
TEST OPTIONAL
satisfy their safety concerns. For the class of 2022, Compass is optimistic that testing conditions will gradually
improve, and we believe summer and fall dates will be available in most regions of the country.

Students should try to ascertain how valuable scores may be at their colleges of interest. Most colleges are
expected to extend their 1-year test optional policy for at least another year. Policy updates will solidify by the
summer of 2021. To assist with these questions and others, Compass closely tracks the testing policies and
competitive profiles of 400+ popular colleges. Most of these institutions attract a national applicant pool and
are moderately to highly selective. Their current testing policies break down as follows:

                                                                                               A temporary
  A BREAKDOWN OF TEST OPTIONAL POLICIES AT THE 400+                                            stance is most
  COLLEGES AND UNIVERSITIES COMPASS TRACKS
                                                                                               common,
                                                                                               accounting for
                                                                                               nearly one-half of
                                                                                               all test optional
                                                                                               colleges. Within
                                                                                               this group are
                                                                                               schools that still
                                                                                               prefer to receive
                                                                                               scores and
                                                                                               have granted a
                                                                                               concession due to
                                                                                               the pandemic. Also
included are schools whose admissions leaders are committed to the ethos of test optional and are urging their
stakeholders to make the policy permanent (resistance can come from faculty, trustees, or politically-appointed
regents of state institutions). How these trial periods evolve for the class of 2022 and beyond remains unclear.
Compass expects many policies will be extended or made permanent. Students who are disadvantaged or
discouraged by testing will have more options than ever before, even as scores remain relevant in most
competitive contexts.

A complete reckoning of the impact of the test optional surge will take several years. 2020 saw a roughly 30%
drop in tests taken and a corresponding reduction in scores submitted. We also saw that a test optional policy
does not make a highly selective school less competitive; in fact it can enhance a college’s desirability, increasing
the imbalance of available spots and demand for them. Colleges that were already popular reached record levels
of interest this year, especially in their early application rounds.

In the coming years, we will see if applicant and admission profiles at competitive colleges alter and what
role testing policies have in that change. Other factors will surely affect college admissions, too: students
returning from gap years, the attractiveness and accessibility of US colleges among international students, the
affordability and safety of the residential college model, and more.

Compass continues to carefully monitor and report out on test-taking behavior and the use of scores. Visit our
website for the most current compilation of this data for 400+ schools, and reach out to a Compass Director to
discuss how these variables shape your testing plans.

                                                                                                                        9
The Competitive Landscape
THE COMPETITIVE LANDSCAPE

                            The following is a sampling of admission statistics at over 400 well-known colleges. The test scores represent
                            the range in the middle half of the class entering in 2018 and 2019. These scores should not be viewed as cutoffs
                            or qualifying scores.

                            The Number of Applicants and Class Size columns give you some context for the Admit Rate (% of students
                            accepted): a high acceptance rate doesn’t necessarily mean a large first year class. The % Submitting SAT
                            and ACT columns provide a sense of how popular the use of SAT scores versus ACT scores is at a particular
                            institution (compare the University of Michigan to the UC system, for example).

                                                                                                SAT Total             ACT Comp
                                                                    Number of Admit    Class    25th–75th    Submit   25th–75th    Submit
                                                                    Applicants Rate    Size     Percentile   SAT      Percentile   ACT
                            Abilene Christian University              11,379    62%       932   1014–1230     48%       21–28       48%
                            Adelphi University                        13,006    74%     1,245   1080–1270     74%       22–27       20%
                            Agnes Scott College                        1,751    65%       299   1130–1340     50%       24–30       36%
                            Albion College                             4,043    69%       415    990–1200     76%       21–27       25%
                            Allegheny College                          5,208    62%       500   1170–1360     56%       24–30       27%
                            American University                       18,545    36%     1,755   1220–1380     53%       27–31       31%
                            Amherst College                           10,569    11%       470   1410–1550     59%       31–34       51%
                            Appalachian State University              16,664    77%     3,496   1100–1270     49%       22–28       49%
                            Arizona State University—Tempe            34,188    86%    10,044   1130–1340     58%       22–28       58%
                            Auburn University                         20,205    81%    4,808    1150–1320     18%       25–31       81%
                            Augustana College                          6,757    57%      678    1100–1300     56%       23–29       44%
                            Austin College                             4,360    51%      378    1110–1290     67%       24–29       41%
                            Babson College                             6,362    26%      600    1270–1450     74%       27–32       35%
                            Baldwin Wallace University                 3,926    74%      677    1030–1250     35%       21–27       84%
                            Ball State University                     23,305    77%    4,072        N/A        N/A       N/A         N/A
                            Bard College                               5,141    65%      486    1248–1420     34%       27–31       17%
                            Barnard College                            9,320    12%      624    1340–1520     63%       31–34       48%
                            Bates College                              8,222    12%      499    1270–1480     45%       29–33       31%
                            Baylor University                         34,582    45%    3,307    1200–1380     49%       26–32       51%
                            Beloit College                             3,657    62%      259    1080–1380     35%       24–30       33%
                            Bennington College                         1,344    61%      179    1250–1440     34%       29–32       13%
                            Bentley University                         9,017    47%      944    1230–1410     85%       27–31       24%
                            Berea College                              1,966    30%      413    1090–1298     15%       23–27       80%
                            Berry College                              4,328    71%      577    1090–1320     50%       24–30       49%
                            Binghamton University—SUNY                37,516    41%    2,897    1280–1440     80%       29–32       32%
                            Biola University                           4,149    71%      907    1080–1310     80%       21–28       33%
                            Birmingham-Southern College                3,384    54%      332    1110–1310     17%       22–29       74%
                            Boise State University                    10,788    81%    2,832     960–1180     82%       21–26       42%
                            Boston College                            35,552    27%    2,297    1370–1490     67%       31–34       44%
                            Boston University                         62,224    19%    3,156    1360–1480     73%       30–34       32%
                            Bowdoin College                            9,332     9%      499    1330–1520     59%       31–34       45%
                            Bradley University                        10,708    70%    1,048    1070–1270     70%       22–28       52%
                            Brandeis University                       11,798    31%      895    1280–1500     69%       29–33       32%
                            Brigham Young University—Provo            10,500    68%    5,731    1210–1420     30%       26–31       90%
                            Brown University                          38,674     7%    1,662    1440–1570     67%       33–35       48%
                            Bryn Mawr College                          3,332    33%      374    1290–1510     61%       29–33       32%

                            10
THE COMPETITIVE LANDSCAPE
SAT Total ACT Comp
Number of Admit Class 25th–75th Submit 25th–75th Submit
Applicants Rate Size Percentile SAT Percentile ACT
Bucknell University 9,845 34% 964 1255–1430 72% 28–32 36%
Butler University 14,891 73% 1,116 1150–1330 68% 24–30 62%
California Institute of Technology 8,367 6% 236 1530–1560 79% 35–36 42%
California Lutheran University 5,752 72% 681 1070–1250 80% 21–26 37%
California State Polytechnic University—
36,660 56% 3,863 1030–1250 91% 19–27 25%
Pomona
California State Polytechnic University—
54,072 28% 4,613 1250–1420 78% 26–32 48%
San Luis Obispo
California State University—Chico 25,908 72% 2,561 990–1180 90% 18–24 28%
California State University—Fresno 18,122 58% 3,059 950–1130 97% 16–22 30%
California State University—Fullerton 50,105 53% 4,778 1030–1200 96% 19–24 26%
California State University—Long Beach 71,297 39% 5,161 1040–1250 95% 20–26 24%
California State University—Los Angeles 33,641 48% 3,288 900–1070 96% 15–20 33%
California State University—
12,327 75% 1,046 960–1170 92% 17–23 35%
Monterey Bay
California State University—Northridge 30,637 59% 5,792 910–1130 94% 16–22 21%
California State University—Sacramento 27,576 82% 4,160 940–1140 94% 16–22 26%
California State University—
16,307 69% 2,885 910–1090 98% 15–19 36%
San Bernardino
Carleton College 7,382 19% 272 1360–1540 57% 31–34 53%
Carnegie Mellon University 27,634 15% 1,585 1460–1560 77% 33–35 36%
Carroll College 2,709 78% 254 1070–1270 45% 22–28 61%
Case Western Reserve University 28,786 27% 1,357 1350–1520 58% 30–34 59%
Central Michigan University 16,411 70% 2,473 990–1200 89% 20–26 23%
Centre College 2,212 76% 355 1130–1380 26% 26–32 79%
Chapman University 14,273 56% 1,768 1190–1370 69% 25–30 44%
Christopher Newport University 7,204 72% 1,238 1110–1280 N/A 22–27 27%
Claremont McKenna College 6,066 10% 173 1360–1510 56% 31–34 53%
Clark University 7,639 54% 665 1190–1340 61% 27–31 17%
Clarkson University 6,673 75% 790 1160–1350 89% 23–30 32%
Clemson University 29,070 51% 3,932 1230–1400 62% 27–32 38%
Coe College 7,431 63% 379 1050–1255 34% 21–27 75%
Colby College 13,584 10% 522 1380–1520 52% 31–34 38%
Colgate University 9,951 23% 786 1330–1500 56% 31–34 44%
College of Charleston 11,783 78% 2,046 1080–1260 59% 22–28 42%
College of St. Benedict 2,052 80% 438 1040–1255 11% 22–28 92%
College of the Holy Cross 7,200 34% 829 1260–1430 44% 28–32 21%
College of William and Mary 14,680 38% 1,530 1320–1510 80% 30–34 32%
College of Wooster 6,352 55% 543 1150–1380 59% 24–31 57%
Colorado College 9,456 14% 535 1300–1480 50% 29–33 48%
Colorado School of Mines 11,756 53% 1,282 1260–1460 81% 27–33 59%
Colorado State University 28,319 81% 5,079 1070–1290 80% 23–29 43%
Columbia University 42,569 5% 1,406 1480–1560 61% 33–35 52%
Concordia College—Moorhead 3,395 68% 517 956–1343 3% 21–27 87%
Connecticut College 6,784 37% 508 1310–1450 31% 30–33 16%
Cornell College 3,118 62% 270 1100–1345 35% 23–29 68%
Cornell University 49,114 11% 3,189 1400–1560 71% 32–35 41%
Creighton University 10,112 71% 1,155 1150–1350 28% 24–30 84%
CUNY—Baruch College 20,303 43% 2,268 1130–1330 94% N/A N/A
CUNY—Hunter 33,750 35% 2,556 1150–1350 95% N/A N/A
11THE COMPETITIVE LANDSCAPE
SAT Total ACT Comp
Number of Admit Class 25th–75th Submit 25th–75th Submit
Applicants Rate Size Percentile SAT Percentile ACT
Dartmouth College 23,650 8% 1,193 1440–1560 57% 32–35 43%
Davidson College 5,982 18% 527 1310–1485 59% 30–33 46%
Denison University 8,812 29% 625 1200–1410 38% 27–31 39%
DePaul University 26,895 68% 2,622 1070–1290 64% N/A N/A
DePauw University 4,935 64% 423 1130–1360 72% 23–30 49%
Dickinson College 6,426 40% 453 1240–1410 52% 28–32 23%
Drake University 6,944 68% 782 1100–1370 22% 24–31 74%
Drew University 3,788 69% 420 1110–1310 66% 25–30 24%
Drexel University 31,824 75% 3,176 1190–1390 86% 25–31 22%
Drury University 1,664 64% 343 1045–1225 13% 22–28 90%
Duke University 35,767 9% 1,745 1450–1570 53% 33–35 72%
Duquesne University 7,411 73% 1,302 1130–1300 73% 23–28 31%
Earlham College 2,070 63% 172 1100–1370 62% 23–30 34%
East Carolina University 19,234 79% 4,364 1030–1190 69% 19–24 65%
Eastern Michigan University 14,323 74% 2,152 970–1190 85% 19–25 20%
Elmhurst College 4,175 68% 526 990–1210 N/A 20–26 N/A
Elon University 10,500 78% 1,659 1160–1320 65% 25–30 46%
Embry-Riddle Aeronautical University 8,551 61% 1,710 1120–1360 70% 23–29 41%
Emerson College 15,353 33% 942 1200–1390 64% 27–31 34%
Emory University 30,017 16% 1,34 1350–1520 52% 31–34 48%
Fairfield University 12,315 57% 1,173 1210–1350 58% 26–30 16%
Florida Institute of Technology 9,743 66% 784 1150–1360 78% 24–30 34%
Florida International 18,492 58% 3,998 1240–1300 92% 23–28 8%
Florida State University 58,936 36% 7,106 1200–1340 70% 26–30 30%
Fordham University 46,308 46% 2,299 1250–1430 71% 28–32 39%
Franklin and Marshall College 9,502 30% 627 1250–1460 62% 28–32 23%
Furman University 5,469 61% 711 1230–1410 40% 28–32 50%
Gallaudet University 477 61% 183 785–985 21% 14–19 84%
George Mason University 19,554 87% 3,704 1110–1320 72% 24–30 8%
George Washington University 26,968 41% 2,619 1280–1470 52% 29–33 31%
Georgetown University 22,764 14% 1,528 1370–1530 76% 31–35 47%
Georgia Institute of Technology 36,856 21% 3,076 1300–1510 74% 29–34 53%
Georgia Southern University 13,858 55% 4,260 1050–1200 78% 20–25 48%
Georgia State University 20,949 57% 5,018 970–1150 81% 20–26 39%
Gettysburg College 6,269 45% 748 1270–1420 76% 26–30 20%
Gonzaga University 9,279 62% 1,248 1210–1358 72% 25–30 46%
Goshen College 1,278 65% 160 1010–1210 88% 21–29 24%
Goucher College 2,610 81% 340 1030–1260 71% 21–30 22%
Grinnell College 8,004 23% 460 1370–1530 55% 31–34 45%
Gustavus Adolphus College 4,957 69% 642 N/A N/A 25–30 61%
Hamilton College 8,279 17% 473 1370–1520 41% 32–34 40%
Hampden-Sydney College 3,056 57% 228 1060–1320 89% 20–27 30%
Hampton University 9,551 36% 927 1030–1160 12% 20–25 26%
Hanover College 3,127 65% 290 1030–1240 49% 21–26 40%
Harvard College 43,330 5% 1,649 1460–1570 71% 33–35 45%
Harvey Mudd College 4,045 14% 224 1490–1570 74% 33–35 44%
Haverford College 4,963 16% 363 1380–1540 68% 32–34 43%
Hendrix College 1,628 70% 284 1150–1370 26% 25–31 90%
High Point University 11,298 74% 1,400 1090–1260 58% 22–28 39%
12THE COMPETITIVE LANDSCAPE
SAT Total ACT Comp
Number of Admit Class 25th–75th Submit 25th–75th Submit
Applicants Rate Size Percentile SAT Percentile ACT
Hillsdale College 2,208 36% 339 1275–1465 34% 29–32 69%
Hobart and William Smith Colleges 3,439 66% 458 1190–1350 55% 26–30 19%
Hofstra University 24,425 69% 1,522 1160–1340 69% 25–30 21%
Hollins University 3,244 71% 185 1070–1300 84% 22–30 25%
Hope College 3,748 86% 686 1130–1330 76% 23–31 51%
Howard University 21,006 36% 1,925 1150–1260 78% 22–27 37%
Humboldt State University 16,335 91% 822 980–1190 89% 17–25 34%
Illinois Institute of Technology 5,049 60% 583 1190–1400 78% 26–32 39%
Illinois State University 16,151 82% 3,860 1020–1220 82% 20–26 53%
Illinois Wesleyan University 3,719 61% 409 1120–1320 59% 24–29 60%
Indiana University—Bloomington 44,169 77% 8,097 1150–1360 75% 24–31 60%
Iowa State University 18,246 92% 5,579 1100–1340 17% 22–28 87%
Ithaca College 14,194 73% 1,509 1170–1340 50% 26–30 17%
James Madison University 23,578 77% 4,455 1120–1290 62% 23–28 15%
John Brown University 1,176 76% 319 1060–1260 14% 23–29 84%
Johns Hopkins University 30,164 10% 1,355 1470–1570 63% 33–35 37%
Kalamazoo College 3,576 76% 395 1170–1370 53% 25–31 25%
Kansas State University 8,140 96% 3,202 N/A N/A 22–28 92%
Kennesaw State University 15,691 75% 6,533 1050–1220 77% 20–26 49%
Kent State University 16,308 86% 4,317 1040–1230 28% 20–26 84%
Kenyon College 6,662 34% 487 1270–1460 58% 29–33 51%
Knox College 3,397 68% 318 1090–1350 54% 24–31 41%
Lafayette College 8,521 32% 698 1250–1440 71% 28–33 35%
Lake Forest College 4,739 55% 379 1110–1310 47% 23–29 45%
Lawrence University 3,463 62% 386 1200–1430 36% 25–32 51%
Lehigh University 15,649 32% 1,406 1280–1450 70% 29–33 30%
Lewis & Clark College 5,863 72% 507 1220–1400 56% 27–31 36%
Lipscomb University 3,638 60% 666 1060–1320 25% 22–29 86%
Louisiana State University—Baton Rouge 24,501 75% 6,126 1080–1310 14% 23–29 86%
Loyola Marymount University 18,592 44% 1,467 1230–1410 69% 27–31 41%
Loyola University Chicago 25,583 67% 2,630 1140–1320 59% 25–30 60%
Loyola University Maryland 10,077 80% 1,081 1143–1320 67% 25–30 19%
Loyola University New Orleans 5,857 75% 822 1050–1260 42% 22–28 65%
Luther College 4,108 62% 527 1040–1270 19% 22–28 83%
Macalester College 6,598 32% 502 1320–1510 57% 29–33 50%
Marist College 11,260 49% 1,358 1210–1360 N/A 26–31 N/A
Marquette University 15,078 83% 1,974 1120–1320 32% 24–29 79%
Massachusetts Institute of Technology 21,706 7% 1,114 1500–1570 75% 34–36 48%
Mercer University 5,034 74% 900 1170–1340 59% 25–30 41%
Miami University—Oxford 28,920 80% 4,309 1210–1410 31% 26–31 81%
Michigan State University 44,322 71% 8,801 1100–1320 78% 23–29 38%
Michigan Technological University 5,978 74% 1,299 1170–1370 81% 25–30 41%
Middlebury College 9,754 15% 605 1360–1530 62% 32–34 45%
Mills College 1,057 77% 134 N/A N/A N/A N/A
Millsaps College 5,223 69% 204 1080–1290 13% 21–26 92%
Milwaukee School of Engineering 3,552 62% 581 N/A 27% 25–30 77%
Mississippi State University 18,269 66% 3,500 1070–1280 6% 22–30 94%
Missouri State University 7,581 88% 2,679 1040–1240 9% 21–27 94%
13THE COMPETITIVE LANDSCAPE
SAT Total ACT Comp
Number of Admit Class 25th–75th Submit 25th–75th Submit
Applicants Rate Size Percentile SAT Percentile ACT
Missouri University of Science &
5,107 79% 1,145 1180–1290 5% 26–32 91%
Technology
Montclair State University 12,728 76% 3,101 1000–1060 44% N/A N/A
Morehouse College 3,554 58% 605 1010–1210 59% 20–25 40%
Mount Holyoke College 3,908 38% 496 1270–1490 50% 27–32 27%
Muhlenberg College 4,146 62% 548 1170–1360 60% 26–30 29%
New College of Florida 1,226 73% 147 1170–1335 84% 25–31 46%
New Jersey Institute of Technology 8,201 73% 1,380 1200–1370 89% 24–31 17%
New School 9,413 57% 1,467 1150–1380 36% 25–30 14%
New York University 79,462 16% 5,752 1370–1510 64% 30–34 28%
North Carolina State University—Raleigh 30,995 45% 4,772 1250–1390 48% 27–31 52%
Northeastern University 62,263 18% 2,996 1390–1540 55% 32–35 31%
Northern Arizona University 36,855 85% 3,455 1030–1230 32% 19–25 49%
Northwestern University 40,585 9% 2,006 1440–1550 64% 33–35 53%
Oberlin College 7,708 36% 798 1280–1480 68% 29–33 41%
Occidental College 7,501 37% 562 1300–1480 68% 28–32 45%
Ohio State University—Columbus 47,703 54% 7,716 1250–1460 39% 28–32 78%
Ohio University 24,179 82% 3,660 1050–1260 22% 21–26 90%
Ohio Wesleyan University 4,281 67% 399 1080–1330 32% 22–28 64%
Oklahoma State University 15,277 70% 4,200 1040–1265 30% 21–28 89%
Old Dominion University 13,335 87% 3,176 990–1200 87% 18–24 19%
Oregon State University 15,786 84% 3,042 1080–1320 72% 21–28 40%
Pacific Lutheran University 3,663 86% 598 1090–1280 60% 24–29 20%
Pennsylvania State University—
71,903 49% 8,331 1160–1370 78% 25–30 17%
University Park
Pepperdine University 12,764 32% 726 1250–1430 69% 27–32 41%
Pitzer College 4,358 13% 273 1340–1490 30% 30–33 30%
Point Loma Nazarene University 3,277 74% 611 1140–1310 74% 24–29 47%
Pomona College 10,401 7% 228 1390–1540 64% 32–35 50%
Portland State University 6,861 96% 1,996 990–1220 45% 18–24 35%
Pratt Institute 7,090 49% 700 1190–1410 70% 25–30 20%
Presbyterian College (SC) 2,141 75% 342 1000–1230 73% 19–26 58%
Princeton University 35,370 6% 1,339 1440–1570 68% 32–35 55%
Providence College 11,478 48% 1,094 1210–1350 51% 27–31 17%
Purdue University—West Lafayette 54,912 60% 8,056 1190–1440 82% 25–32 50%
Queens University of Charlotte 2,319 96% 335 1040–1240 75% 21–27 46%
Quinnipiac University 22,753 73% 1,900 1090–1260 71% 23–28 22%
Randolph-Macon College 2,460 71% 208 1050–1240 91% 21–27 22%
Reed College 5,815 40% 394 1325–1520 70% 30–34 42%
Rensselaer Polytechnic Institute 20,402 43% 1,778 1330–1500 72% 29–33 28%
Rhode Island School of Design 3,832 26% 479 1230–1470 83% 26–32 19%
Rhodes College 5,207 45% 517 1220–1430 36% 27–32 72%
Rice University 27,087 9% 964 1470–1570 67% 33–35 33%
Ripon College 2,900 70% 221 990–1220 22% 19–25 80%
Rochester Institute of Technology 19,494 70% 2,571 1220–1410 78% 27–32 25%
Rollins College 6,167 58% 556 1160–1340 67% 24–30 44%
Rutgers, The State University of New
41,286 61% 7,315 1210–1430 90% 25–32 18%
Jersey—New Brunswick
Rutgers, The State University of New
13,732 72% 1,402 1020–1200 95% 19–25 9%
Jersey—Newark
14THE COMPETITIVE LANDSCAPE
SAT Total ACT Comp
Number of Admit Class 25th–75th Submit 25th–75th Submit
Applicants Rate Size Percentile SAT Percentile ACT
Saint Louis University 15,573 59% 1,902 1170–1380 36% 25–30 76%
Samford University 3,912 93% 900 1070–1250 36% 23–29 84%
San Diego State University 69,842 34% 5,275 1110–1320 86% 22–29 38%
San Francisco State University 34,629 67% 3,694 940–1150 88% 17–23 2%
San Jose State University 35,287 64% 3,959 1030–1260 93% 18–26.5 23%
Santa Clara University 16,300 49% 1,391 1280–1440 68% 28–32 43%
Sarah Lawrence College 4,035 53% 398 1240–1420 45% 28–31 26%
Scripps College 3,022 32% 283 1333–1490 62% 30–33 51%
Seattle University 7,968 79% 930 1160–1330 79% 24–30 37%
Seton Hall University 19,757 74% 1,631 1150–1330 87% 24–29 23%
Sewanee—University of the South 3,545 67% 438 1150–1340 40% 25–30 62%
Siena College 7,728 81% 840 1070–1280 65% 22–28 14%
Simmons University 2,933 73% 433 1110–1290 88% 23–29 12%
Skidmore College 11,102 30% 735 1220–1400 53% 28–32 22%
Smith College 5,597 33% 633 1340–1520 54% 30–33 30%
Soka University of America 502 40% 108 1240–1430 82% 26–32 25%
Southern Methodist University 13,959 47% 1,544 1300–1480 39% 29–33 55%
Southwestern University 4,766 49% 444 1140–1320 77% 23–29 51%
Spelman College 9,106 43% 516 1080–1230 73% 22–26 51%
St. John Fisher College 4,720 65% 601 1070–1260 95% 21–26 30%
St. John’s College Annapolis 909 60% 129 1200–1420 65% 26–32 20%
St. John’s University (NY) 29,059 72% 3,135 1080–1300 77% 23–29 11%
St. Mary’s College (IN) 2,033 81% 374 1070–1243 55% 24–28 49%
St. Mary’s College of California 6,069 81% 516 1070–1240 72% 22–28 31%
St. Mary’s College of Maryland 1,621 84% 320 1060–1290 87% 21–29 22%
St. Michael’s College 3,967 83% 392 1150–1310 47% 25–29 11%
St. Olaf College 5,694 48% 806 1190–1430 30% 26–32 74%
St. Lawrence University 6,998 42% 606 1160–1350 55% 24–30 20%
Stanford University 47,452 4% 1,701 1440–1570 67% 32–35 50%
Stetson University 13,005 72% 934 1110–1300 54% 22–29 30%
Stevens Institute of Technology 10,475 40% 969 1340–1500 76% 31–34 20%
Stonehill College 6,961 68% 652 1120–1290 56% 24–29 7%
Stony Brook University—SUNY 37,079 44% 3,372 1230–1440 86% 26–32 20%
SUNY College of Environmental Science
2,018 61% 386 1120–1310 87% 23–29 43%
and Forestry
SUNY—Geneseo 10,433 66% 1,226 1120–1310 88% 23–28 12%
Susquehanna University 4,863 85% 620 1100–1290 74% 22–28 15%
Swarthmore College 11,442 9% 417 1380–1540 68% 31–35 37%
Syracuse University 35,299 44% 3,660 1180–1380 70% 26–30 32%
Taylor University 2,341 68% 490 1080–1310 80% 22–28 55%
Temple University 35,599 60% 4,942 1120–1320 76% 24–30 17%
Texas A&M University—College Station 42,899 58% 10,602 1160–1390 62% 26–31 38%
Texas Christian University 19,028 47% 2,159 1150–1350 41% 25–31 58%
Texas Lutheran University 3,000 56% 419 990–1160 84% 20–24 14%
Texas State University 23,583 81% 6,362 1010–1180 74% 19–25 26%
Texas Tech University 25,384 69% 6,145 1070–1260 61% 22–27 39%
The Catholic University of America 5,668 85% 818 1130–1330 63% 24–29 21%
The Citadel 2,742 75% 643 1050–1230 63% 20–25 36%
The College of New Jersey 13,824 49% 1,605 1160–1360 90% 25–30 19%
15THE COMPETITIVE LANDSCAPE
SAT Total ACT Comp
Number of Admit Class 25th–75th Submit 25th–75th Submit
Applicants Rate Size Percentile SAT Percentile ACT
The Cooper Union 2,326 16% 186 1305–1530 81% 30–35 26%
Thomas Aquinas College 204 79% 117 1150–1390 76% 26–31 26%
Towson University 12,678 76% 2,795 1060–1220 91% 20–25 20%
Transylvania University 1,782 90% 270 1080–1350 10% 23–30 80%
Trinity College (Hartford) 6,080 33% 580 1300–1460 31% 29–32 23%
Trinity University 9,864 29% 646 1290–1450 55% 29–32 45%
Truman State University 4,595 63% 901 1150–1350 10% 24–31 92%
Tufts University 22,766 15% 1,612 1390–1540 56% 32–34 34%
Tulane University 42,185 13% 1,821 1360–1520 26% 31–33 72%
Union College (Schenectady, NY) 6,086 43% 550 1220–1420 59% 27–32 23%
United States Air Force Academy 10,354 11% 1,132 1230–1440 50% 28–33 50%
United States Coast Guard Academy 1,930 20% 279 1212–1400 82% 25–30 51%
United States Merchant Maritime
1,693 25% 280 1200–1340 N/A 25–31 N/A
Academy
United States Military Academy 11,675 10% 1,171 1160–1380 88% 25–30 30%
United States Naval Academy 16,332 8% 1,181 1240–1520 N/A 27–32 N/A
University at Albany—SUNY 27,529 54% 2,665 1090–1250 87% 22–28 14%
University at Buffalo—SUNY 29,900 61% 4,289 1160–1340 76% 24–29 20%
University of Akron 14,553 73% 2,708 990–1230 21% 19–25 93%
University of Alabama 38,505 83% 6,764 1080–1340 27% 23–31 72%
University of Alaska—Anchorage 3,673 83% 1,356 1020–1220 24% 17–24 22%
University of Arizona 40,854 85% 7,683 1120–1350 51% 21–29 50%
University of Arkansas—Fayetteville 17,913 77% 4,562 1120–1300 26% 23–30 89%
University of California—Berkeley 87,398 17% 6,454 1330–1520 81% 28–34 41%
University of California—Davis 76,647 41% 6,389 1150–1410 71% 25–31 29%
University of California—Irvine 95,568 27% 6,068 1180–1440 N/A N/A N/A
University of California—Los Angeles 111,322 12% 5,920 1290–1510 80% 27–34 44%
University of California—Merced 25,368 72% 2,105 980–1180 92% 17–22 42%
University of California—Riverside 49,788 57% 4,778 1130–1340 94% 24–30 34%
University of California—San Diego 99,133 32% 6,023 1250–1470 88% 24–33 37%
University of California—Santa Barbara 93,457 30% 4,935 1260–1460 86% 25–33 36%
University of California—Santa Cruz 55,906 52% 3,722 1200–1360 86% 24–30 33%
University of Central Florida 35,240 38% 3,889 1160–1340 70% 25–29 30%
University of Chicago 34,648 6% 1,726 1500–1600 53% 33–35 58%
University of Cincinnati 23,609 77% 5,480 1140–1330 22% 23–29 89%
University of Colorado—Boulder 40,740 78% 7,113 1140–1350 72% 25–31 47%
University of Connecticut 35,096 49% 3,603 1190–1390 90% 26–32 19%
University of Dallas 4,676 45% 382 1150–1360 67% 24–30 51%
University of Dayton 17,462 72% 2,034 1120–1320 33% 23–29 82%
University of Delaware 26,500 68% 4,144 1170–1360 77% 24–30 22%
University of Denver 21,028 59% 1,351 1170–1350 55% 26–31 55%
University of Florida 38,069 37% 6,554 1320–1450 85% 28–33 50%
University of Georgia 29,065 46% 5,499 1240–1400 70% 27–32 63%
University of Hawaii at Manoa 16,244 58% 2,024 1070–1270 70% 21–26 42%
University of Houston 25,393 65% 5,680 1140–1310 88% 22–27 36%
University of Idaho 8,071 78% 1,475 1010–1240 98% 20–27 34%
University of Illinois—Chicago 22,696 73% 4,381 1030–1260 81% 21–28 28%
University of Illinois—Urbana-Champaign 43,509 59% 7,665 1220–1480 79% 27–33 55%
University of Iowa 25,928 83% 4,986 1130–1340 29% 22–29 87%
16THE COMPETITIVE LANDSCAPE
SAT Total ACT Comp
Number of Admit Class 25th–75th Submit 25th–75th Submit
Applicants Rate Size Percentile SAT Percentile ACT
University of Kansas 15,093 93% 4,058 N/A N/A 23–29 97%
University of Kentucky 18,759 96% 5,348 1070–1310 23% 22–29 88%
University of La Verne 6,864 55% 495 1040–1190 91% 19–24 21%
University of Maine 13,118 90% 2,140 1050–1260 94% 21–27 11%
University of Mary Washington 5,939 75% 912 1090–1260 77% 23–29 18%
University of Maryland—College Park 32,987 44% 4,285 1280–1480 82% 29–33 31%
University of Massachusetts—Amherst 42,157 64% 5,766 1190–1390 89% 26–32 18%
University of Memphis 15,381 81% 2,683 1010–1230 6% 19–26 96%
University of Miami 38,919 27% 2,203 1280–1420 57% 29–32 38%
University of Michigan—Ann Arbor 64,972 23% 6,830 1340–1530 63% 31–34 48%
University of Minnesota—Twin Cities 40,673 57% 6,278 1260–1480 18% 26–31 89%
University of Mississippi 16,253 88% 3,232 1020–1250 26% 21–29 85%
University of Missouri 18,948 78% 4,673 1090–1290 10% 23–29 90%
University of Montana 4,910 94% 1,482 1055–1245 39% 20–26 71%
University of Nebraska—Lincoln 16,829 78% 4,748 1120–1360 12% 22–28 92%
University of Nevada—Las Vegas 12,720 81% 4,465 1030–1250 33% 19–25 83%
University of New Hampshire 18,040 84% 2,730 1070–1270 93% 22–28 13%
University of New Mexico 12,281 49% 2,594 1040–1270 30% 19–25 83%
University of North Carolina—
42,466 23% 4,180 1300–1490 52% 27–33 69%
Chapel Hill
University of North Carolina—Charlotte 21,867 65% 3,652 1120–1290 71% 22–26 61%
University of North Carolina—
9,972 82% 2,746 1000–1160 65% 19–24 62%
Greensboro
University of North Carolina—
13,287 66% 2,330 1170–1320 46% 22–27 62%
Wilmington
University of North Dakota 4,964 81% 1,673 1010–1250 13% 20–26 88%
University of North Georgia 6,224 76% 1,927 1080–1220 75% 23–27 27%
University of North Texas 21,540 74% 5,509 1060–1250 83% 20–26 43%
University of Notre Dame 22,200 16% 2,051 1400–1550 42% 32–35 58%
University of Oklahoma 15,673 80% 4,523 1130–1310 42% 23–29 82%
University of Oregon 27,358 82% 4,463 1100–1310 70% 22–28 33%
University of Pennsylvania 44,961 8% 2,400 1450–1560 62% 33–35 38%
University of Pittsburgh 32,091 57% 4,026 1260–1440 83% 28–33 34%
University of Portland 14,505 62% 1,004 1160–1330 77% 23–29 37%
University of Puget Sound 5,182 84% 615 1150–1370 59% 25–30 37%
University of Redlands 4,713 75% 702 1100–1250 71% 23–28 28%
University of Rhode Island 21,259 72% 3,189 1012–1345 92% 20–29 15%
University of Richmond 12,356 28% 832 1290–1460 64% 30–33 36%
University of Rochester 20,216 30% 1,387 1300–1500 64% 29–33 28%
University of San Diego 13,755 49% 1,142 1200–1350 69% 26–31 43%
University of San Francisco 21,867 48% 1,293 1130–1330 72% 23–29 36%
University of South Carolina 31,268 69% 6,279 1180–1370 65% 25–31 35%
University of South Dakota 4,434 86% 1,321 990–1180 5% 19–25 92%
University of South Florida 36,986 48% 5,113 1170–1330 74% 25–29 26%
University of Southern California 66,198 11% 3,168 1370–1520 68% 31–34 42%
University of St. Thomas (MN) 6,718 83% 1,412 1160–1350 8% 24–29 95%
University of Tennessee 21,764 79% 5,239 1150–1330 23% 24–30 88%
University of Texas—Arlington 12,650 83% 3,707 1040–1250 80% 20–27 23%
University of Texas—Austin 53,525 32% 8,170 1240–1470 79% 27–33 54%
University of Texas—Dallas 14,327 79% 3,997 1240–1460 85% 26–33 42%
17THE COMPETITIVE LANDSCAPE
SAT Total ACT Comp
Number of Admit Class 25th–75th Submit 25th–75th Submit
Applicants Rate Size Percentile SAT Percentile ACT
University of Texas—El Paso 10,972 100% 3,599 900–1110 75% 17–22 23%
University of Texas—Rio Grande Valley 10,680 80% 4,793 950–1130 52% 17–22 71%
University of Texas—San Antonio 17,122 77% 4,590 1030–1220 86% 19–25 34%
University of the Pacific 13,096 66% 808 1130–1360 85% 23–31 31%
University of Toledo 10,228 95% 3,037 1000–1240 27% 20–26 79%
University of Tulsa 9,793 36% 831 1090–1360 39% 24–31 82%
University of Utah 24,404 62% 4,040 1140–1380 26% 22–29 79%
University of Vermont 19,233 67% 2,636 1180–1360 79% 26–31 31%
University of Virginia 40,839 24% 3,920 1340–1500 79% 30–34 34%
University of Washington—Bothell 4,242 74% 829 1038–1250 83% 19–28 25%
University of Washington—Seattle 45,579 52% 6,992 1240–1440 81% 27–33 30%
University of Wisconsin—Milwaukee 8,946 95% 3,613 1030–1240 7% 19–24 92%
University of Wisconsin—Madison 43,921 53% 7,550 1330–1450 28% 27–32 79%
University of Wyoming 5,348 96% 1,760 1060–1280 37% 22–28 74%
Ursinus College 3,530 52% 431 1150–1350 72% 24–30 17%
Utah State University 15,276 91% 4,411 1050–1310 15% 21–28 90%
Valparaiso University 5,491 86% 646 1070–1290 65% 22–29 43%
Vanderbilt University 37,310 9% 1,604 1460–1560 49% 33–35 52%
Vassar College 8,961 24% 691 1370–1530 69% 31–34 40%
Villanova University 22,909 28% 1,695 1320–1470 61% 31–34 39%
Virginia Commonwealth University 17,244 87% 4,461 1080–1250 85% 21–28 17%
Virginia Military Institute 1,515 60% 482 1090–1270 93% 21–28 33%
Virginia Polytechnic Institute and State
31,974 70% 7,651 1180–1390 87% 25–31 27%
University
Wabash College 1,307 64% 229 1120–1320 82% 23–29 56%
Wake Forest University 12,559 30% 1,360 1320–1490 44% 30–33 45%
Washington and Jefferson College 2,722 85% 291 1090–1280 60% 22–28 21%
Washington and Lee University 6,178 19% 462 1460–1500 55% 32–34 45%
Washington College 2,225 92% 325 1090–1300 74% 20–29 21%
Washington State University 21,434 76% 4,716 1020–1230 85% 20–26 24%
Washington University in St. Louis 25,426 14% 1,732 1470–1570 33% 32–35 71%
Wayne State University 15,716 73% 2,968 1010–1230 88% 21–27 21%
Weber State University 6,853 89% 3,163 N/A 0% 18–24 89%
Wellesley College 6,395 22% 612 1360–1530 72% 31–34 38%
Wesleyan University 13,264 17% 771 1320–1510 63% 31–34 39%
West Virginia University 18,639 82% 4,732 1050–1240 57% 21–27 65%
Western Kentucky University 8,245 97% 2,714 990–1220 11% 19–27 95%
Western Michigan University 17,698 80% 2,919 1000–1210 82% 19–26 29%
Westmont College 2,937 62% 344 1110–1370 77% 23–30 42%
Wheaton College (IL) 1,889 85% 614 1220–1440 62% 26–32 55%
Wheaton College (MA) 3,460 74% 506 1150–1340 49% 27–32 8%
Whitman College 4,832 56% 425 1240–1450 45% 28–33 26%
Whittier College 6,220 76% 512 1030–1213 74% 20–25 35%
Willamette University 3,972 78% 371 1140–1340 73% 31–35 34%
Williams College 9,715 13% 546 1410–1550 57% 32–35 59%
Wofford College 3,787 60% 474 1190–1350 43% 26–30 35%
Worcester Polytechnic Institute 10,645 49% 1,203 1310–1470 71% 29–33 24%
Xavier University 14,758 76% 1,210 1070–1280 40% 22–28 74%
Yale University 36,844 6% 1,550 1460–1570 68% 33–35 50%
Yeshiva University 1,660 55% 559 1160–1400 43% 24–30 55%
18UNDERSTANDING AND COMPARING SCORES
Understanding and Comparing Scores
SCALED SCORES AND TEST RELIABILITY
One of the most important features of standardized tests is their ability to provide consistent scores from year to
year and from test date to test date. SAT scores are converted to a 200–800 scale in order to account for any small
differences between tests; ACT scores are converted to a 1–36 scale.
Standardized test makers follow strict guidelines when setting their initial reference group and determining the
initial scale. Once those things are set, they rarely change because they don’t need to. A 30 on ACT English means
the same thing whether it was taken in September 2008 or September 2018. In order to accomplish this feat, one
additional concept must be added—equating. Not every test can have the same questions, so not every test form
can have the exact same difficulty. However, by always mapping performance back to the reference group, ACT can
make small adjustments to the scale to smooth away these differences. The math is tricky, but the goals are simple.
Make the results of each test date as fair as any other test date and make sure that no student is disadvantaged by
the abilities of other students taking the exam.
RAW SCORES AND GUESSING
An important area in which the SAT and ACT are finally aligned is in scoring correct, incorrect, and blank answers.
The old SAT made a one-quarter raw
point deduction for each wrong answer Leaving Blank Random Guessing Process of Elimination
to dissuade students from random 1 A B C D 1 A B C D 1 A B C D
guessing. The current SAT eliminates 2 A B C D 2 A B C D 2 A B C D
this so-called guessing penalty. The 3 A B C D 3 A B C D 3 A B C D
SAT and the ACT now both use “rights- 4 A B C D 4 A B C D 4 A B C D
5 A B C D 5 A B C D 5 A B C D
only” scoring, meaning that the number 6 A B C D 6 A B C D 6 A B C D
of correct answers is all that matters. 7 A B C D 7 A B C D 7 A B C D
Students should never leave a multiple 8 A B C D 8 A B C D 8 A B C D
choice question blank on either exam. Raw Points: 0 Raw Points: 2 Raw Points: 4
Even without the guessing penalty, the
“THE WEALTH OF INFORMATION AND
SAT and ACT are best approached with a guessing strategy. Students stand TESTING SUPPORT THE COMPASS STAFF
to maximize their points when they go into the test with a plan for where HAVE PROVIDED TO OUR FAMILIES
to invest their time. This may include being prepared to guess randomly on HAS BEEN INSTRUMENTAL IN HELPING
portions of the test due to lack of time. Guessing is still more effective than OUR STUDENTS ACHIEVE THEIR BEST
SCORES. ”
leaving questions blank.
CLARA BIRD, DIRECTOR OF COLLEGE
COUNSELING, PROVIDENCE HIGH SCHOOL
EXPERIMENTAL SECTIONS
The ACT includes a 20-minute experimental section after the Science Test. College Board may present students with a
similar experimental section after the final math section on the SAT.
Although this experimental section will not count toward your score, you should take it seriously.
19You can also read