Columbia River Gorge Commission Data Review - GETTING OUR DATA HOUSE IN ORDER Jessica Gist
←
→
Page content transcription
If your browser does not render page correctly, please read the page content below
Columbia River Gorge
Commission Data Review
GETTING OUR DATA HOUSE IN ORDER

Jessica Gist
COLUMBIA RIVER GORGE COMMISSION | JULY 2017
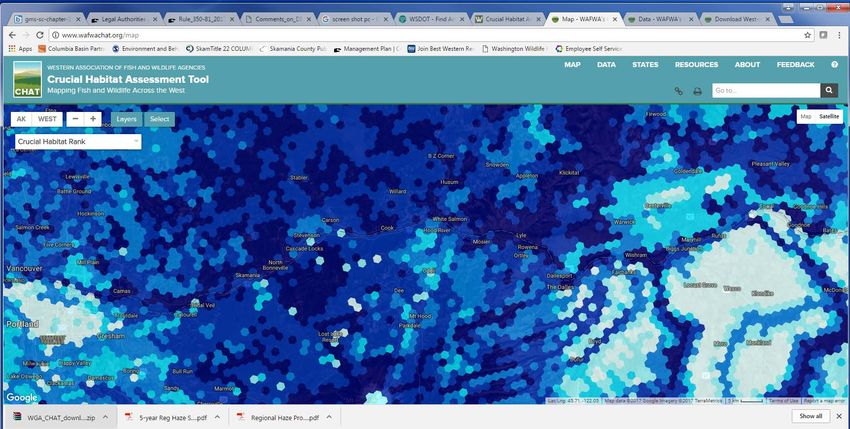
TABLE OF CONTENTS
               I.      Executive Summary                                                        V.      Natural Resources
               II.     Introduction                                                             VI.     Recreation Resources
               III.    Scenic Resources                                                         VII.    Land Use and Economic Development
               IV.     Cultural Resources                                                       VIII.   Additional Resources

                                                           EXECUTIVE SUMMARY
The Columbia River Gorge Commission (Commission) is responsible for maintaining several datasets and uses spatial information to regulate land use in
the National Scenic Area’s General Management Area. The Commission is currently reviewing the National Scenic Area Management Plan, last updated in
2004, through the Gorge 2020 review and update process. The original Management Plan was informed in part by resource inventories and assessments.
Spatially explicit datasets that were gathered or developed for those inventories have been maintained and updated over time by the Commission and
agency partners. Staff has reviewed the data inventories, modeled “overlays”, and regularly updated data that inform the National Scenic Area Management
Plan (Plan) and its implementation by the Commission, US Forest Service, and gorge counties. We identified a few questions to work through, as well as
related datasets that can inform the Commission’s decision making. The purpose of this brief report is to review these datasets, clarify how they are used
for project evaluation purposes and as policy “triggers”, and document the process of inventory review for Gorge 2020. This report also provides a basis
for improved coordination with the USFS, counties, and the “data-keepers” working in the Gorge. The Commission and our regional partners possess and
maintain a great deal of relevant information. This data review has been an opportunity to document and organize our spatial data in a way that improves
our effectiveness and efficiency. The last page of this report contains a reference list of additional survey and study reports that we believe can inform
revisions to the Plan.
A careful evaluation of our data meets several agency needs:

   •   Gorge 2020 requires a thoughtful look at current science and information to inform the process and our priorities for Plan revision.

   •   The current Plan and ordinances require planners to use certain datasets to determine the level of review, the type of engagement they have with
       experts, and some standards for development (buffers, etc.).

   •   The NSA is a multi-jurisdictional landscape; just as we coordinate other information we need to coordinate spatial data to ensure consistent and
       up-to-date implementation of the Plan.

   •   Status and trends information is critical to informed decision making. This survey of the types of information that are currently available to us
       through partners and “data keeper” agencies provides context for future discussion.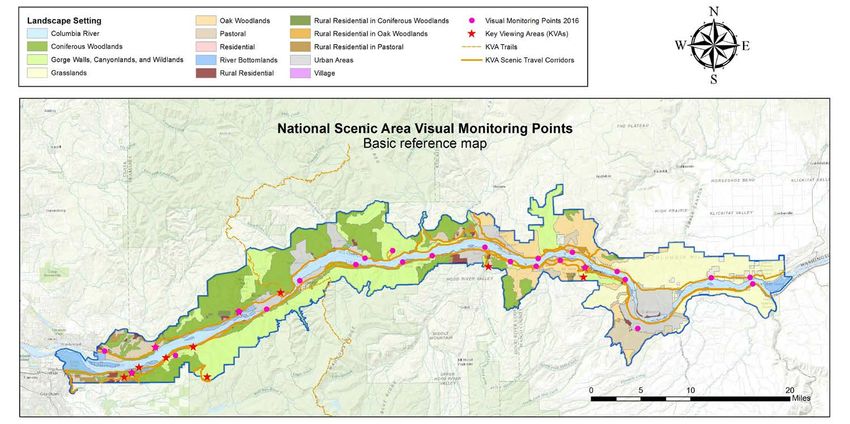
INTRODUCTION
The Scenic Area Act directs the Gorge Commission and the Forest Service to inventory, protect, and enhance scenic, cultural, natural, and recreation
resources. An extensive inventory process was used to inform the delineation of Special Management Areas, Land Use Designations that remain in place
today. Additional zoning “overlays” including the Recreation Intensity Classes and deer and elk winter range have been developed as planning and policy
tools.
The Scenic Area Act also requires the Management Plan to protect and enhance open spaces [Section 6(d)(3)]. Land Use Designations, established in 1992,
protect the National Scenic Area’s resources by designating sensitive areas as Open Space (approximately 77,140 acres) or GMA Agriculture-Special
(approximately 214 acres), relying on the inventory data collected.
Open Space is defined in the Act to include 1) scenic, cultural, and historic areas, 2) fish and wildlife habitat, 3) lands which support plant species that are
endemic to the scenic area or which are listed as rare, threatened, or endangered species pursuant to State and Federal endangered species acts, 4)
ecologically and scientifically significant natural areas, 5) outstanding scenic views and sites, 6) water areas and wetlands, 7) archaeological sites, Indian
burial grounds and village sites, historic trails and roads and other culturally or historically significant, 8) potential and existing recreation resources, and
9) Federal and State wild, scenic, and recreation waterways [Section 2(l)]. The initial designation of Open Space was intended to achieve protection for
each of the resources described below. The Land Use Designations serve as the first “layer” of resource protection in the National Scenic Area.

                                                                                                                                                     1|Page
Table 1. DRAFT DATA DIRECTORY. The primary datasets maintained or used by the CRGC and USFS to implement the Management Plan. An updated data directory, with file
names and metadata, will be shared with the gorge planners once complete.

   Use             Category         Dataset                                                                 Source / Data Steward            Regularly updated?
                                    GMA/SMA/UA boundaries                                                   CRGC                             Yes - as needed
                                    National Scenic Area boundary                                           CRGC                             Yes
                    Boundaries/
                                    Land Use Designations                                                   CRGC                             Yes
    Base Data        Land Use       Ownership                                                               USFS                             Yes
                                    Parcel and taxlot data                                                  Counties                         Yes
                                    LiDAR                                                                   USFS, others
                                    Seen Areas model of visibility from KVAs (all? Scenic drives?)          CRGC                             No
                       Scenic       Landscape Settings                                                      CRGC                             No
                                    Key Viewing Areas, roads, trails                                        CRGC                             No
                                    Cultural resources probability model (2005)                             CRGC                             No
                                    Recorded historic and archaeological sites CONFIDENTIAL                 DAHP, SHPO                       Yes – real time
                      Cultural      Roadside inventory of buildings for potential historic significance
                                    (2012)                                                                  USFS                             No
                                    All streams                                                             USGS NHD                         Yes
                                    Wetlands and springs                                                    USGS NHD via USFS, DEQ           Yes – evaluating
                                    Sensitive habitats: Natural Areas Inventory                             USFS/CRGC                        No
                                    Sensitive species and habitats: vegetation mapping (oak, aspen,         USFS                             Yes - evaluating
                                    riparian) and survey locations
                                    Sensitive species and habitats: State priority spp and habitats         WDFW PHS, ODFW Compass,          Yes
     Project          Natural                                                                               ORBIC
    Evaluation       Resources
                                    Sensitive species and habitats: deer and elk winter range               ODFW, WDFW, WAFWA                Yes
                                    Sensitive species and habitats: "Public interest species" great blue    Available in ORBIC Point         Yes - evaluating
                                    heron, prairie falcon, etc.                                             Observation Database

                                    Rare plant inventory (1993)                                             USFS and other experts           No
                                    Rare plant observations                                                 WNHP and ORBIC                   Yes
                    Tribal Treaty   In lieu fishing sites                                                   CRITFC
                       Rights
                                    Public recreation sites                                                 USFS                             Yes – as needed
                    Recreation      Public recreation trails                                                USFS                             Yes – as needed
                                    Private recreation sites and trails                                     Various                          Evaluating
                                    Recreation Intensity Classes                                            CRGC                             No
                                    Buildable Lands Inventory (in press)                                    CRGC
                     Land Use       Development approvals (in press)                                        CRGC/Counties
     Other                          Vital Signs Indicators (VSI, 2008). VSI is a program of monitoring      CRGC via internal and external   Somewhat. In 2016 the Commission
     helpful                        high-level indicators of the National Scenic Area’s scenic, cultural,   datasets                         began a strategic paring down of
   spatial data                     natural, recreation, and economic resources.                                                             the 51 indicators to measurable and
                                                                                                                                             meaningful metrics that inform
                                                                                                                                             discourse and decision making.
                                                                                                                                                                              2|Page
SCENIC RESOURCES
The Columbia Gorge is world renowned for its outstanding scenic beauty. The sea level chasm the Columbia River has cut
through the Cascade Mountains, and the dramatic diverse landscapes it contains, create unparalleled grandeur. Within an
hour's drive, one can witness towering cliffs and forests, orchards and farms, and sweeping grasslands.
~Columbia River Gorge National Scenic Area Management Plan, as amended (2011), I-1-1
CURRENT GUIDANCE FOR SCENIC RESOURCES SPACIAL INFORMATION AND DATA
The Plan identifies Key Viewing Areas (KVA) and Scenic Travel Corridors and Trails throughout the gorge. The GMA and SMA have standards for achieving
visual subordinance or being “not visually evident” as seen from these KVAs. Visual impacts are evaluated in part by the degree to which development is
compatible with the applicable Landscape Setting, its defining characteristics, and its associated uses.
INVENTORIES AND DATASETS
A “seen areas” model provides planners with a coarse filter and conservative indication of which KVAs may be impacted by a development. There are new
tools for evaluating scenic impacts, such as GoogleEarth and topographic profiles. Still, on-the-ground investigation or validation is always necessary.
Landscape Settings and the Building in the Scenic Area Handbook provide some very clear and conceptual standards that certain developments must meet.
The 1990 Columbia River Gorge National Scenic Area Corridor Visual Inventory is referenced in the Plan to be used for evaluating utility line
undergrounding.
Vital Signs Indicators
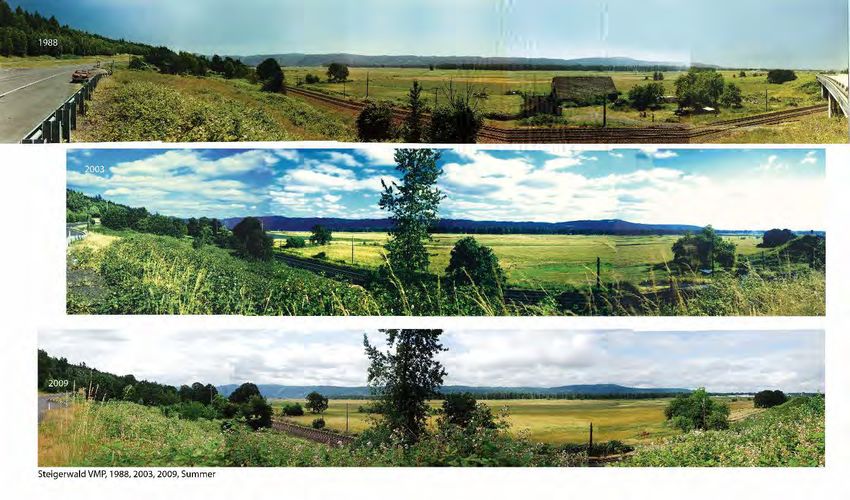
Regular monitoring occurs at 27 Visual Monitoring Points (VMPs) throughout the gorge. Panoramic photos have been taken in winter and summer at each
location in 1988, 2003, 2009, and 2016. These have been used to compare the number of visible buildings over time from 12 of the viewpoints. The original
USFS contract from 1987 for Fixed Point Monitoring in the NSA was written to provide evidentiary pictorial record for land management planning and to
inform Existing Visual Condition. The photos were also meant to assist the USFS in project planning for a range of developments. The USFS recommended
including VMPs as a subset of or complement to their larger Camera Point System.
3|Page
Figure 1. National Scenic Area Landscape Settings, Key Viewing Areas, and Visual Monitoring Points

                                                                                                     4|Page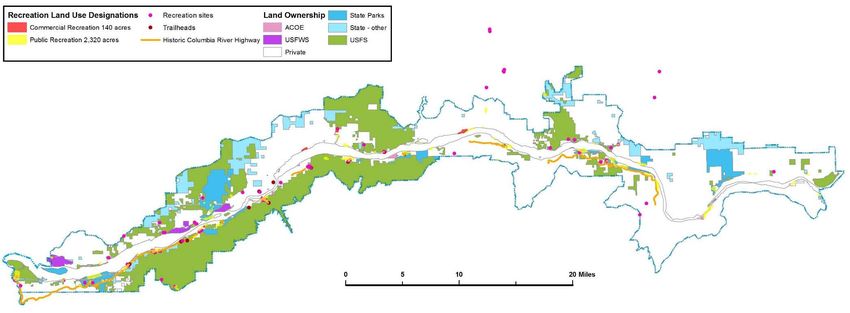
Staff at the CRGC have used the VMP photos to compare the visual impacts of development over time. Table 2 appeared in the 2009 Vital Signs Indicators
report. While this type of data may be useful for identifying areas where rapid development warrants a closer look, it has significant limitations. The VMP
program was designed to capture a complete view of the gorge; it was not designed with Landscape Settings in mind. Development in the National Scenic
Area is, in part, guided by compatibility with Landscape Settings. The appearance of a new building on the landscape is not necessarily incompatible with,
for example, a Rural Residential Landscape Setting or a Pastoral Landscape Setting. In the example below (Fig. 1), there are fewer buildings in the
foreground of this view in 2003 and 2009 than there were in 1988. In this case, aging barn structures were removed from an agricultural parcel. While the
number of visible buildings decreased, distinctive features of the pastoral character of this area were lost. It is tempting try to reduce visual impacts to
quantitative trend data. However not all buildings or structures are created equal. We recommend a re-focusing on compatibility with well-defined
Landscape Settings. Staff from both agencies are pursing efficient ways to achieve this using the data we already have.

Table 2: Visual Monitoring Point summary, Vital Signs Indicators Report 2009. The number of visible buildings was compared over time. Staff recommend a more qualitative
evaluation of scenic impacts, because this implies that all buildings are equivalent. New or altered buildings can maintain, degrade, or even enhance the scenic character of a
landscape. Further, the CRGC protects scenic resources primarily by minimizing negative impacts to Key Viewing Areas and travel corridors. This dataset does not evaluate how
well we are achieving visual subordinance standards.

 Vantage Point                                  1988 Buildings                  2003 Building Count                Change
 Steigerwald Lake                               17                              30                                 13
 Crown Point                                    57                              74                                 17
 Cape Horn                                      29                              29                                 0
 Upper Beacon Rock                              44                              43                                 -1
 Dog Mountain                                   3                               6                                  3
 Mitchell Point                                 13                              14                                 1
 Hood River Jetty                               49                              43                                 -6
 Straights Point                                17                              22                                 5
 Memaloose Overlook                             40                              42                                 2
 Rowena Crest Viewpoint                         49                              41                                 -8
 Squally Point                                  11                              11                                 0
 Avery Boat Launch                              1                               2                                  1
 Total                                          330                             357                                27

                                                                                                                                                                   5|Page
Figure 2. Visual Monitoring Point photos capture change over time from 27 locations in the Gorge.

                                                                                                    6|Page
AVAILABLE AND RELEVANT INFORMATION
Staff is currently investigating how to use existing data and information to describe landscape settings and evaluate compliance with the compatibility
standards in the Plan. USFS is also working on more specific and detailed Landscape Settings descriptions to guide allowable uses and developments that
will be compatible with the character of the settings. Through a service contract, we are gathering photos of Landscape Settings and their exemplary
characteristics. In the future, we hope to be able to monitor and evaluate the effects of development in terms of Landscape Settings and their defined
characteristics and uses. The Building in the Scenic Area Handbook and other guidance documents can include more examples of what we do want to see.
There have been good examples of visually subordinate developments that we could photograph and include in a revised Handbook.
The methods and locations of VMPs were developed in the 1980s. Today, access to several of the points is compromised. Further, the original methods
focus on creating seamless and consistent panoramic shots. Technology has vastly improved so that an iPhone panoramic photo may be just as good and
save post-processing time.

Light pollution
The effects of artificial nighttime lighting have been documented to include
changing wildlife behaviors and migrations, impeding star gazing and
astronomy, safety, and even affecting human health.
Rose City Astronomers and other local groups are beginning to photograph
and document night skies in the Gorge. The International Dark Skies
Association has developed numerous recommendations for policies and
standards to protect dark skies. Currently, exterior lighting on a development
that is visible from KVAs must adhere to certain standards.

                                                                                 Figure 3. An example of night sky monitoring. Photos like this capture a 360 degree skyward
                                                                                 view from a single location, resulting in "blips" of light that represent bright development.

                                                                                                                                                                    7|Page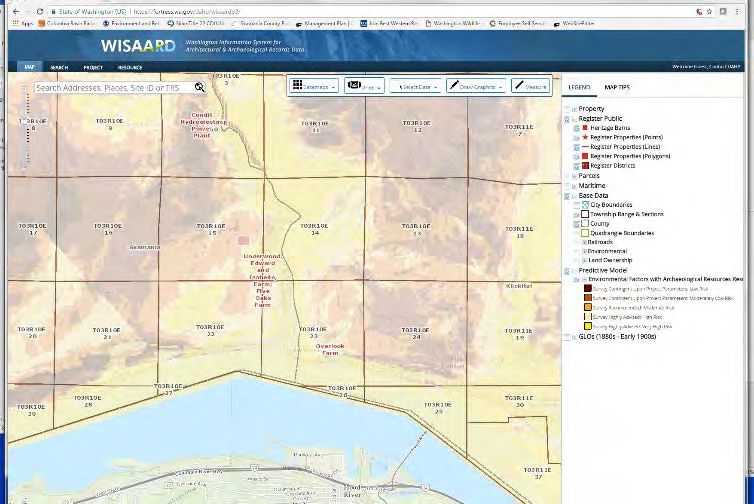
CULTURAL RESOURCES

Cultural resources are the evidence of past human activity that are important in the history, archaeology, architecture, or
culture of a community or region... A rich and diverse array of cultural resources exists in the Scenic Area.
                                               ~Columbia River Gorge National Scenic Area Management Plan, as amended (2011), I-2-1

CURRENT GUIDANCE FOR CULTURAL RESOURCES SPACIAL INFORMATION AND DATA
The Management Plan defines cultural resources to include 1) archaeological resources, 2) historic buildings and structures, 3) traditional cultural
properties, which include ceremonial sites or traditionally gathered plants like camas, 4) tribal treaty rights. Tribal treaty rights are addressed throughout
the plan and in a separate chapter describing the consultation process.
Planners are directed to review specific datasets to determine the level of survey needed (if any) and the responsible party. Proximity to known sites can
lead to a survey requirement. If resources are located on any parcel, discretion goes to the NSA archaeologist, states, and tribes (as appropriate) to
determine significance and recommend mitigations.

INVENTORIES AND DATASETS
A cultural probability model was developed for the National Scenic Area in 2002 to identify likely areas of prehistoric and historic archaeological resources.
Each state’s historic preservation office uses its own model of probability to inform project review. Washington’s Department of Archeology and Historic
Preservation office hosts an online tool with a statewide cultural probability model. This could be a helpful resource but the model’s parameters and
assumptions should first be carefully considered. Ground-truthing may be needed to validate its usefulness in the National Scenic Area.
The NSA archeologist also uses a 2005 roadside inventory of potentially significant historic buildings for project review. The inventory provides valuable
information and can serve as a trigger for historical survey of a development site.
Documented archeological sites are maintained by the State Historic Preservation Offices. DAHP keeps National and State Register listed sites and survey
reports in its WISAARD database. They share those with the USFS through an MOU and update the database with all of our project survey data when we
submit to them.
CRITFC manages 31 fishing sites along the Columbia River (within Zone 6). In lieu fishing sites and treaty fishing access sites are mapped and inform our
assessment of the impacts a proposed project might have on tribal treaty rights.

                                                                                                                                                   8|Page
AVAILABLE AND RELEVANT INFORMATION
Reconnaissance surveys are required for certain proposed uses and near known sites until the entire GMA has been surveyed. The methods of data
collection and reporting do not lend themselves to a simple estimate of how much area has been surveyed, but we could determine how many parcels have
had some survey on some portion. Going forward, we could require certain surveys to report GPS perimeters of the survey area.
The Commission has relied exclusively on the staff at the USFS NSA office to provide reconnaissance surveys of all small-scale undertakings as defined in I-
2-6 of the Plan. Tools like the 2005 “drive by” inventory of historic buildings can assist the archaeologist in flagging potential resource concerns early. There
are likely structures that would now be deemed historic not documented in the inventory.
Additional areas could be mapped, like first foods gathering places or critical areas for protection, particularly those sensitive to climate change. Without
putting lines on maps, staff could increase coordination with tribal agency staff or advisors to learn about these places. Mapping cultural resources requires
several considerations including confidentiality and the rights of sovereign tribes.
Figure 4. An example of the interactive data available online for cultural resources through DAHP.
9|PageNATURAL RESOURCES
The diverse climate of the Gorge fosters nearly 1,000 native species of wildflowers, including many species that are listed as
endangered, threatened, or sensitive. Sixteen species do not occur outside the Gorge region (endemic).
~Columbia River Gorge National Scenic Area Management Plan, as amended (2011), I-3-1
CURRENT GUIDANCE FOR NATURAL RESOURCES SPATIAL INFORMATION AND DATA
The current Management Plan contains specific protections, including avoidance buffers and mitigations, for the following resources:
• Wetlands, lakes, ponds
• Streams and riparian habitats
• Sensitive wildlife habitats and sensitive wildlife sites
• Rare plants and natural areas
• In SMA, forest resources through the review of forest practices
Recognizing that natural resources are not static, the Commission regularly updates spatial data for the purposes of our development review function. If a
known resource occurs within 1,000 feet of a proposed project, the Plan requires coordination with appropriate agencies and protections. The Plan also
guides planners to consider resources that are discovered upon inspection.
INVENTORIES AND DATASETS
Water Resources
We use a combination of National Wetland Inventory and National Hydrography Database datasets and fisheries streams data. Some wetlands, in particular
springs, are often not mapped. Local planners often coordinate with other state agencies to obtain the information they need.
Sensitive species and habitats
"Sensitive wildlife sites" is used in a generic sense in the Plan to refer to sites that are used by species that are
(1) listed as endangered or threatened pursuant to federal or state endangered species acts,
10 | P a g e(2) listed as endangered, threatened, sensitive, or candidate by the Washington Wildlife Commission,
(3) listed as sensitive by the Oregon Fish and Wildlife Commission, or
(4) considered to be of special interest to the public (limited to great blue heron, osprey, golden eagle*, and prairie falcon).
*Note: The Bald and Golden Eagle Protection Act protects both species of eagle
regardless of their ESA status
Updated lists of species included in (1), (2), and (3) above can be found
on the websites for the Washington Department of Fish and Wildlife
(Species of Concern list) and the Wildlife Division of Oregon Department
of Fish and Wildlife (Sensitive Species List). The state of Washington’s
Priority Habitats and Species List and Management Recommendations
includes 152 vertebrates, 41 invertebrates, and 20 habitats. Oregon’s
sensitive species list was updated in 2016 and includes 95 wildlife
species and 54 fish. A list also is maintained by the USDA Forest Service –
Scenic Area Office and available at the Gorge Commission office and on its
website. Item (4) is partially maintained by ORBIC in Point Observation
Data – this is opportunistic and not always verified but contains
information not captured in other datasets.
Figure 5. WDFW's online planning tool, Priority Habitats Database. The Department shares data
We utilize a variety of datasets to identify sensitive habitats, including the directly with the Commission, including protected information.
USFS vegetation mapping for Oregon white oak and a unique deer and
winter range dataset. We also receive regularly updated fisheries stream data.
Rare Plants and Natural Areas
The Commission and USFS mapped Natural Areas based in part on a rare plant inventory conducted in 1993. Up to date observation data for rare plants
is maintained by the state agencies:
• Washington Department of Natural Resources, Washington Natural Heritage Program database
• Oregon State University Institute for Natural Resources, Oregon Biodiversity Information Center (ORBIC)
These programs use shared standards developed by the Nature Conservancy and NatureServe to track observations of rare plants and animals. Each state
wildlife agency regularly sends them updates. We also have the original 1993 inventory data that include locations for plants that are not captured in the
statewide datasets. This example highlights the important role the Commission plays in evaluating partner data and disseminating these datasets to the
counties so that we are using consistent and comprehensive information.
11 | P a g eAVAILABLE AND RELEVANT INFORMATION
Water Resources and Riparian
These data are often challenging to collect and manage on a fine scale. We are working with the USFS and other agencies to evaluate the available data
and be sure we have the most locally relevant information.
Sensitive wildlife habitats and sites
Each state wildlife agency has recently updated its strategic plan for wildlife and habitat conservation. These efforts are extremely data-driven and have
resulted in the most up-to-date spatial information. These are the datasets we obtain regularly from the agencies. During the course of this review we
also learned that new, more refined data are available for deer and elk winter range and we will share those to the counties.
Several groups are trying to map cold water refugia for fish, which might be a priority habitat. Other climate change sensitive species like the pika are
already included in the updated sensitive species list for each state.
Numerous conservation priorities efforts are going on in this area. Figure 6 displays a screen shot of information available on the website for the Western
Association of Fish and Wildlife Agencies (WAFWA). Each state is also mapping and modeling priorities for conservation and restoration (Fig. 7). A
“wetlands of high conservation value” map is coming soon from the Washington Heritage Program.
The current plan creates some confusion by listing certain specific species and habitats, including those inventoried to develop the first plan. The
language is clearly inclusive of the species and habitats identified by the state and federal agencies with wildlife management authority. The plan could
explicitly tier to appropriate lists or standards, allowing those lists to be updated over time. An example is species listed under the federal Endangered
Species Act.
• USFWS’s IPaC federally listed species, (candidate species), and critical habitats with potential occurrence in the National Scenic Area
Fishes: bull trout, Chinook salmon, chum salmon, Coho salmon, sockeye salmon, steelhead
Birds: northern spotted owl, streaked horned lark*, yellow-billed cuckoo*
Mammals: gray wolf, (North American wolverine)
Herpetiles: Oregon spotted frog*
* New listing since last Plan review
12 | P a g eFigure 6. An example of priority habitat modeling, in this case the Western Association of Fish and Wildlife Agencies. Crucial Habitats are mapped for a suite of terrestrial species, aquatic species,
and combined.
13 | P a g eThe Oregon Department of Fish and Wildlife
maps Conservation Opportunity Areas, a
compilation of science-based conservation and
restoration priorities from organizations
including Columbia Land Trust and Lower
Columbia Estuary Partnership.
Guidance documents are available to assist
local landowners with habitat management on
private lands: Underwood Conservation
District Landowner Handbook, Management
Recommendations for WA Priority Habitats,
Multnomah Soil and Water Conservation
District, etc.
Figure 7. Conservation Opportunity Areas are those where groups are actively working on habitat protection or restoration.
Columbia Gorge Cooperative Weed Management Area includes the entire National Scenic Area and most of each of the six NSA counties. In addition to
data and information, the CWMA publishes BMPs for specific weeds.
Fire protection standards are currently only explicitly applied to GMA Forest LUDs. However, the USFS Fire Management Plan for the NSA could be
starting point for identifying where in the NSA fire protection or risk reduction might be most needed as well as potential policy changes.
There are many more natural resources data and information sources. Several are listed in the references at the end of this document.
What about VSI?
• Pacific Northwest Aquatic Monitoring Partnership is developing regional shared indicators for water temperature, flow, water quality,
macroinvertebrates. We are a member of the water quality indicators working group.
• Air quality monitoring - March 2017 Oregon DEQ submitted 5-Year Progress Report
• Rose City Astronomers are taking night sky photos to document light pollution and there is local interest in working on the issue. We currently
require hooded/shielded lighting but could do more to incorporate International Dark Sky Alliance guidance through policy and/or the Handbook
14 | P a g eRECREATION RESOURCES
It’s magnificent panoramas, waterfalls, and rock formations have awed sightseers in large numbers since the construction
of the Historic Columbia River Highway during and after World War I. Excellent opportunities for fishing, hiking and other
outdoor activities abound. The recreation identity of the Gorge has expanded to include windsurfing, kite sailing, rafting
and mountain biking.
~Columbia River Gorge National Scenic Area Management Plan, as amended (2011), I-4-1
CURRENT GUIDANCE FOR RECREATION RESOURCES SPACIAL INFORMATION AND DATA
[The Commission is] directed to assess recreation resources and opportunities for enhancement of these resources, as part of the inventory process.
Section 6(a)(3) of the Act called for a "recreation assessment“of:
• Areas suitable for public use facilities, including educational and interpretive facilities, camping, and boating areas
• Areas for increased access to the River and tributaries compatible with treaty and other rights of Indian tribes
This in part lead to the Land Use Designations for Public Recreation (2,320 acres) and Commercial Recreation (140 acres). The Commission is directed to
protect open space for its value for current and future recreation use, as one of the nine types of open space described in the Act.
INVENTORIES AND DATASETS
In 2012 the Interagency Recreation Team (IRT) inventoried 99 public recreation sites and assessed the capacity and demand for each throughout the
season (see Fig. 8). Private recreation may be more difficult to track. Towns To Trails and the strategy of dispersing use to the eastern gorge likely means
increasing recreation use on private lands. A 2013 report on bicycle recreation in the gorge estimated that 230,000 annual bicycle trips generate over
$21 million in visitor spending in gorge communities (Dean Runyan Associates 2014). The report further details the distribution of these economic
benefits across communities with a focus on those along the Historic Columbia River Highway.
15 | P a g eFigure 8. Mapped recreation sites for public use the National Scenic Area
Part III, Chapter 1 of the Plan provides the Recreation Development Plan policy framework; The Recreation Development Proposals list is adopted
separately to implement the Development Plan. These were to be the framework for strategic and more regularly updated recreation planning at the
landscape level.
16 | P a g eFigure 9. Existing recreation sites and current recreation land use designation in the National Scenic Area.
In light of growing recreation demand and increased visitation, the Interagency Recreation Team also worked with resource specialists to create an
inventory of 26 “hotspots”. These are places where managers have observed impacts to natural and cultural resources, congestion and crowding,
unauthorized trails, etc. The map offers an example of a prioritization for focusing future recreation planning and attention. Capacity and use levels have
been addressed in part by establishing Recreation Intensity Classes. These appear in Figure 10 and include Recreation Intensity Class 1-4 (excludes BIA,
UA)
• 1 – 131,280 acres
• 2 – 85,000 acres
• 3 – 14,000 acres
• 4 – 3,530 acres
17 | P a g eFigure 10. The current Recreation Intensity Classes and public recreation developments.
AVAILABLE RELEVANT INFORMATION
National Visitor Use Monitoring was conducted for the USFS Region 6 in 2016. Results are not yet published, but the methodologies are used across the
country and at regular intervals in this region, allowing comparisons over time and among National Forests experiencing similar issues. Dr. Sam Lankford
is currently conducting a mail survey of Gorge residents to determine attitudes toward recreation and related issues. Results are expected to be reported
back to the Commission this summer or fall.
Recreation managers report regularly that the Recreation Intensity Classes are out of step with current visitor use. Crowding, parking, resource impacts,
and other concerns are well documented. In 2015, staff reported to the Commission on the state of recreation resources in the Gorge and on the work of
the IRT. In 2014 that group developed Interim Strategies to address the concerns of recreation managers, the public, and those documented in the Burns
report.
18 | P a g eFigure 11. Slides from 2015 presentation to the Commission on visitor use trends and recreation management concerns
The Columbia River Gorge Visitor Opportunity Study (Travel Oregon 2015) provides extensive data about recreationists in the gorge, including
motivation for visiting, satisfaction with the experience, and types of activities or accommodations they seek. The Gorge Tourism Studio launched a
partnership called the Columbia Gorge Tourism Association. They are developing a board and executive staff, inviting the Commission to hold an ex-
officio seat on the board. The organization’s mission statement is closely aligned with the strategies developed by the IRT.
The transportation connection: The Columbia River Gorge Transit Study is now in its pilot solutions phase, launching new transit options and outreach
strategies. During scoping in November of 2015, the Oregon Department of Transportation received feedback from visitors that resource degradation
was a concern and that visitor experience suffered in high-use areas. Congestion on the Historic Columbia River Highway and Multnomah Falls was also a
major issue reported. The study also concluded there is demand for recreation-based transit. After a year of operation, the strategies have been very
successful.
LAND USE AND ECONOMIC DEVELOPMENT
The data presented in each of the resources categories above inform our understanding of land use in the National Scenic Area. Staff will also present the
results of a Buildable Lands Inventory at the next Commission meeting. This assessment describes the current level and potential for development across
the National Scenic Area outside of Urban Areas. During the April 2017 Commission Meeting, presenters gave an overview of local economic statistics and
potential indicators of economic development in the National Scenic Area. Several of those resources are included in the references below, and we continue
to work on “quality of life” and other holistic indicators of community development through VSI.
19 | P a g eRECOMMENDED NEXT STEPS
This resource data review report should be considered along with the April staff report (with Appendices) summarizing public and stakeholder
comments to inform the priorities and sideboards for revisions to the Management Plan.
The direction this Commission has agreed to for Gorge 2020 is to reorganize and revise the current management plan to clarify vagaries, streamline
redundancies, and ensure it functions as an updated and “living” document for the next ten or more years. This review demonstrates that a great deal of
up-to-date information forms the basis of the current Management Plan. Where we have identified opportunities to improve the information we use, staff
is actively seeking solutions. We discovered a few specific instances where Commission staff can provide better direction to NSA counties about the
datasets we must all refer to when implementing the Plan. As the public and several agencies have clearly articulated, we recognize the Recreation
Intensity Classes require a careful evaluation as they do not address the anticipated growth in visitor use for the next ten years or more.
ADDITIONAL RESOURCES
PUBLICATIONS AND REPORTS
Bonneville Power Administration. 2014. BPA prepares for a changing climate. Fact Sheet. https://www.bpa.gov/news/pubs/FactSheets/fs-201405-BPA-
prepares-for-a-changing-climate.pdf
Dean Runyan Associates. 2014. Columbia River Gorge bicycle recreation: economic impact forecast for the communities along the Historic Columbia
River Highway. http://industry.traveloregon.com/wp-content/uploads/2014/09/Final-Final-Report.pdf
Hood River County. 2016. Coordinated population forecast: 2016-2066 Hood River County Urban Growth Boundaries (UGB) and area outside UGBs.
https://www.pdx.edu/prc/sites/www.pdx.edu.prc/files/Hood_River_County_Final_Forecast_Report_201606.pdf
Mid-Columbia Economic Development District. 2017. Columbia Gorge economic development strategy 2017-2022.
http://www.mcedd.org/documents/CEDS/Mar17/CEDS2017_draft.pdf
Nelson Nygaard for Oregon Department of Transportation. 2016. Columbia River Gorge transit study final report.
http://www.oregon.gov/ODOT/HWY/REGION1/i84construction/CRG_TransitStudy_FinalReport.pdf
Northwest Treaty Tribes. 2016. Climate change and our natural resources: a report from the Treaty Tribes in western Washington.
https://nwtreatytribes.org/climatechange/
Oregon Department of Fish and Wildlife. 2016. Oregon Conservation Strategy. Oregon Department of Fish and Wildlife, Salem, Oregon.
http://www.oregonconservationstrategy.org/
Oregon Department of Environmental Quality. 2017. Regional haze plan: 5-year progress report.
http://www.oregon.gov/deq/Rulemaking%20Docs/rhpacket.pdf
20 | P a g eOregon Department of Transportation. 2016. Columbia River Gorge transit study fact sheet.
http://www.oregon.gov/ODOT/HWY/REGION1/i84construction/TransitStudy-March2016-Factsheet-WEB.pdf
Travel Oregon. 2015. Columbia River Gorge visitor opportunities study. http://industry.traveloregon.com/content/uploads/2015/08/Travel-Oregon-
Survey-Report-1-19-2015-1.pdf
Wasco County. 2016. Coordinated population forecast for Wasco County, its Urban Growth Boundaries (UGB), and area outside UGBs 2016-2066.
http://pdxscholar.library.pdx.edu/opfp/12/
Washington Department of Fish and Wildlife. 2015. Washington’s State Wildlife Action Plan: 2015 Update. Washington Department of Fish and Wildlife,
Olympia, Washington, USA. http://wdfw.wa.gov/conservation/cwcs/
White, Eric M.; Bowker, J.M.; Askew, Ashley E.; Langner, Linda L.; Arnold, J. Ross; English, Donald B.K. 2016. Federal outdoor recreation trends: effects on
economic opportunities. Gen. Tech. Rep. PNW-GTR-945. Portland, OR: U.S. Department of Agriculture, Forest Service, Pacific Northwest Station. 46 p.
http://www.coloradotpa.org/wp-content/uploads/2017/02/USFS-Econ-Impacts-Rec.pdf
Write To Know Consulting. 2016. Gorge Tourism Studio baseline assessment. http://industry.traveloregon.com/content/uploads/2015/08/Columbia-
Gorge-Baseline-Assessment-Jan-2016-final.pdf
(SOME) ADDITIONAL AGENCY PARTNERS AND PROGRAMS WITH RELEVANT INFORMATION
Columbia Gorge Tourism Alliance
Columbia River Intertribal Fish Commission
Firewise Communities
Interagency Recreation Team
Local Soil and Water Conservation Districts, Watershed Councils landowner resources and best management practices, restoration planning
Lower Columbia Estuary Partnership
Mid-Columbia Economic Development District
One Gorge
Oregon’s Compass online data tools, including Conservation Opportunity Areas
Pacific Northwest Aquatic Monitoring Partnership (PNAMP)
Tahoe Regional Planning Authority
United States Geologic Survey
Washington’s Priority Habitats System and Stream Net online mapping tools
21 | P a g eYou can also read