Community Supervision Program - Court Services and Offender Supervision Agency - Congressional Budget Justification
←
→
Page content transcription
If your browser does not render page correctly, please read the page content below
Court Services and Offender Supervision
                Agency

   Community Supervision
        Program

     Congressional Budget Justification
             Fiscal Year 2023
                March 28, 2022

                                          1
Table of Contents
AGENCY OVERVIEW: ................................................................................................................................ 3
FY 2023: CSP BUDGET REQUEST .......................................................................................................... 10
FY 2022 AND FY 2023 REQUESTED PROGRAM INCREASES: ...................................................11
FY 2022 AND FY 2023 CHANGES TO BASE: .............................................................................22
CSP PROGRAM EFFECTIVENESS ......................................................................................................... 23
RECIDIVISM ...............................................................................................................................24
SUCCESSFUL COMPLETION OF SUPERVISION ...........................................................................30
PERFORMANCE INDICATORS: ............................................................................................................. 31
REARREST..................................................................................................................................31
TECHNICAL VIOLATIONS ..........................................................................................................32
DRUG USE ..................................................................................................................................34
EMPLOYMENT ...........................................................................................................................36
EDUCATION ...............................................................................................................................37
HOUSING ....................................................................................................................................37
ORGANIZATIONAL STRUCTURE ......................................................................................................... 39
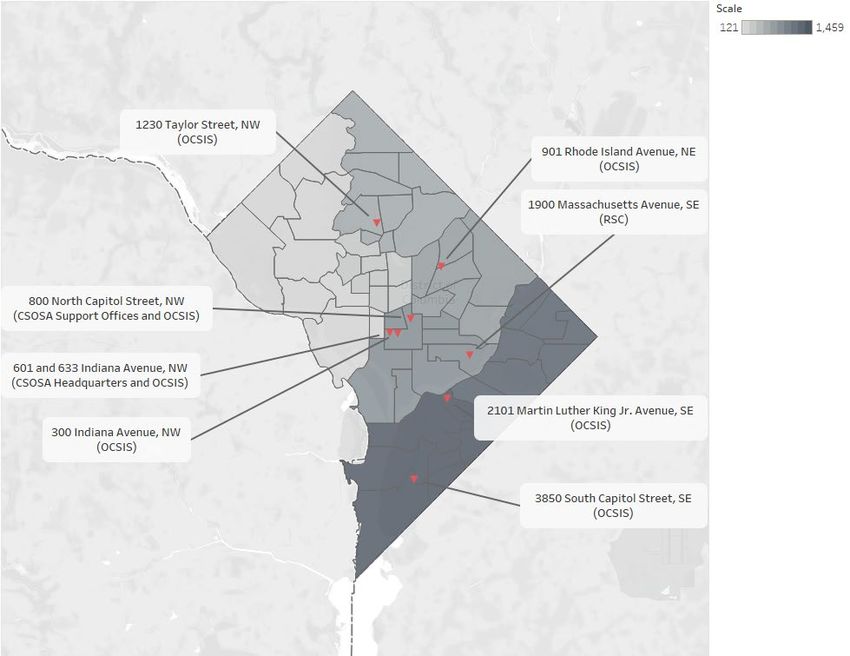
FIELD UNIT LOCATIONS ........................................................................................................................ 41
RESOURCE REQUIREMENTS BY STRATEGIC GOAL..................................................................... 43
STRATEGIC GOAL 1: REDUCE RECIDIVISM BY TARGETING CRIMINOGENIC RISK AND
NEEDS USING INNOVATIVE AND EVIDENCE-BASED STRATEGIES.......................................... 45
STRATEGIC GOAL 2: INTEGRATE OFFENDERS INTO THE COMMUNITY BY
CONNECTING THEM WITH RESOURCES AND INTERVENTIONS .............................................. 50
STRATEGIC GOAL 3: STRENGTHEN AND PROMOTE ACCOUNTABILITY BY ENSURING
OFFENDER COMPLIANCE AND CULTIVATING A CULTURE OF CONTINUOUS
MEASUREMENT AND IMPROVEMENT .............................................................................................. 52
STRATEGIC GOAL 4: SUPPORT THE FAIR ADMINISTRATION OF JUSTIC BY PROVIDING
TIMELY AND ACCURATE INFORMATION TO CRIMINAL JUSTICE DECISION-MAKERS .. 62
BUDGET DISPLAYS:.................................................................................................................................. 68
2COURT SERVICES AND OFFENDER SUPERVISION AGENCY
FOR THE DISTRICT OF COLUMBIA
Fiscal Year 2023 Budget Request
Community Supervision Program
Agency Overview:
The Court Services and Offender Supervision Agency’s (CSOSA’s) Community Supervision
Program (CSP) supervises adults released by the Superior Court of the District of Columbia on
probation, those released by the U.S. Parole Commission on parole or supervised release, as well
as a smaller number of individuals subject to Deferred Sentencing Agreements (DSA) or Civil
Protection Orders (CPOs). The CSP strategy emphasizes public safety, successful re-entry into the
community, and effective supervision through an integrated system of comprehensive risk and
needs assessments, close supervision, drug testing, treatment and support services, and incentives
and sanctions. CSP also develops and provides the Court and the U.S. Parole Commission with
critical and timely information for sentencing determinations, supervision conditions, and offender
compliance.
The criminal justice system in the nation’s capital is complex, with public safety responsibility
spread over both local and federal government agencies. CSP works closely with law enforcement
entities, such as the D.C. Metropolitan Police Department (MPD), the Superior Court of the
District of Columbia, and D.C. Department of Corrections, as well as the Federal Bureau of
Prisons (BOP), the U.S. Parole Commission, the U.S. Attorney’s Office, the U.S. Marshals Service
and the D.C. Pretrial Services Agency (PSA) to increase public safety for everyone who lives,
visits, or works in the District of Columbia. CSP also relies upon partnerships with the District of
Columbia government, local faith-based, and non-profit organizations to provide critical social
services to the offender population.
CSP plays a critical role in the District’s law enforcement and public safety arena by offering state-
of-the-art supervision programs. When CSP is successful in decreasing recidivism and improving
the rate of successful completion of supervision, these achievements result in reduced resource
demands for the D.C. Government, the U.S. Parole Commission, and the Federal BOP, and
improved public safety in the District of Columbia.
Supervised Offender Summary
In FY 2021, CSP monitored or supervised approximately 6,700 adults on any given day and 9,549
different persons over the course of the fiscal year. Approximately 88 percent of supervisees
during the year were male, and 12 percent were female. During FY 2021, 2,238 persons entered
CSOSA supervision: 1,561 individuals were ordered to CSOSA supervision by the Superior Court
of the District of Columbia (this number includes offenders sentenced to probation and individuals
with CPOs and DSAs) and 677 offenders released from incarceration in a Federal BOP facility on
3parole or supervised release. Parolees serve a portion of their sentence in prison before they are
eligible for parole at the discretion of the U.S. Parole Commission, while supervised releasees
serve a minimum of 85 percent of their sentence in prison and the balance under CSP supervision
in the community.
Individuals ordered to CSOSA supervision are typically expected to remain under supervision for
the following durations: 1
Probation: 25 to 26 months;
Parole: 12 to 20 years;
Supervised Release: 42 to 44 months;
DSA: 12 to 14 months; and
CPO: 14 to 17 months
Daily Supervised Population:
On September 30, 2021, CSP supervised 6,076 individuals, including 3,332 probationers, 2,538
offenders on supervised release or parole, 114 defendants with DSAs, and 92 individuals with
CPOs. Approximately 5,000 of those under supervision reside in the District of Columbia,
representing about 1 in every 110 adult residents of the District. 2 The remaining supervised
offenders, defendants, or individuals reside in another jurisdiction, and their cases are monitored
by CSP per the Interstate Compact Agreement (ICA).
CSP Supervised Offenders by Supervision Type, as of September 30th FYs 2019–2021
September 2019 September 2020 September 2021
Supervision Type N % N % N %
Probation 5,591 62.8% 4,240 57.9% 3,332 54.8%
Parole 884 9.9% 835 11.4% 729 12.0%
Supervised Release 2,098 23.6% 2,007 27.4% 1,809 29.8%
DSA 182 2.0% 143 2.0% 114 1.9%
CPO 145 1.6% 96 1.3% 92 1.5%
Total 8,900 100.0% 7,321 100.0% 6,076 100.0%
Offender Intakes:
The COVID-19 pandemic continued to impact CSP’s supervised population levels in FY 2021.
CSP experienced a significant reduction in the number of probationers supervised in FYs 2020 and
1 Values represent the 95% confidence interval around the average length of sentence for the CSP’s FY 2020 Total Supervised
Population. Life sentences have been excluded and, where applicable, extensions to the original sentence
are taken into consideration in the calculation.
2 U.S. Census Bureau, 2021 Population Estimates, District of Columbia Adults 18 and Over (548,101). Estimated population data as
of July 1, 2021.
42021 primarily due to the Superior Court of the District of Columbia limiting its operations due to
the pandemic. As a result, the number of probationers entering CSP supervision in FY 2021
dropped by 30 percent versus FY 2020. CSP expects a considerable increase in probation intakes
to take place upon resumption of Court activities. Conversely, the total number of parolees
supervised by CSP decreased in FY 2021 but at a much lower rate than the total supervised
population due to an increase in parolees provided early-release from BOP facilities due to the
COVID-19 pandemic.
Offender Entries by Supervision Type, FYs 2019–2021
Percentage Change
Supervision Type FY 2019 FY 2020 FY 2021 FY2020 to FY2021
Probation 3,880 1,995 1,403 -29.7%
Parole 209 224 116 -48.2%
Supervised Release 988 819 561 -31.5%
DSA 185 86 103 19.8%
CPO 110 45 55 22.2%
Total Offender Entries 5,372 3,169 2,238 -29.4%
Total Supervised Offender Population:
CSP’s Total Supervised Population (TSP) includes all offenders with Probation, Parole, and
Supervised Release sentences, and individuals with DSAs or CPOs that are assigned to a
Community Supervison Officer (CSO) and supervised for at least one day within the 12-month
reporting period.
In FY 2021 (October 1, 2020 through September 30, 2021), CSP supervised 9,549 unique
individuals. As shown in the table below, probationers make up the majority of CSP’s TSP,
accounting for nearly two-thirds of the population; nearly one-fourth of the population are on
supervised release, and just over nine percent are on parole. DSAs and CPOs make up
approximately two percent of the population each.
Data also show that CSP’s TSP has been decreasing for the past several years. The COVID-19
pandemic temporarily exacerbated this reduction with the FY 2021 TSP declining by 36 percent
below the FY 2019 TSP. The number of FY 2021 probationers decreased by approximately 42
percent, supervised releasees by 23 percent and parolees by 15 percent below FY 2019 TSP levels.
While the two-year percentage decrease of DSA and CPOs is fairly high (35 and 52 percent,
respectively), as noted above, they account for a very small portion of the total supervised
population.
5Total Supervised Population (TSP) by Supervision Type FYs 2019–2021
FY 2019 FY 2020 FY 2021
Supervision Type N % N % N %
Probation 9,754 65.8% 7,558 63.9% 5,676 59.4%
Parole 1,173 7.9% 1,093 9.2% 995 10.4%
Supervised Release 3,236 21.8% 2,743 23.2% 2,496 26.1%
DSA 361 2.4% 261 2.2% 235 2.5%
CPO 306 2.1% 182 1.5% 147 1.5%
TOTAL 14,830 100.0% 11,837 100.0% 9,549 100.0%
Offender Risk and Needs:
The total number of individuals supervised by CSP decreased in FY 2021. However,
limited revocation activities by the releasing authorities due to the pandemic resulted in non-
compliant offenders remaining under CSP supervision for longer time periods. This is a
contributing factor to an increase in the assessed risk level of CSP’s supervised population in FY
2021. Based on the results of CSP’s proprietary offender risk and needs screening tool, the Auto
Screener, approximately 55 percent of the FY 2021 end-of-year assessed supervised population
was supervised by CSP at the highest risk levels. This represents an increase from the end of FY
2019 when 48 percent of the assessed supervision population was supervised at the highest risk
levels. Highest-risk individuals require additional supervision and intervention resources to ensure
public safety.
CSP data shows that the criminogenic and support services needs of the supervised population are
substantial, and addressing those needs is essential to reducing recidivism. The 2,238 individuals
entering CSP supervision during FY 2021 were characterized by the following:
• 39.9 percent were identified as having anti-social attitudes and temperament; 3
• 25.2 percent were identified as having an immediate substance abuse need while 82.0
percent self-reported having a history using illicit substances;³
• 26.2 percent lacked prosocial leisure activities;³
• 68.5 percent were unemployed when they began supervision; 4
• 27.1 percent were identified as having mental health needs;³
• 63.4 percent self-reported having children; 32.7 percent of those with dependent-age
children reported being the primary caretaker of those children;³
3 Based on offender entrants for whom a comprehensive assessment was completed. Data reflect assessments completed closest
to when the offender began supervision.
4 Based on offenders deemed “employable” according to job verifications completed closest to when they began supervision.
Offenders are “employable” if they are not retired, disabled, suffering from a debilitating medical condition, receiving SSI,
participating in a residential treatment program, participating in a residential sanctions program (i.e., incarcerated), or participating in
a school or training program. Employability is unknown for offenders who have not had a job verification conducted.
6• 33.1 percent reported having less than a high school diploma or GED; and
• 7.5 percent reported at intake that their living arrangement was unstable. 5
Further, many of our supervisees, particularly those who have served long periods of incarceration,
do not have supportive family relationships. Recent economic hardship caused by COVID-19 has
only increased the difficulties these individuals face in obtaining employment and housing.
Offender Outcomes:
To monitor how well the Agency is achieving its mission, CSP established one outcome indicator
and one outcome-oriented performance goal related to public safety:
1. Decreasing recidivism among the supervised offender population, and
2. Successful completion of supervision.
In considering these outcomes, CSP recognizes the well-established connection among
criminogenic needs, behavioral health (both substance abuse and mental health challenges) and
crime. Long-term success in reducing recidivism depends upon two key factors:
1. Identifying and treating criminogenic needs, as well as addressing behavioral health issues
and other social problems among the offender population; and
2. Establishing swift and certain consequences for violations of supervision conditions.
CSP recognizes that recidivism places an enormous burden on the offender’s family, the
community, and the entire criminal justice system. We monitor revocation rates and other related
factors, as well as monitor and adjust (as needed) our interventions to meet offender needs. It is
not unusual for offenders to return to CSP supervision. Of the 2,238 individuals who entered
supervision in FY 2021, 18.9 percent had been under CSP supervision at some point in the 36
months prior to their supervision start date.
CSP research has shown that, compared to the total supervised population, offenders who are
eventually revoked to incarceration are more likely to test positive for drugs, have unstable
housing, lack employment, and/or be assessed by CSP at the highest risk levels. As such, CSP is
continuing to realign existing supervision and offender support services to provide focused
interventions and appropriate supervision for our offender population in an attempt to reduce
recidivism and increase successful completion of supervision.
5 Based on home verifications completed closest to when each offender began supervision. Offenders are considered to have
“unstable housing” if they reside in a homeless shelter, halfway house through a public law placement, transitional housing,
hotel or motel, or have no fixed address. Programs funded by the U.S. Department of Housing and Urban Development (HUD)
use a more comprehensive definition of homelessness and housing instability to include, for example, persons living with
friends or family members on a temporary basis and persons in imminent danger of losing their current housing. CSP does
not routinely track a number of factors considered in HUD’s definition. Therefore, reported figures may underestimate the
percentage of offenders living in unstable conditions.
7Offender Arrests for Incidents of Serious, Violent Crime:
The District of Columbia experienced an increase in homicides in 2021, as well as an increase in
robberies and the total number of firearms recovered , compared to 2020. 6 On average, 30 percent
of incidents of serious violence since 2012 have been closed with an arrest, and approximately 1 in
5 of these arrestees were under CSOSA supervision. Half of all homicides have been closed with
an arrest and approximately 1 in 3 arrestees were under CSOSA supervision at the time of the
incident. While CSOSA-supervised persons are more likely to be arrested for homicide than a
typical DC resident, it is important to note that most persons under supervision are not involved in
these types of crimes.
Despite the increase in homicides and certain other crimes, the overall number of incidents of
serious violence 7 in the District of Columbia is considerably lower than it was a decade ago. In
2012, the average number of serious incidents per day in the District was 19; by 2021, the average
declined to 11, marking the lowest daily rate in the past decade. Importantly, the percentage of
CSP offenders arrested for serious violent incidents while under supervision remains fairly low.
Of the 9,368 unique offenders supervised by CSP during calendar year 2021, 2.4 percent were
arrested for serious violence and less than 0.25 percent were arrested for homicide; this is similar
to the percentage of CSP’s TSP arrested for incidents of serious, violent crime in 2012.
Despite the low number of CSP offenders arrested for an incident of serious violence in District,
the increase in homicides, firearm recoveries and robberies is of concern to the Agency. As
previously noted, CSP offenders account for approximately 1 in 5 of those arrested for serious
violence. These offenders are more likely to be assessed and supervised at the highest risk levels.
CSP is actively addressing this critical public safety issue by focusing our resources on our
highest-risk offenders with the intent of further reducing all types of serious violence within the
District and the participation of CSP offenders in those crimes. To that end, CSP is improving our
offender risk and needs assessments and interventions. CSP created High Intensity Supervision
Teams (HISTs) and implemented the Rapid Engagement Team (RET) and Compliance Monitoring
and Intelligence Center initiatives to immediately address non-compliant activities and share data
on high-risk offenders. CSP partners with D.C. MPD to perform night/weekend supervision
activities in high-crime areas. CSOSA is also collaborating with the U.S. Marshals Service and
other federal and local law enforcement agencies to locate offenders with outstanding arrest
warrants.
6 Source: MPD District Crime Data at a Glance, https://mpdc.dc.gov/page/district-crime-data-glance
7 Serious, violent incidents include homicide, aggravated assault, sexual assault, assault with a dangerous weapon, assault with intent
to kill, carjacking, and robbery. Incidents counted are those that occurred during the year, even if the arrest was not made until after
the end of the year.
8CSP FY 2021 Total Supervised Population Profile:
FY 2021 TOTAL
FY 2021 ENTRIES SUPERVISED FY 2021 EXITS
POPULATION
Total: 2,238 Total: 9,549 Total: 4,680
116 Parole Supervised 9,549 unique 393 Parole
561 Supervised Release individuals over the course of the 966 Supervised Release
1,403 Probation fiscal year and approximately 6,700 3,101 Probation
103 DSA persons on any given day 138 DSA
55 CPO 82 CPO
Characteristics at intake Characteristics under supervision Supervision outcomes
• 19 percent had previously • Approximately 53 percent of • 75 percent of cases closed
been under CSOSA individuals assessed and successfully
supervision at some point supervised by CSP at the • 95 percent of individuals
within the last three years highest risk levels¹ under supervision in FY
• 40 percent were identified • 14 percent aged 25 and under 2021 were not revoked to
as having anti-social • 12 percent female incarceration
attitudes and temperament² • 19 percent of individuals were
• 25 percent were identified rearrested while under
as having an immediate supervision
substance use need and 82 • 2 percent of supervisees were
percent self-reported having rearrested for incidents of
a history of using illicit serious, violent crime in the
substances² District of Columbia3
• 26 percent lacked prosocial • 35 percent of the drug tested
leisure activities population4 tested positive for
• 69 percent were illicit substances (excluding
unemployed alcohol)
• 33 percent had less than a • Community Supervision
high school education Officers (CSOs) issued
• 8 percent resided in unstable Alleged Violation Reports to
conditions4 the releasing authority for 25
• 27 percent were identified percent of supervised
as having mental health individuals
needs²
• 63 percent self-reported
having children; 33 percent
of those with dependent-age
children reported being the
primary caretaker of those
children²
¹ CSOSA assesses the risk to public safety posed by offenders during supervision at intake and throughout the term of supervision using various
assessment tools. Risk assessments are not required for misdemeanants residing outside of D.C. who are supervised primarily by mail, or for
offenders who are in monitored or warrant status.
² Reported estimates are based on offender entrants for whom an assessment was completed. Data reflect assessments completed closest to when the
offender began supervision.
³ Serious, violent incidents include homicide, aggravated assault, sexual assault, assault with a dangerous weapon, assault with intent to kill,
carjacking and robbery. Arrests during the year are counted even if the predicate offense occurred during a prior year
4
Includes all offenders in active status during a reporting month who were supervised at the medium, maximum or intensive level.
9FY 2023: CSP Budget Request
The FY 2023 Budget Request for CSP is $204,579,000, an increase of $25,399,000 or 14.18
percent above the FY 2022 annualized FY 2022 Continuing Resolution.
Court Services and Offender Supervision Agency
Community Supervision Program
Total
Annual Three-Year Appropriation
Amount Amount Amount
FTE $(000) $(000) $(000)
FY 2020 Enacted Budget 795 177,247 3,818 181,065
FY 2021 Enacted Budget 750 179,180 - 179,180
FY 2022 Continuing Resolution (CR)1 750 179,180 - 179,180
Changes to Base:
FY 2022
FY 2022 Pay Raise - 3,373 - 3,373
FY 2022 Employee Retirement Benefit Cost Increase - 1,168 - 1,168
2
FY 2022 Base Employment Increase 25 - - -
FY 2023
FY 2023 Pay Raise - 5,522 - 5,522
Sub-Total, Changes to Base 25 10,063 - 10,063
FY 2023 BASE 775 189,243 - 189,243
Requested Program Changes:
FY 2022 Annual Funding 2022
3
FY 2022 Offender Treatment and Housing Interventions 5 7,538 - 7,538
FY 2022 Three-Year Funding 2022/2024
4
FY 2022 Re-entry and Sanctions Center Lease Replacement - Technical Anomaly - - 6,639 6,639
5
FY 2022 Non-Recurring Resources in FY 2023 - - (6,639) (6,639)
6
FY 2022 800 North Capitol Street, NW, Lease Replacement - Technical Anomaly - - 8,108 8,108
7
FY 2022 Non-Recurring Resources in FY 2023 - - (8,108) (8,108)
FY 2023 Three-Year Funding 2023/2025
8
CSP 3850 South Capitol Street, SE, Field Unit Replacement 2,567 2,567
9
CSOSA Re-entry and Sanctions Center Lease Replacement 1,414 1,414
10
CSP 800 North Capitol Street, NW, Lease Replacement - - 3,817 3,817
Sub-Total, Requested Program Changes 5 7,538 7,798 15,336
FY 2023 President's Budget 780 196,781 7,798 204,579
Increase (Decrease) versus FY 2022 CR: 30 17,601 7,798 25,399
Percent Increase (Decrease) versus FY 2022 CR: 4.00% 9.82% NA 14.18%
1
A full-year 2022 appropriation for this account was not enacted at the time the budget was prepared; therefore, the budget assumes this account is operating under the 2022
Extending Government Funding and Delivering Emergency Assistance Act (P.L. 117-43), as amended). The FY 2022 PB includes one-time, multi-year relocation funds outlined in
Footnotes 4 and 6.
2
CSP's FY 2022 PB includes planned increases in FTE due to increased staff hiring of Base positions funded in FY 2022 by offsetting reductions in Base non-personnel resources
3
Program increase for funding requested in FY 2022 President's Budget (PB) for the CSP Offender Treatment and Housing Interventions.
4
Program increase for three-year FY 2022/2024 funding requested in FY 2022 PB for the CSOSA Re-entry and Sanctions Center lease replacement.
5
Reduction of $6,639,000 in non-recurring three-year FY 2022/2024 funding associated with the CSOSA Re-entry and Sanctions Center lease replacement. The need for these
resources does not recur in FY 2023.
6
Program increase for three-year FY 2022/2024 funding requested in FY 2022 PB for the CSP 800 North Capitol Street, NW, lease replacement.
7
Reduction of $8,108,000 in non-recurring three-year FY 2022/2024 funding associated with the CSP 800 North Capitol Street, NW, lease replacement. The need for these
resources does not recur in FY 2023.
8
Three-year FY 2023/2025 funding is requested to fund the costs associated with the CSP 3850 South Capitol Street, SE, lease replacement.
9
Three-year FY 2023/2025 funding is requested to fund the remainder of costs associated with the CSOSA Re-Entry and Sanctions Center lease replacement.
10
Three-year FY 2023/2025 funding is requested to fund the remainder of costs associated with the CSP 800 North Capitol Street, NW, lease replacement.
10FY 2022 and FY 2023 Requested Program Increases:
1. CSOSA Re-entry and Sanctions Center Relocation +$1,414,000 0 FTE
CSP requests $1,414,000 in Three-Year (FY 2023-2025) funding to support the second phase of
space acquisition costs for the expiring lease at Karrick Hall (1900 Massachusetts Avenue, SE,
Washington, DC). CSOSA operates our Re-entry and Sanctions Center (RSC) at the Karrick Hall
location. CSP’s delegated lease for the RSC at Karrick Hall expires on September 30, 2024.
CSP’s FY 2023 request supplements $6,639,000 in Three-Year (FY 2022-2024) funding contained
in the FY 2022 PB to relocate the RSC. The FY 2022 PB RSC relocation resources do not recur in
FY 2023.
Current Lease
CSP Lease
Occupants
Non-GSA Leased Space: Expiration
1900 Massachusetts Avenue, SE 09/30/2024 CSP
Background
The RSC at Karrick Hall provides intensive assessment and reintegration programming for CSP
offenders and PSA defendants. RSC participants have significant behavioral health and/or
substance use disorder issues that require immediate residential services. CSP began operations of
the RSC at Karrick Hall in February 2006 supported by No-Year appropriated funding to
completely renovate the facility and recurring, annual appropriated funding supporting program
operations 8.
CSP leases Karrick Hall from the DC Government under a delegated, non-GSA lease that expires
September 30, 2024. CSP prefers to continue occupancy of the current location. However, the DC
Government’s stated desire to re-develop the Karrick Hall property requires CSP to work with
GSA on a plan to replace this 24/7 residential facility with similar-sized space in the District of
Columbia. GSA has not formally stated whether it will procure replacement space on behalf of
CSP or delegate this procurement to CSP.
CSP requires funds in FY 2022 and FY 2023 to support a relocation to occur in 2023-2024. This
funding request is made in accordance with 40 U.S.C. § 585(a), 40 U.S.C. § 3307(a)(1) and (2) and
(h), and applicable GSA procedures and regulations. Continued real estate development of the
District created challenges for CSP in obtaining space for offender supervision field site
operations. Finding space for a 24/7 residential facility will prove even more difficult. Due to
these challenges, it is necessary to have the first installment of appropriated funding in place in FY
8 P.L. 107-96 (December 21, 2001): $13,015,000 in No-Year funding appropriated to CSOSA/CSP for renovation/construction of
the RSC at Karrick Hall.
112022 to provide ample time for the solicitation of new space to support this critical public safety
program.
The RSC at Karrick Hall serves as the sole 24/7 residential facility operated by CSOSA to support
the highest-risk, highest-need CSP offender and PSA defendant supervision population. Many of
the offenders and defendants supported in this facility are not eligible for placement into our
contract residential programs nor are there services offered by the DC Government to meet their
needs in a timely manner.
RSC participants receive holistic and multi-disciplinary interventions. Comprehensive assessment
(physical/psychological), treatment readiness, aggression reduction, reintegration programming,
and motivation are the focus of the interventions offered at the RSC. These interventions are
structured to address one or more factors that challenge the residents’ successful reentry into the
community. The treatment and cognitive behavioral health services provided to residents at the
RSC are designed to provide the tools necessary to prevent relapse, succeed in a treatment
modality, adhere to supervision requirements, improve familial relationships, initiate productive
community reintegration, and reduce recidivism.
Prior to COVID-19, approximately 75 CSP staff at the RSC performed 24/7 operation of five (5)
separate units supporting: a) PSA defendants, b) offender sanctions, c) female-specific
programming, and d) two (2) units for offenders with co-occurring disorders (suffering from both
mental health and substance abuse issues). In addition, specialized contractors provide medical,
psychiatric and other mental health services. The maximum capacity of Karrick Hall is 83
residents. The program duration is 28-42 concurrent days depending upon the assessed needs of
the offender or defendant. In FY 2019, an Extended Stay unit was deployed with a duration of 42
concurrent days to provide more intensive, longer-term support to highest-risk defendants and
offenders.
Most CSP offenders and PSA defendants are referred to the RSC program through internal Agency
assessment and placement mechanisms versus a public order placement. The treatment model
calls for participating offenders to remain at the RSC facility for the duration of their program,
only leaving the facility for medical appointments or other required departures. Because of the
intensive nature of the program, participating offenders may drop out (or, walk-away) from the
program prior to completion. CSP’s RET immediately engages CSP offenders who leave the RSC
prior to program completion to encourage the offender to return to the program. “Walk-aways”
result in CSP sanctions and possible issuance of an Alleged Violation Report (AVR) to the
releasing authority.
In December 2019, CSP conducted a tour of the RSC for Superior Court for the District of
Columbia judges to educate them of the updated RSC program, and to encourage additional
placement of offenders at the RSC subject to court order. As a result, CSP experienced an increase
in court-ordered referrals to the RSC in early 2020 prior to the temporary closure of the RSC in
March 2020 due to COVID-19. Upon the planned re-opening of the RSC in FY 2022, and
increased operations at the Superior Court for the District of Columbia, CSP anticipates
continuation of the increase in judicial placements and a resulting decrease in applicable offenders
dropping out of the program.
12During the first six months of FY 2020, a total of 417 high-risk offenders/defendants were
admitted to the RSC and 410 were discharged. Total discharged offenders/defendants excludes 39
cases where a offender could not remain at the RSC due to medical reasons, cognitive deficiences,
or because his/her supervision period ended. Of the 410 discharged offenders/defendants, 285
(69.5 percent) successfully completed the program. In mid-March 2020, the RSC suspended
operations due to the COVID-19 pandemic. Offenders who were discharged in March 2020 but
had been actively engaging in the program at the time were considered ‘successful.’ The majority
of unsuccessful completions in FY 2020 were due to offenders dropping out of the program.
Justification of Request:
CSP requests FY 2023 Three-Year resources to support the full space acquisition costs for 50,000
USF for relocation of CSOSA’s RSC at Karrick Hall. CSP will continue to work with GSA to
determine responsibility for procurement of the replacement space and the need for a Prospectus to
support this relocation.
Building Lease Usable Square Square Percentage
Location Expiration Footage Footage Change
Change
CSP CSP
Current Requested
1900
Massachussetts 9/30/2024 50,000
Avenue, SE
Requested 50,000
Replacement
Space
Total 50,000 50,000 0 0%
CSP is working with GSA to explore options for relocating the RSC, to include moving to existing
residential facility space within the District of Columbia and/or co-locating with our public safety
or contractor partners. Given financial, time, and DC real estate constraints, new construction or
complete renovation of an existing facility to serve solely as the RSC does not seem practical.
CSP is re-shaping the RSC program to meet the evolving needs of our offender and defendant
population. CSP is adjusting RSC services for certain units to address pro-social behavior and
criminal thinking needs with cognitive interventions. To that end, CSP anticipates that the new
facility will have a reduced capacity of approximately 75 offenders and that the duration of the
program will vary from 28-42 to 45-60 consecutive days depending upon the unit. Despite the
planned reduction in offender capacity, CSP anticipates that the amount of space needed to operate
the RSC will remain unchanged due to our intention to provide space for support programming
provided by DC Government and other services providers.
13CSP opened a Day Reporting Center (DRC) at the RSC in FY 2022. Finally, CSP will continue to
work with the Court and releasing authority to explore increasing the number of public order
placements to the RSC to increase ramifications for walk-aways.
CSP anticipates that currrent Base staffing and operations funding will support continued
operations at the new facility. However, CSP may require increased funding in FY 2024 if rent at
the new location significantly exceeds current levels.
CSP must request resources to relocate the RSC at Karrick Hall due to the imminent expiration of
the lease at this location. This request cannot be postponed to future fiscal years without
significant risk of not having this critical residential support program in place beyond September
2024. Without this program, these offenders and defendants could literally have no other place at
which to receive necessary support services, to the detriment of their successful return to the
community.
Budget Estimate:
CSP’s relocation cost estimate is derived from GSA’s Move and Replication Cost Estimate format
and represents an investment in space management through the execution of a long–term
replacement lease at existing residential facility space within the District of Columbia. CSP
anticipates that renovations/construction will be necessary to adapt procured space to the
residential programing and security needs of the RSC. CSP will attempt to re-use existing
furniture, equipment and fixtures to the extent possible. However, many of these items are 15+
years old and may require replacement.
Justification for Program Increase
1900 Massachusetts Avenue, SE, Relocation (50,000 USF – 75 Staff)
Program Area FY 2022 PB FY 2023 PB
Real Property Costs
Construction ($125.00/USF) $6,250,000 $0
Design ($9.11/USF) $611,000 $0
Management and Inspection Cost
$433,000 $0
($8.66/USF)
Building Specific Amortized Capital
$1,250,000 $0
Costs ($25.00/USF)
Standard Contingency built-in by GSA $0 $0
GSA Management Fee (4%) $199,000 $0
Slide Scale Overhead Fee $30,000 $0
Less: Tenant Improvement Allowance
($2,337,000) $0
Amortized in Monthly Rent Payments
Less: Building Specific Amortized
($1,250,000) $0
Capital Costs
Total Real Property Costs $5,186,000 $0
14Personal Property Costs
Move $0 $174,000
IT/Communications $786,000 $0
A/V $0 $350,000
Signage, Artwork, Graphics $0 $100,000
Security $250,000 $0
Furniture: Staff and Contractors (60
$0 $327,000
Units)
Culture Change Consulting $0 $0
Furniture: Residential Component (75
$0 $263,000
Beds)
Furniture: Special Space (meeting,
$0 $200,000
medical, food handling, etc.)
IT Collaborative Spaces $157,000 $0
Standard Contingency built-in by GSA $260,000 $0
Total Personal Property Costs $1,453,00 $1,414,00
Total GSA Move and Replication
$6,639,000 $1,414,000
Estimated Costs
Project Total $8,053,000
CSP may require additional resources effective in FY 2024 to account for increased rent rates
under the new RSC space acquisition.
Three-Year Funding
Three-Year funding is requested because CSP has historically had difficulty soliciting for space
due to the requirements of our supervision operations. Three-Year funding will provide flexibility
to begin the space solicitation well in advance of the planned lease end date.
2. 800 N Capitol Street, NW, Relocation +$3,817,000 0 FTE
CSP requests $3,817,000 in Three-Year (FY 2023-2025) funding as the second of two funding
installments supporting space acquisition for expiring leases at 800 N Capitol Street, NW,
Washington, DC. CSP’s delegated lease for 800 N Capitol Street, NW, expires on June 29, 2023
and the 800 N Capitol Street, NW, backfill lease expires on October 31, 2022.
CSP’s FY 2023 request supplements $8,108,000 in Three-Year (FY 2022-2024) funding contained
in the FY 2022 PB to relocate 800 North Capitol Street, NW, and related facilities (to include
Headquarters locations). The FY 2022 PB 800 North Capitol Street, NW, and related facilities
resources do not recur in FY 2023.
15Prospectus PDC-01-WA21 (supported by a Move and Replication Cost Estimate dated April 2020)
currently totals 79,274 Usable Square Feet (USF) and 96,000 Rentable Square Feet (RSF).
Current Leases Pending Expiration:
CSP Lease
Occupants
GSA Leased Space: Expiration
800 N Capitol Street, NW 06/29/2023 CSP
800 N Capitol Street, NW, Backfill CSP
10/31/2022
Lease
CSP’s request for FY 2022 and FY 2023 resources to relocate 800 North Capitol Street, NW, is
directly related to CSOSA’s on-going Headquarters Relocation project. CSOSA’s Headquarters
Relocation includes the current CSP locations of 601 and 633 Indiana Avenue, NW. CSOSA
received a total of $7,486,000 in Three-Year funding in FYs 2019 ($5,919,000) and 2020
($1,567,000) for costs associated with relocation under a replacement lease for headquarters
offices, field offices and related facilities.
CSP worked with GSA to solicit for replacement space for our 601 and 633 Indiana Avenue, NW,
Headquarters locations. However, delays associated with this project will likely result in the
enacted FY 2019 and FY 2020 multi-year budget resources expiring, unused, without obtaining a
new Headquarters lease. Therefore, FY 2022 and FY 2023 resources supporting CSP’s 800 North
Capitol Street, NW, relocation may be needed, all or in part, to relocate 800 North Capitol Street,
NW, and 601/633 Indiana Avenue, NW.
Background
CSP initially occupied space at 800 North Capitol Street, NW, in 2013 under a 10-year GSA lease
that expires June 29, 2023. CSP acquired additional space in 2017 through the backfill of a GSA
lease that expires October 31, 2022. CSP operations at 800 North Capitol Street are primarily
administrative. While offenders do not report to 800 North Capitol Street, CSP does perform
indirect offender supervision functions, such as offender investigations, at this location.
Justification of Request:
CSP requests FY 2023 Three-Year resources to support GSA’s solicitation for 79,274 USF for
relocation of CSP’s 800 North Capitol Street, NW, location and related facilities.
Budget Estimate:
CSP’s relocation cost estimate is derived from GSA’s Move and Replication Cost Estimate format
and represents an investment in space management through the execution of a long–term
replacement lease. CSP will attempt to re-use existing furniture, equipment and fixtures to the
extent possible.
16Building Lease Usable Square Footage Square Percentage
Location Expiration Footage Change
Change
CSP Current CSP
Requested
800 N Capitol Street,
6/29/2023 62,987
NW
800 N Capitol Street, 16,287
10/31/2022
NW, backfill lease
Requested 79,274
Replacement Space
Sub-Total, 800 N 79,274 79,274 0 0.00%
Capitol Street
Justification for Program Increase
800 N Capitol Street, NW, Relocation (79,274 USF – 401 Staff)
Program Area FY 2022 PB FY 2023 PB
Real Property Costs
Construction ($76.55/USF) $6,069,000 $0
Design ($7.96/USF) $631,000 $0
Management and Inspection Cost
$518,000 $0
($6.54/USF)
Building Specific Amortized Capital
$1,982,000 $0
Costs ($25.00/USF
Lessor Profit & Overhead ($11.61/USF) $920,000 $0
Standard Contingency built-in by GSA
$920,000 $0
($11.61/USF)
GSA Management Fee (4%) $226,000 $0
Slide Scale Overhead Fee $30,000 $0
Less: Tenant Improvement Allowance
Amortized in Monthly Rent Payments ($3,397,000) $0
($42.85/USF)
Less: Building Specific Amortized
($1,982,000) $0
Capital Costs ($25.00/USF)
Total Real Property Costs $5,917,000 $0
Personal Property Costs
Move ($3.25/USF) $0 $258,000
IT/Communications ($15.75/USF) $1,249,000 $0
17A/V ($7.00/USF) $0 $555,000
Signage, Artwork, Graphics ($2.00/USF) $0 $159,000
Security ($5.00/USF) $396,000 $0
Furniture: Staff and Contractors (401
$0 $2,279,000
Units * $5,683.61 each)
IT Mobility Upgrades (50 Units * $5,500
$0 $276,000
each)
IT Collaborative Spaces (50 Units *
$0 $290,000
$5,800 each)
Standard Contingency built-in by GSA $546,000 $0
Total Personal Property Costs $2,191,000 $3,817,000
Total GSA Move and Replication Costs $8,108,000 $3,817,000
Project Total $11,925,000
Three-Year Funding
Three-Year funding is requested because CSP has historically had difficulty soliciting for space
due to the requirements of our operations. Three-Year funding will provide flexibility to begin the
space solicitation well in advance of the planned lease end date.
3. 3850 S Capitol Street, SE Relocation +$2,567,000 0 FTE
CSP requests $2,566,647 in Three-Year (FY 2023-2025) funding to support space acquisition and
planning for an expiring lease at 3850 South Capitol Street, SE, Washington, DC. CSP’s delegated
lease for 3850 S Capitol Street, SE, expires on July 31, 2023 (FY 2023).
CSP occupies 12,857 Usable Square Feet (USF) and 14,400 Rentable Square Feet (RSF) at the
3850 South Capitol Street location.
Current Lease Pending Expiration:
CSP Lease
Occupants
Non-GSA Leased Space: Expiration
3850 S Capitol Street, SE 7/31/2023 CSP
CSP’s program model emphasizes decentralizing supervision from a single headquarters office to
the neighborhoods where offenders live and work. By doing so, CSOs maintain a more active,
visible, and accessible community presence, collaborating with neighborhood police in the various
Police Service Areas, as well as spending more of their time conducting home visits, work site
visits, and other activities that make CSOSA a visible partner in public safety. However,
continued real estate development of the District creates challenges for CSP in obtaining space for
offender supervision operations.
18Background
CSP has occupied 3850 South Capitol Street, SE, since March 1999. On January 1, 2013, CSP
signed a 10-year succeeding lease to maintain occupancy through July 31, 2023. CSP prefers to
continue occupancy of the current location. However, proper Federal space acquisition planning
and procedures requires CSP to work with GSA on a plan to replace this field unit with similar-
sized space in the SE quadrant of the District of Columbia. Continued real-estate development
within the city adds additional challenges for obtaining space to support CSOSA’s mission.
CSP requires funds in FY 2023 to support a relocation to occur upon expiration of our current
lease. This funding request is made in accordance with 40 U.S.C. § 585(a), 40 U.S.C. § 3307(a)(1)
and (2) and (h), and applicable GSA procedures and regulations.
The 3850 South Capitol Street, SE, location serves as a critical offender supervision location in the
SE quadrant of the District. There are approximately 50 CSP staff at this location comprising one
HIST, two General Supervision teams, an Illegal Substance Collection Unit and a DRC inclusive
of a Learning Lab. There is a current need to house 50 CSP staff at this location due to increasing
program assessment and intervention staff.
Prior to COVID-19, approximately 585 offenders visited this location each week for supervision
reporting. The facility operates 10.5 hours per business day and is also used for weekend supervision
activities. There are community partners in close proximity to the 3850 South Capitol Street, SE,
field unit to which CSP provides immediate referrals for critical offender support services.
CSP requests Three-Year resources to support GSA’s solicitation for 12,857 USF for relocation of
CSP’s 3850 South Capitol SE, location. Since the annual rent for this space requirement will not
exceed the net annual rent prospectus threshold imposed by 40 U.S.C. § 3307(a)(1) and (2), GSA
is not required to submit a prospectus to OMB and Congress for approval.
CSP’s relocation cost estimate is derived from previous GSA Move and Replication Cost Estimate
formats and represents an investment in space management through the execution of a long–term
replacement lease.
Budget Estimate:
CSP requests Three-Year resources to support a non-GSA solicitation for 12,857 USF for
relocation of CSP’s 3850 South Capitol Street, SE, location and related facilities.
Building Location Lease Usable Square Square Percentage
Expiration Footage Footage Change
Change
CSP CSP
Current Requested
3850 S Capitol
7/31/2023
Street, SE 12,857 12,857
Total 12,857 12,857 0 0.00%
19Justification for Program Increase
3850 S Capitol Street, SE Relocation - 12,857 USF 50 Staff
(Offender Programming/Illegal Substance Collection)
Program Area FY 2023 PB
Real Property Costs
Construction ($125.00/USF) $1,607,000
Design ($9.11/USF) $117,000
Management and Inspection Cost ($6.54/USF) $84,000
Building Specific Amortized Capital Costs ($25.00/USF) $322,000
Lessor Profit & Overhead ($11.61/USF) $149,000
Standard Contingency built-in by GSA ($11.61/USF) $149,000
GSA Management Fee (4%) $64,000
Slide Scale Overhead Fee $30,000
Less: Tenant Improvement Allowance Amortized in Monthly Rent
Payments ($42.85/USF) ($550,000)
Less: Building Specific Amortized Capital Costs ($25.00/USF) ($321,000)
Total Real Property Costs $1,651,000
Personal Property Costs
Move ($3.25/USF) $42,000
IT/Communications ($15.75/USF) $202,000
A/V ($7.00/USF) $90,000
Signage, Artwork, Graphics ($2.00/USF) $26,000
Security ($5.00/USF) $64,000
Furniture: Staff/Contractors + Offender Programming
(60 Units * $5,683.61 each) $341,000
IT Mobility Upgrades (6 Units * $5,500 each) $33,000
IT Collaborative Spaces (6 Units * $5,800 each) $35,000
Standard Contingency built-in by GSA $83,000
Total Personal Property Costs $916,000
Total Move and Replication Costs $2,567,000
Justification of Request/Limited Delineated Area
CSP requests resources to ensure continued supervision operations in the SE quadrant of
Washington, DC. CSP must request FY 2023 resources to relocate our current 3850 S Capitol
Street, SE, location due to the imminent expiration of the lease at this location. This request
cannot be postponed to future fiscal years. CSP requires complete space acquisition resources, to
include furniture and move resources, in FY 2023 to facilitate a timely relocation commensurate
with expiration of the current lease.
CSP requires new furniture for 3850 S Capitol Street, SE, as the majority of the current furniture
has not been replaced since the Agency occupied this space in 1999.
20Failure to receive FY 2023 resources to support relocation space in SE DC will require offenders
to travel to more-distant CSP locations to receive services. This would move CSP community
supervision back towards the downtown “fortress” supervision model and increase the risks
associated with centralized offender reporting for numerous DC neighborhoods.
CSP plans to reduce our total Agency space footprint as part of the forthcoming Headquarters and
800 North Capitol Street, NW, relocation projects. CSP will not have space at our other locations
to absorb 3850 South Capitol, SE, offender supervision operations.
CSP may require additional resources in FY 2024 to account for increased lease rates under a new
space acquisition.
Three-Year Funding
Three-Year funding is requested because CSP has historically had difficulty soliciting for space
due to the requirements of our supervision operations. Three-Year funding will provide flexibility
to begin the space solicitation well in advance of the planned lease end date and provide flexibility
to address project delays.
4. FY 2022 Offender Treatment and Support Interventions +$7,538,000 5 FTE
The FY 2022 PB includes $7,538,000 in additional funding for offender treatment and support
interventions. CSP data shows that the criminogenic and support services needs of supervised
offenders are substantial, and addressing those needs is essential to reducing recidivism. CSP
implements contract interventions to address these needs and stabilize individuals for successful
supervision. The FY 2022 PB offender treatment and support intervention resources recur in the
FY 2023 PB.
21FY 2022 and FY 2023 Changes to Base:
1. FY 2022 Pay Raise Increase $3,373,000 0 positions 0 FTE
The FY 2022 PB includes $3,373,000 to support FY 2022 (October 2021 – September 2022)
payroll cost increases associated with a 2022 civilian pay raise.
2. FY 2022 Employee Retirement Increase $1,168,000 0 positions 0 FTE
The FY 2022 PB includes $1,168,000 to support FY 2022 increases in agency contributions to
employee Federal Employees Retirement System (FERS) retirement accounts effective FY 2022.
3. FY 2022 Employment Increase $0 0 positions 25 FTE
CSP's FY 2022 PB includes planned increases in FTE due to increased staff hiring of vacant Base
postions funded in FY 2022 by offsetting reductions in Base non-personnel resources. Proposed
FY 2022 FTE increases are primarily in law-enforcement staff functions.
4. FY 2023 Pay Raise Increase $5,522,000 0 positions 0 FTE
The FY 2023 PB includes $5,522,000 to support a FY 2023 (October 2022 – September 2023)
payroll cost increases associated with an estimated 4.6 percent 2023 civilian pay raise.
22CSP Program Effectiveness
CSP is making a lasting contribution to the District of Columbia community by improving public
safety and enabling offenders to become productive members of society.
CSP has established one outcome indicator and one outcome-oriented performance goal
related to improving public safety:
Outcome indicator: Reducing recidivism among the supervised population
CSP currently measures recidivism through revocations to incarceration following a new
conviction and/or for violating release conditions.
Outcome-oriented performance goal: Successful completion of supervision
In FY 2012, CSP updated its definition of successful completion of supervision to align with how
releasing authorities define successful completion and to more precisely classify all offenders as
“successful,” “unsuccessful,” or “other.” The old definition of successful supervision completion
only included offenders whose supervision periods were terminated or expired without revocation
by the releasing authority. Successful completion of supervision has now been expanded to
include those offenders discharged from supervision whose supervision periods expired
satisfactorily, expired unsatisfactorily, terminated satisfactorily, or terminated unsatisfactorily, or
whose case(s) were returned to the sending jurisdiction in compliance or transferred to U.S.
Probation. Unsuccessful completion of supervision includes cases closed with a status of revoked
to incarceration, revoked unsatisfactorily, deported, returned to the sending jurisdiction out of
compliance, or pending U.S. Parole Commission institutional hearing. Cases that closed for
administrative reasons or death are now classified as Other, neither successful or unsuccessful.
CSP has established six other indicators related to offender compliance on supervision and
reintegration:
1) Rearrest,
2) Technical violations,
3) Drug use,
4) Employment/job retention,
5) Education, and
6) Housing
We believe that, by focusing our case management strategies and interventions on these six areas,
more offenders will complete supervision successfully, resulting in improved public safety in the
District of Columbia. The following sections discuss progress toward each indicator.
23OUTCOME INDICATOR:
Recidivism
Generally speaking, recidivism refers to an offender’s relapse or return to criminal behavior after
receiving some type of sanction (i.e., incarceration, probation, etc.). Although the concept is
relatively easy to understand, measuring recidivism can be challenging. Because criminal activity
may go undetected, official records are often incomplete representations of an offender’s
involvement in criminal activity. Therefore, it may be difficult to identify exactly if or when an
offender recidivates. Because criminal justice agencies are generally limited to official records
when studying recidivism, they often rely on using a variety of constructs in order to obtain a
complete picture of an offender’s criminal activity. While common measurements include
rearrest, reconviction and reincarceration, there is no standard definition of recidivism.
Furthermore, there is no broadly accepted length of follow-up to track recidivism. Recidivism
rates will vary for the same group depending on how it is defined and the follow-up period used.
In addition, although failure rates serve as the foundation of recidivism research, it is essential to
move beyond them to improve recidivism as a performance measure. Constructs such as
desistance (cessation of criminal activity), crime severity, and behavior changes should also be
included as indicators of success. 9
In FY 2020, CSP began reporting on a new performance measure examining actual rearrest and
reconviction rates by the number of days an offender is supervised. Estimates below show these
rates, by supervision type, for offenders supervised during FYs 2017 through 2021.
Both rearrest and reconviction rates per 10,000 offender-supervision-days have, primarily, been
declining among all supervision types since FY 2018. In FY 2017, offenders were arrested almost
17 times per 10,000 days and by 2021, arrests were down to approximately 11 per 10,000 days.
By supervision type, probationers and individuals with CPOs realized the largest declines in
arrests, with reductions of seven and thirteen arrests per 10,000 days supervised for each,
respectively, from FY 2017 to FY 2021.
Convictions also decreased slightly over time, from nearly seven per 10,000 days in FY 2017 to
six in FY 2019. Considerably lower rates of convictions beginning in FY 2020 are largely
attributed to reduced court operations as a result of the COVID-19 pandemic, with only a slight
increase in FY 2021 as the Superior Court for the District of Columbia cautiously began resuming
operations.
9 King, R. & Elderbroom, B. (2014). Improving Recidivism as a Performance Measure. Washington, D.C.: Urban Institute.
24Recidivism Events Per 10k Offender-Days-Supervised by Supervision Type, FYs 2017-2021
Recidivism Type Supervision Type 2017 2018 2019 2020 2021
Arrest for new crime 16.7 16.4 13.7 11.8 10.8
Probation 17.2 16.3 13.1 11.2 10.1
Parole 8.8 9.8 8.2 7.9 5.3
Supervised Release 19.0 19.3 17.6 15.2 14.3
DSA 9.5 9.9 6.3 7.4 6.0
CPO 20.4 17.0 15.5 11.2 7.3
Conviction for new crime 6.6 6.7 5.9 1.5 2.2
Probation 6.1 6.4 5.6 1.6 2.8
Parole 3.9 2.2 2.8 1.1 0.1
Supervised Release 9.1 9.5 8.1 1.7 2.1
DSA 1.0 1.6 1.8 0.1 0.2
CPO 5.0 4.8 3.0 1.2 0.3
During its most recent strategic planning period CSP also recognized the importance of developing
measures to detect smaller, incremental changes in offender behavior that may be indicative of
recidivism. CSP is developing such measures to include monitoring of changes in risk and needs
scores, changes in the duration between arrests, fluctuations in offense severity and specialization,
and changes in the frequency and variety of illicit drug use. Particularly for high-risk offenders,
positive changes in these indicators can all signify real progress. CSP plans to report on these new
measures in the upcoming performance year.
Revocations to Incarceration:
CSP tracks the percentage of its total supervised population revoked to incarceration each year.
Revocation to incarceration of CSP offenders results from multiple factors and is an outcome of a
complex supervision process that seeks to balance public safety with supporting offender
reintegration. Most offenders who return to prison do so after a series of events demonstrates their
inability to maintain compliant behavior on supervision. Non-compliance may involve one or
more arrests, conviction for a new offense, repeated technical violations of release conditions (such
as positive drug tests or missed office appointments), or a combination of arrest and technical
violations. CSP strives to decrease revocations to incarceration by continuing to develop,
implement, and evaluate effective supervision programs and techniques.
After a careful review, CSP updated its reporting methodology for revocations in FY 2012. Prior
to FY 2012, CSP counted the number of offenders re-incarcerated based on the offender’s
supervision status at the end of the respective fiscal year. As such, offenders who were revoked to
incarceration early in the fiscal year, but then began a new supervision period with CSP before the
end of the year (and whose last supervision status did not reflect a revoked status), were not
included in the count of incarcerated offenders. In FY 2012, CSP modified its measurement to
ensure that all revocations were captured for reporting, including those for offenders who may
have begun a new supervision period before the end of the fiscal year. This method was applied to
previous fiscal years, and data in the table below reflect the updated methodology for all years,
which more accurately represents Agency activities and performance.
25You can also read