SWORK - Olive Oil in the North-West of Tunisia: Findings from a Value Chain and Jobs Survey
←
→
Page content transcription
If your browser does not render page correctly, please read the page content below

Public Disclosure Authorized

 JOBS
 WORKING
 PAPER
 Issue No. 42
Public Disclosure Authorized
Public Disclosure Authorized

 Olive Oil in the North-West of Tunisia:
 Findings from a Value Chain
 and Jobs Sur vey

 Michael Weber, Jade Salhab, Keratilwe Tsatsimpe, and
 Sonia Sanchez-Quintela
Public Disclosure Authorized

 WORK
 LET’S

 A global partnership to create
 more & better private sector jobs

Olive Oil
 in the North-West of Tunisia:
 Findings from a Value Chain and Jobs Survey
Michael Weber, Jade Salhab, Keratilwe Tsatsimpe, and Sonia Sanchez-Quintela

The Let’s Work Partnership in Tunisia is made possible through a grant from the World Bank’s Jobs
 Umbrella Trust Fund, which is supported by the Department for International
 Development/UK AID, and the Governments of Norway, Germany, Austria, the Austrian
 Development Agency, and the Swedish International Development Cooperation Agency.
© 2019 International Bank for Reconstruction and Development / The World Bank.

1818 H Street NW, Washington, DC 20433, USA.

Telephone: 202-473-1000; Internet: www.worldbank.org.

Some rights reserved

This work is a product of the staff of The World Bank with external contributions. The findings, interpretations, and
conclusions expressed in this work do not necessarily reflect the views of The World Bank, its Board of Executive
Directors, or the governments they represent. The World Bank does not guarantee the accuracy of the data included
in this work. The boundaries, colors, denominations, and other information shown on any map in this work do not
imply any judgment on the part of The World Bank concerning the legal status of any territory or the endorsement
or acceptance of such boundaries.

Nothing herein shall constitute or be considered to be a limitation upon or waiver of the privileges and immunities
of The World Bank, all of which are specifically reserved.

Rights and Permissions

This work is available under the Creative Commons Attribution 3.0 IGO license (CC BY 3.0 IGO)
http://creativecommons.org/licenses/by/3.0/igo. Under the Creative Commons Attribution license, you are free to
copy, distribute, transmit, and adapt this work, including for commercial purposes, under the following conditions:

Attribution—Please cite the work as follows: Michael Weber, Jade Salhab, Keratilwe Tsatsimpe, and Sonia Sanchez-
Quintela 2020. “Olive Oil in the North-West of Tunisia: Findings from a Value Chain and Jobs survey” World Bank,
Washington, DC. License: Creative Commons Attribution CC BY 3.0 IGO.

Translations—If you create a translation of this work, please add the following disclaimer along with the attribution:
This translation was not created by The World Bank and should not be considered an official World Bank translation.
The World Bank shall not be liable for any content or error in this translation.

Adaptations—If you create an adaptation of this work, please add the following disclaimer along with the
attribution: This is an adaptation of an original work by The World Bank. Views and opinions expressed in the
adaptation are the sole responsibility of the author or authors of the adaptation and are not endorsed by The World
Bank.

Third-party content—The World Bank does not necessarily own each component of the content contained within
the work. The World Bank therefore does not warrant that the use of any third-party-owned individual component
or part contained in the work will not infringe on the rights of those third parties. The risk of claims resulting from
such infringement rests solely with you. If you wish to re-use a component of the work, it is your responsibility to
determine whether permission is needed for that re-use and to obtain permission from the copyright owner.
Examples of components can include, but are not limited to, tables, figures, or images.

All queries on rights and licenses should be addressed to World Bank Publications, The World Bank Group,1818 H
Street NW, Washington, DC 20433, USA; fax: 202-522-2625; e-mail: pubrights@worldbank.org.

Images: © World Bank. Further permission required for reuse
ACKNOWLEDGMENTS

This report was prepared by a team led by Michael Weber (Task Team Leader, Senior Economist, HSPJB)
and Jade Salhab (Task Team Leader, Senior Private Sector Specialist, EMNF1), comprising Sonia Sanchez-
Quintela (Survey Coordinator, Consultant, HSPJB) and Keratilwe Thebe Tsatsimpe (Consultant, HSPJB).
Vida Bobic (Consultant, HSPJB), Anam Rizvi (Consultant, HSPJB), David Megill (Consultant, HSPJB), Valerie
Evans (Consultant, HSPJB), and Ami Shrestha (Consultant, HSPJB) made analytical contributions to the
report. The report furthermore benefited from the findings of the ‘Value Chain Development Training
Program’ supervised by Emiliano Duch (Lead Private Sector Specialist, ETIMT). The survey data was
collected by Anteja (consultancy firm) and the Institute Arab des Chefs Enterprise (IACE). Khadija Sebbata
(Program Assistant, MNCMA), Elena Lukyanchikova (Senior Executive Assistant, EMNDR), Marjorie
Espiritu (Senior Program Assistant, EMNF1), and V. Harifera Raobelison (Senior Program Assistant, HSPJB)
provided administrative support.

The report was carried out under the guidance of Jesko Hentschel (Country Director Morocco, Algeria,
Tunisia, Libya and Malta, MNC01), Michael Rutkowski (Global Director, HSJDR), Najy Benhassine (Regional
Director, EMNDR), Antonius Verheijen (Country Manager, Tunisia, MNCTN), Ian Walker (Manager, HSPJB),
and Jean Pesme (Practice Manager, EMNF1).

The team is grateful to the peer reviewers Ifenyinwa Onugha (Private Sector Specialist, ETIMT), Miles
McKenna (Associate Economist, CCEDR), and Paul Miller (Olive Oil Specialist) as well as Johanne Buba
(Senior Economist, HSPJB) and Thomas Farole (Lead Economist, HSPJB) for their valuable comments to
this report.

The team would like to express its thanks for the support by the National Statistics Institute of Tunisia
(Institut National de la Statistique), the Ministry of Agriculture, Fisheries, and Hydraulic Resources, the
Ministry of Investment and International Cooperation, the Agency for the Promotion of Industry and
Innovation (Agence de Promotion de l’Industrie et de l’innovation), the Agency for the Promotion of
Agricultural Investment (Agence de Promotion des Investissments Agricoles), the Agricultural Training and
Outreach Agency (AVFA), the National Agronomic Institute of Tunisia, the CRDAs of Jendouba, Siliana Beja,
and the National Olive Oil Agency (Office National de l’Huile). The team is also grateful to the different
business associations, trade unions, and private sector firms and cooperatives (SMSAs) that have
participated in the interviews and provided feedback during the study.

RELATED PUBLICATIONS:
 1. Value Chain Development for Jobs in Lagging Regions: Let’s Work Program in Tunisia: Overview
 of the approach, impact, and findings
 2. Medicinal and Aromatic Plants in the North-West of Tunisia: Findings from a Value Chain and Jobs
 survey
 3. Olive Oil, Medicinal & Aromatic plants, and Tomatoes in North-West Tunisia: a roadmap to
 developing competitive advantage on strategic markets

Publications for the Value Chain Development for Jobs in Lagging Regions: Let’s Work Program in
Tunisia (P157321) package can be downloaded on the World Bank Group Jobs and Development
Website.

CONTENTS
Table of Figures .............................................................................................................................................. i
Table of Tables ............................................................................................................................................... i
Table of Boxes ................................................................................................................................................ i
Acronyms and abbreviations ........................................................................................................................ ii
Executive Summary....................................................................................................................................... 1
1. Introduction .......................................................................................................................................... 4
2. Methodology......................................................................................................................................... 6
 2.1 Quantitative data collection ............................................................................................................... 6
 2.2 Qualitative data collection .................................................................................................................. 6
 2.3 Benchmarking ..................................................................................................................................... 7
3. Overview of the Olive Oil Sector ........................................................................................................... 8
 3.1 Global olive oil context ....................................................................................................................... 8
 3.2 The Tunisian olive oil sector................................................................................................................ 9
4. Olive Oil Value Chain Analysis in NW Tunisia...................................................................................... 13
 4.1 Overview of the olive oil VC in NW Tunisia....................................................................................... 13
 4.2 Structure of the olive oil VC in NW Tunisia ....................................................................................... 15
5. Jobs in Tunisia’s NW Region Olive Oil Value Chain ............................................................................. 18
 5.1 Employment/employee profile ......................................................................................................... 18
 5.2. Employment quality ......................................................................................................................... 22
 5.3 Constraints to employment/job creation ......................................................................................... 24
6. Potential and requirements for job growth ........................................................................................ 25
 6.1 Market opportunities ........................................................................................................................ 25
 6.2 Constraints to seizing opportunities (competitiveness and output growth) .................................... 33
7. Conclusion ........................................................................................................................................... 34
Annex .......................................................................................................................................................... 36
 Annex 1: Survey sample design and weighting procedure ..................................................................... 36
 Sample Design for Tunisia’s Jobs in Value Chains Survey ................................................................... 36
 Weighting Procedures for Tunisia’s Jobs in Value Chains Survey ....................................................... 38
 Annex 2: Qualitative data analysis .......................................................................................................... 41
 Annex 3: Olive Oil Standards................................................................................................................... 42
 Annex 4: Cost comparison of farming systems in major olive oil producing countries.......................... 43
 Annex 5: Deriving baseline workforce numbers ..................................................................................... 46

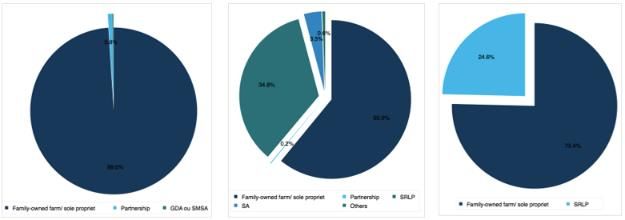
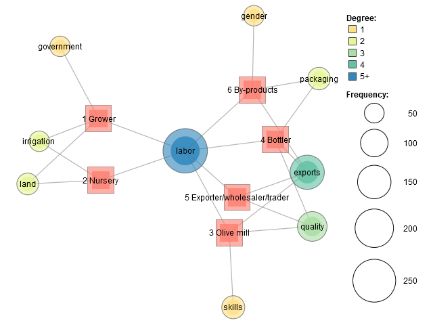
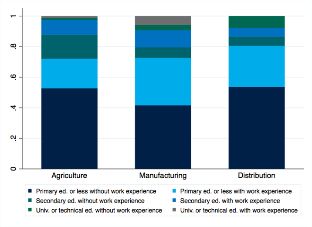
TABLE OF FIGURES
Figure 1: Survey coverage in Tunisia NW Olive Oil VC .................................................................................. 7
Figure 2: Legal structure of farms/firms across the value chain nodes (agriculture - LHS and Distribution -
RHS) ............................................................................................................................................................. 15
Figure 3: Distribution of establishments by its size in each node - agriculture (LHS), manufacturing (Mid),
and Distribution (RHS) ................................................................................................................................ 16
Figure 4: Customer type across the nodes of the Tunisia NW Olive Oil Value Chain ................................. 17
Figure 5: Split of costs types across each node .......................................................................................... 17
Figure 6: Employment type ......................................................................................................................... 18
Figure 7: Hours per output of product........................................................................................................ 19
Figure 8: Education levels of new hires last 3 years ................................................................................... 20
Figure 9: Share of youth in permanent workers ......................................................................................... 21
Figure 10: Women participation (ownership and employment) ................................................................ 22
Figure 11: Average monthly wages for permanent workers ...................................................................... 23
Figure 12: In-kind benefits of full-time workers ......................................................................................... 23
Figure 13: Main labor related obstacles to business growth...................................................................... 24
Figure 14: Output and production/sales expectations for the following year ........................................... 26
Figure 16: Constraints to current production operations (LHS – Agriculture, Center – Manufacturing, RHS
– distribution) ............................................................................................................................................. 33
Figure 17: Co-occurrence network – labor is the biggest concern ............................................................. 41

TABLE OF TABLES
Table 1: Main olive oil producing countries (2016-17) ................................................................................. 8
Table 2: Main olive oil importing countries (2016-17) ................................................................................. 9
Table 3: Olive growing sector statistics for Tunisia and major producers .................................................. 12
Table 4: Main features of the NW Tunisia Olive Oil VC .............................................................................. 14
Table 5: Baseline estimated employment in the OO VC in NW Tunisia ..................................................... 19
Table 6: Olive oil production costs for different farming systems in major olive oil producing countries,
2009-2013 ................................................................................................................................................... 27
Table 7: Input growth multiples and their ratio in the OO VC .................................................................... 32

TABLE OF BOXES
Box 1: History of Olive Oil Production in Tunisia and the olive varieties it produces................................. 10
Box 2: Segmentation of the main olive oils, their use, and quality ............................................................ 13
Box 3: Importers of olive oil and destination market of some major exporters, 2017 .............................. 28
Box 4: Increasing efficiencies through cooperatives and innovation/technology - Examples from
Andalusia, Spain .......................................................................................................................................... 29
Box 5: Differentiation strategy and market positioning for small companies/farmers - examples from
Spain and Italy ............................................................................................................................................. 31
Box 6: Intensification of Olive Oil Growing ................................................................................................. 45

i|Page
ACRONYMS AND ABBREVIATIONS
Acronym Definition
 CAP Common Agricultural Policy
 CW Center West
 EVOO Extra Virgin Olive Oil
 F-O/SP Family-owned or sole proprietorship
 FGD Focus Group Discussion
 GDA Communal ownership groups for Agricultural Development
 (Groupements de Développement Agricoles)
 IOC International Olive Council
 INS National Statistical Institute of Tunisia
 ITC International Trade Council
 NW North West
 ONH National Oil Office (Office National d’Huile)
 OOPAO Olive oil production of agricultural output
 PDO Protected Designation of Origin
 PGI Protected Geographical Indication
 SA Limited Company (Société Anonyme)
 SARL Limited Liability Company (Société à responsabilité limitée)
 SME Small and Medium Enterprise
 SMSA Mutual Agricultural Service Companies (Sociétés mutuelles de services
 agricoles)
 Survey Survey of respondents in NW region across agriculture, manufacturing,
 and distribution segments of the Olive/Olive Oil value chain
 Tunisia Strategic Market Report on the Roadmap to developing more competitive value chains
 Segmentation Report for Olive Oil, Medicinal plants, and Tomatoes in North-West Tunisia:
 Findings from the pilot strategic market segmentation
 UAA Utilized Agricultural Area
 VC Value Chain
 VOO Virgin Olive Oil
 WBG World Bank Group

ii | P a g e
EXECUTIVE SUMMARY
This study analyzes the olive oil sector in the North West of Tunisia, encompassing the governorates of
Jendouba, Béja, Siliana, and Kef. It focuses on the creation of more and better jobs in the sector, based on a
survey conducted on the olive oil value chain (“VC”) in the North West region, and a comparison to other
leading countries in the olive oil industry. It thereby determines potential productivity gaps and areas of
improvement to ultimately increase the sectors’ competitiveness and lead to more and better jobs. The data
used for this report was collected in 2017 and 2018. The survey covered a sample of 861 respondents, split
across the three main parts of the VC – agriculture (544), manufacturing (192), and distribution (125). The
survey involved both quantitative and qualitative interviews as well as focus group discussions.

Global overview

World production of olive oil was 2,56 million tons in 2017 with ~98% concentrated in the Mediterranean basin.
Spain (50.3 percent), Greece (7.6 percent) and Italy (7.1 percent) are the top tree ranked olive oil producers
and Tunisia (3.9 percent) ranked seventh. Consumption of olive oil has increased significantly, 1.8-fold between
1990 and 2016–17, driven largely by rising consumption in non-IOC member countries while consumption in
main producing countries has remained stable. Olive oil consumption is expected to continue increasing
moderately given its growing end-use segments: food, pharmaceuticals, and cosmetics and the growing middle
class in developing countries such as China.

Tunisia olive oil sector

The cultivation of olive trees in Tunisia extends over the majority of agricultural land. It accounts for 80 percent
of the total area devoted to tree crop plantations, 35 percent of arable land, and 65% of all farmer’s jobs in
Tunisia. Olive oil production varies annually in Tunisia with average production between 2006 to 2016 at
~180,000 tons and a peak in 2015 of ~340,000 tons to meet constrained production in Spain and Italy. Over
90% of olive oil farming is traditional rainfed mostly on steep slopes. Tunisia produces, among others, two
autochthonous olive varieties, Chétoui and Chemali, and its olive oil tends to be favored by export markets.
Olive oil exports are at the top of agricultural exports, representing about 75 percent of total production in the
country. Tunisia is the fifth main exporter and accounts for 5 percent of the world’s total olive oil exports.
However, the Tunisian Olive Oil sector suffers from climate related and other constraints (quality bottling,
packaging, and service at high standards such as logistics) affecting consistency of production levels.
Additionally, Tunisia seems to experience some inefficiencies in its olive production practices with low yields
in tons olives per hectare (0.8 vs. 2.5-3 of Italy, Spain and Greece). Also, it the ratio of percent olive oil
production of agricultural output to percent utilized agricultural land is lower in Tunisia (~0.2) than in Spain
and Greece (~0.6 each) and Italy (~0.4). Though this is a challenge for more bulk olive oil focus, the current
production characteristics might be favorable to more organic and gourmet olive oil production as they are
more environmentally sustainable compared to high-input high-yielding irrigated new farms.

Olive Oil VC in Tunisia NW Region

The NW region represents 41 percent of Tunisia’s production of organic virgin olive oil and extra-virgin olive
oil, with a total average production of 90,000 tons per year. In the NW region, Chétoui is the main variant. The
region produces and sells two main types of olive oil either in bulk or individually bottled. The first is virgin olive
oil for which no chemicals or heat is used when extracting oil from the fruit. It maintains the purity and taste
of the olive, while production standards are not as rigid as for other oils. Second is extra virgin olive oil, the
highest international standard in the industry, which retains more authentic olive taste and has a lower level
of oleic acid (not more than 0.8 grams per 100gr) than other olive oil varieties.

1|Page
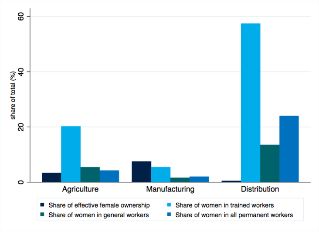
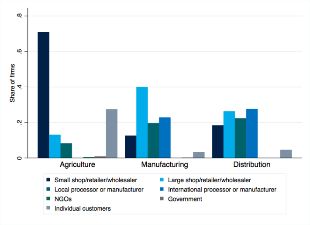
The olive oil VC comprises 5 main segments (“production”, “picking and collection”, “crushing and oil
production”, “conditioning”, and “commercialization”) which can be organized across the 3 nodes of
agriculture, manufacturing, and distribution. Most establishments in the olive oil value chain are either family-
owned or sole proprietorship, by nodes, their share ranges from 99 percent in agriculture to about 61 percent
in manufacturing. Micro establishments dominate the olive oil value chain, ranging from about 97 percent in
agriculture to 10 percent in manufacturing. Main olive oil customers types differ across VC nodes. Small
shop/retailer/wholesalers dominate the agriculture node while large shops/retailers/wholesalers dominate
the manufacturing node. There is no real dominant customer type in the distribution node. Across nodes,
though by varying degrees, labor and production inputs1 hold the highest shares of costs with other cost types
like fuel, electricity, and water in manufacturing and transportation and storage in distribution emerging as
important in line with activities of those nodes.

Jobs in the NW region olive oil VC

The estimated total number of jobs in the NW region’s olive oil VC is ~219,793, of which 216,008 are in
agriculture (household labor reported in full-time equivalent (FTE)), 3,251 in manufacturing (temporary and
household labor in FTE), and ~535 in distribution (temporary and household labor in FTE). By workforce type,
~50,560 workers are permanent, 41,764 constitute household labor (in FTE), and 127,470 temporary labor (of
which 809 in manufacturing and 77 in distribution in FTE). Labor intensity is particularly high in the agriculture
node of the value chain when compared to the manufacturing node. Less hours are used and more value
generated per liter of olive oil produced in the manufacturing node compared to the kilogram of olives in the
agriculture node. Given the seasonal nature of the work in the agriculture node, temporary labor accounts for
the majority of employment in this sector and very few full-time trained employees are hired throughout all
the nodes (highest share in manufacturing at ~50%). Across the value chain, employment is characterized by
low levels of education and work experience. Over 70 percent of workers hired across all nodes over the last 3
years have primary education or less. Women ownership of operations is highest in the manufacturing node
(albeit only ~8 percent) and in terms of employment, women are most represented in the distribution node.
In manufacturing, the share of trained female workers and those in permanent employment reach ~60 percent
and more than 20 percent, respectively. Youth2 are employed as permanent workers throughout all nodes and
hold the highest overall share in distribution (~21 percent). For trained permanent youth workers, the highest
share is in agriculture at ~25 percent.

Quality of the jobs

Monthly wages of full-time general employees are similar between firms across all three nodes. They range
between TND 1,000 and 1,500 and are highest in agriculture. Women tend to be paid less than men for
performing similar work; TND 12-15 per day compared to TND 20-25 per day for men. Furthermore, for
temporary workers in the agriculture node, wages are significantly lower (equivalent to TND ~400-450 per
month) than those for full-time workers. Workers receive in-kind benefits but they typically lack access to social
protection benefits associated with formal employment (e.g. healthcare). While wages appear to be low, they
are considered to be the main labor-related issue facing firms. That said, only ~35 percent of businesses
perceive labor costs as a constraint across all nodes.

Opportunities for growth and job creation

1 These include technical services, seeds/fertilizers, rental of machinery, irrigation, storage, etc. in the agricultural node and raw
material inputs in the other nodes.
2 Determined as workforce of age 25 or younger.

2|Page
An upgrade and reposition strategy might be the best strategy for growth in Tunisia’s NW region olive oil VC.
In this context, upgrading would imply a focus on adding value by moving to bottling for the current markets
that predominantly receive bulk olive oil (and any potential new markets emerging from new extra-virgin olive
oil importers). Repositioning, in turn, implies a focus on the emerging and growing premium and gourmet olive
oil importers. Tunisia is unlikely to grow its olive oil sector solely through the existing bulk-focused export
strategy because its price competitiveness is neither sustainable nor well aligned to creating more and better
jobs. Also, Tunisian producers do not have strong productivity competitiveness in this segment and are
vulnerable to Spanish producers’ dominance and market positioning. However, in the gourmet olive oil
segment, Tunisia has an even higher price competitiveness to would be major competitors on quality of oil and
an export focus. Tunisia might be in a position to better compete in new and emerging markets where the
current labor-cost margin can be used to develop its logistics and promotional capacities. Additional value can
be added in the segment by bottling as opposed to selling in bulk.

Based on the hypothetical question on investments in capital and permanent labor (general and trained)
needed for doubling output, respondents report elasticities3 that are suggestive of production functions with
diminishing returns to scale. Further, the relationship between investments in capital and permanent labor
provide some insights into the dynamics or capital and labor requirements with respect to output growth
(measured through a ratio of input growth multiples4). Across the value chain, for both general and trained
permanent labor, output growth in the olive oil VC requires relatively more capital except in the agriculture
node that requires relatively more general labor than capital for doubling production. To increase the likelihood
of output growth, Tunisia will have to address current inefficiencies and constraints to production. Most
significantly, constraints to accessing finance (which could pose a key constraint as growth will largely be capital-
driven) and markets, and challenges in transportation and logistics, as well as packaging inefficiencies and quality
of bottles currently available in Tunisia.

Better quality job creation could be expected if output is doubled with more of a focus on higher-end market
segments and selling higher-value added bottled olive as serving this market segment requires higher skills.
However, it might be hard to achieve these jobs based on reported elasticities, their implied associated costs of
labor, and challenges to hiring higher skilled employees (expecting higher wages or applicants lacking required
experience). Nonetheless, it would be expected that these new better jobs would benefit women and youth who
are lowly represented in current permanent labor at 6.4 percent and 17.0 percent overall respectively.

3 In separate modules, survey respondents are asked (i) how many additional workers, both general and trained, they would hire
and (ii) how much they would additionally invest in equipment/facilities if they were awarded a three-year contract that requires
them to double their output. As such, reported elasticities should be interpreted as the input requirement (e.g. labor) to double
output holding other inputs constant (e.g. capital). The survey does not ask about the anticipated increase in temporary labor.
4 The ratio of labor-capital multiples captures the relationship between a labor multiple to capital multiple given a doubling of

output. If relative input multiple range is (0,1) then output growth in the value chain requires relatively more capital; however, if
it is >1 it requires relatively more labor.

3|Page
1. INTRODUCTION
This study analyzes the olive oil sector in the North West of Tunisia, focusing particularly on the
potential creation of more and of better-quality jobs. It is based on a survey conducted on the olive oil
value chain (“VC”) in the North-West region of Tunisia, benchmarking its performance to other leading
countries in olive oil industry to determine potential productivity gaps and areas for improvements to
ultimately increase the sectors’ competitiveness and lead to more and better jobs. It provides insights on
potential areas for policy interventions. This study is part of the “Value Chain Development for Jobs in
Lagging Regions - Let’s Work Program in Tunisia” which aims to identify some of the most binding
constraints affecting the creation and productivity of jobs within targeted value chains in a lagging region
in Tunisia and inform relevant World Bank Group lending projects currently in preparation to help tackle
these constraints5.

Economic development in Tunisia has been characterized by significant regional imbalances where
coastal regions develop faster and interior regions lag. The North West (NW) and Center West (CW)
regions together are home to about 47 percent of the poor in Tunisia. They have the lowest regional
development indicators in education, employment, and health and the highest unemployment rates for
university graduates. Well-paying jobs and other income opportunities are limited, and poverty levels are
high. Consequently, the World Bank Group (“WBG”) approach aims to promote structural change in the
Tunisian economy, particularly in the country’s lagging regions. Its approach uses the concept of VC and
cluster development to determine how to improve market access and increase productivity, employment,
and competitiveness. The ultimate objective is to create more and better jobs in small and medium
enterprises (SMEs) that are competitive6 in a diversified range of markets.

Ultimate goals of the VC analysis for jobs is to determine opportunities for increasing formal wage
employment (more jobs), especially for women, youth, as well as vulnerable groups (inclusive jobs),
and improve returns to self-employment and informally employed (better jobs). VCs offer potential to
leverage large scale job creation that span from high-skilled, formal employment in globally competitive
firms to quality, sustainable earning opportunities for low-skilled self-employed workers or smallholders7.

Agriculture (crops, forestry, and livestock) dominates the economy in the NW and CW regions, which
are regions targeted by multiple WBG operations, including the one to which this technical assistance
is associated8. The two regions account for 50 percent of Tunisia’s agricultural land and 82 percent of
forests. Agriculture provides the bulk of employment and income opportunities in these two regions and
income levels remain low. The Olive Oil industry in particular is critical in the governorates of Jendouba,
Béja, Siliana, and Kef in the North West Region.

The rest of the document proceeds to provide an introduction and overview of the methodology in
sections 2 and 3 respectively, contextual background on the global and Tunisian olive oil sector in section
4, and a focus on the olive oil value chain in the NW region of Tunisia in sections 5-7 based on the

5
 This program is part of the Let’s Work Program coordinated by the World Bank Group for more and better private sector jobs
in countries like Bangladesh, Mozambique, and Tunisia. Let’s Work is a global partnership that unites organizations dedicated in
the effort to provide effective solutions to the global job crisis by harnessing the potential of the private sector to help create
more and better jobs, in a vision that seeks fairness and inclusiveness (see https://www.jobsanddevelopment.org/lets-work/).
6
 Offer fair competition-based opportunities to local actors and smallholders
7
 Jobs in Value Chains Survey Toolkit, World Bank, 2018: 4,
8 Tunisia Integrated Landscape Management Project

4|Page
conducted survey with a comparison to benchmark countries and related growth and employment
scenarios.

This report is supplemented by the “WBG Support to Value Chain Competitiveness in Tunisia” report
which goings into further detail about the productivity and employment growth opportunities, challenges
to these and initiatives that can be taken to mitigate the challenges.

5|Page
2. METHODOLOGY
2.1 Quantitative data collection
The data used for this report was collected from 861 respondents, split across the three main parts of
the VC (agriculture, manufacturing, and distribution), mostly in the NW of Tunisia. Of all respondents,
544 belong to the agriculture node, 192 to manufacturing node, and 125 to the distribution node. The
survey was conducted in 2017 and 2018. The primary area for the survey were the four governorates of
the NW (Beja, Jendouba, El Kef and Siliana) though some nodes of these VCs were also covered in the
governorates of Nabeul, Sfax and Ben Arous. The latter areas were included because they 1. account for
most of the processing facilities in the country (>50 percent while only 18 percent of processing facilities
are in the North) and 2. constitute the majority of olive processing whereas the NW regions processing
facilities (75 mills and 7 packaging units) are currently underutilized at ~20-30 percent of their capacity.

The sampling strategy varied by node of the olive oil value chain. There are three nodes considered:
agriculture (nurseries, harvesting subcontractors, and olive growers); manufacturing (olive oil mills,
producers of by-products, and olive oil bottlers); and distribution (traders, wholesalers, and exporters &
ONH) (Figure 1). The sampling frame was stratified by node and region, with 11 strata in total. The
agriculture node, due to the large number and dispersion of establishments, used a stratified two-stage
sample design; the first stage consisted of a selection of sample clusters and replacement clusters from
the database of the National Statistical Institute of Tunisia (INS). For most establishments, the weight is
equal to the inverse of its probability of selection. However, the largest establishments in some nodes
were selected with certainty, so they were classified as self-representing and have a weight of 1. See
Annex 1 for more detailed information on survey sampling approach9.
2.2 Qualitative data collection
In order to complement the findings from the quantitative survey, a number of focus group discussion
(“FGDs”) and individual interviews were conducted with actors from the same nodes. The aim was to
get a better understanding of the main issues facing firms in these sectors, with a particular focus on
matters related to production, access to imports, marketing, exports, packaging and branding, as well as
certification. There was a total of 36 individual interviews, with representatives of nurseries, olive
growers, traders and exporters, olive oil mills and producers of by-products. Each of the three focus group
discussions was organized around the three nodes. Responses from the interviews and FDGs were coded
and analyzed to identify patterns and draw insights (See Annex 2 for methodology used).

9 For more detailed on the sampling procedure see “Annex 1: Survey Sample design and weighting procedure”

6|Page
Figure 1: Survey coverage in Tunisia NW Olive Oil VC

2.3 Benchmarking
To put the performance of the Tunisia Olive Oil VC in perspective, comparator country market
performance (benchmarking) was undertaken. Additionally, benchmarking provides useful insights on
possible constrained segments/nodes of the Tunisia Olive Oil VC and probable performance targets it
could reach. There is no official, universally recognized benchmark in the international olive oil market; as
such, representative markets (i.e. Spain, Italy, and Greece – some of the best performing countries in Olive
Oil production) were considered. The report merely draws insights from these markets and is not intended
to be a comparative assessment of the olive oil sector across the four countries. The analysis of specific
nodes will pay special attention to the Tunisian case and highlight lessons from benchmarking countries
to address similar problems or opportunities which Tunisia encounters.
Though potential insights will be drawn from other markets, this report does not attempt to prescribe
what Tunisia should do as the operating context of the Tunisia olive oil sector is different from comparator
countries. The report does not explain in detail the specific strategies that firms need to implement to be
more competitive; instead, it provides general guidance on where market opportunities lie and the
foundational considerations for accessing them.

7|Page
3. OVERVIEW OF THE OLIVE OIL SECTOR
3.1 Global olive oil context
World production of olive oil was 2,56 million tons in 2017 with ~98% concentrated in the
Mediterranean basin10. Spain (50.3 percent), Greece (7.6 percent) and Italy (7.1 percent) are the top tree
ranked olive oil producers and Tunisia (3.9 percent) ranked seventh (Table 1). Beyond the Mediterranean
basin, the cultivation of the olive tree is spreading to other countries, such as the United States,
Afghanistan, India, Pakistan, South America countries11, and other Asian countries. Production areas are
being developed, often through foreign investment from leading traditional countries such as Spain and
Italy. It is likely that new producer countries will increase quality and productivity and will become
competitors of the Mediterranean area in the long term. Globally, the total area of olive groves is over 11
million hectares in 47 countries. More than 6.7 million families worldwide have olive trees with an average
1.67 hectare per family5.
Table 1: Main olive oil producing countries (2016-17)

 Country Production Percentage of world Percentage change from
 (tons, thousands) total 2006
 Spain 1,290.6 50.3 +56.2
 Greece 195.0 7.6 −54.0
 Italy 182.3 7.1 −71.3
 Turkey 178.0 6.9 +58.9
 Morocco 110.0 4.2 +46.7
 Syrian Arab Republic 110.0 4.2 +10.0
 Tunisia 100.0 3.9 -54.5
 Portugal 69.4 2.6 +138.5
 Algeria 63.0 2.4 +96.9
 Source: IOC website, 2019

The worldwide consumption of olive oil has increased significantly over the last decade. Pressing whole
olive produces olive oil but it is also used in cosmetics, pharmaceuticals, and soaps, and as fuel for
traditional oil lamps. Within the Mediterranean, olive oil is the main component in the diet and it has
gained popularity in food and beverages in global consumption because of its many proven health benefits
and its culinary usefulness. Though olive oil producing countries tend to also be high consumers of it, olive
oil consumption is growing in non-producing countries. The global market in olive oil is expected to
continue to grow at a moderate pace because of the expansion of its end-use segments (the food industry,
pharmaceutical industry, and beauty care and cosmetics industry).
Between 1990 and 2016–17, world consumption of olive oil increased 1.8-fold in volume driven largely
by non-IOC member countries12, whose share of world consumption increased from 11 percent to 24
percent in this period (IOC). The bulk of consumption is still largely concentrated in the producer

10
 IOC website, www.internationaloliveoil.org/. The IOC is the world’s only international intergovernmental organization in the
field of olive oil and table olives. Its current membership members includes the leading international producers and exporters of
olive oil and table olives
11
 Argentina and Chile already produce almost 25,000 tons per year (FAO 2015)
12
 IOC currently has state members, plus the European Union. State members are Albania, Algeria, Argentina, Croatia, the Arab
Republic of Egypt, the Islamic Republic of Iran, Iraq, Israel, Jordan, Lebanon, Libya, Montenegro, Morocco, Palestine, the Syrian
Arab Republic, Tunisia, Turkey, and Uruguay.

8|Page
countries. Among non-IOC members, the United States has seen the most spectacular growth in total
consumption 336,000 tons in 2018 from 209,000 tons in 2000 (+60,8 percent)13. Additionally, changes in
world imports of olive oil from 2006 to 2016-17 reflects the change in world consumption of olive oil. The
United states accounted for ~39 percent of world imports in 2016-17, European Union ~12 percent, Brasil
~8 percent, and Japan ~7 percent. All countries/regions, except the European union and Australia (no
change), increased imports from 2006 (Table 2). Though China accounts for only ~5% of olive oil imports
in 2016-17, the IOC estimates that by 2020, 160 million Chinese households will have the purchasing
power to include olive oil in their diets.
Table 2: Main olive oil importing countries (2016-17)

 Country Import (tons, 000s) Percentage Percentage change from 2006
 United States 305.0 39,05 +31,5
 European Union* 90.5 11,52 -52,1
 Others nonproducers 60.0 7,68 +44,6
 Brasil 59.5 7,60 +128,8
 Japan 54.5 6,97 +81,7
 Canada 39.5 5,05 +31,7
 China 39.0 4,99 **
 Australia 29.0 3,71 0
 *Without intra-community trade. ** No import of olive oil in China in 2006
 Source: IOC website, 2019

3.2 The Tunisian olive oil sector
The cultivation of olive trees is of great importance to the Tunisian economy, contributing to
employment, rural development, and exports. The cultivation of olive trees in Tunisia extends over the
majority of agricultural land and currently holds 1,788,000 hectares, representing ~ 80 percent of the total
area devoted to tree crop plantations and 34 percent of arable land. There are ~60 million olive trees in
Tunisia, mostly found in single-crop plantations, but can also be found in combination with other fruit
trees. The olive farm distribution is 32% in the north, 46% center, and 22% south. Planting density per
region adapts to average annual rainfall. The North, with an annual average 400-600mm of rainfall has
the highest density of trees at 100 trees per hectare followed by the center with an annual rainfall of 300-
350mm corresponding to 50-60 trees per hectare, and the south with 17-20 trees per hectare given its
200-250mm of rain per year. The general age structure of olive orchards in Tunisia in 2009 was 15.5%
young orchards (less than 5 years), 75% bearing orchards (5-50 years), and 9.5% old orchards (greater
than 50 years). Olive growing provides income to >309,000 farmers, representing 65 percent of all farmers
in Tunisia. Additionally, the IOC Tunisia country profile suggest that it generates 50 million work days a
year. The sector has a network of 1,707 olive processing facilities with a ~43,680 tons per 8-hour day
capacity. These include 613 traditional mills, 437 press mills, and 657 continuous-process facilities of
which 18% are in the North, 28% Sahel, 33% Sfax, 15% Centre and South-west, and 6% South-east.
Additionally, there are 7 olive-pomace oil extraction plants (operating below-capacity), and 40 packaging
plants with yearly capacity greater than 160 000 tons, a dozen of which specialize in olive oil only14.

13
 Statista, 2019
14
 IOC Economic Affairs and Promotion Unit County Profiles – Tunisia 2012: https://www.internationaloliveoil.org/what-we-
do/economic-affairs-promotion-unit/ (accessed 12/03/2019)

9|Page
Olive oil productions varies annually in Tunisia; average production between 2006 to 2016 was ~180,000
tons. Average annual production growth in this period was 3 percent. If Tunisia performed at its average
production in 2016-17, it would be ranked in the top 4 olive oil producing nations only behind Spain, Italy
and Greece (some of its biggest buyers). However, in 2016-17, Tunisia produced only ~100,000 tons,
accounting for ~4 percent of global exports and ranking 7th in top producers (Table 1). This signified a ~71
percent decrease from its record production of 340,000 tons of olive oil in 2014/15. Chetoui and Chemali
are the main varieties of olives produced in Tunisia (Box 1 provides further context and supplemented by
Annex 3 which provides information on olive oil standards).

Box 1: History of Olive Oil Production in Tunisia and the olive varieties it produces

 Olive oil was introduced in modern-day-Tunisia by the Phoenicians, it has been producing olive oil since the 8 th
 century BC. It was then spread by the Carthaginians, and under the Roman empire olive oil cultivation
 expanded even further as irrigation techniques and methods of olive oil extraction evolved. The Arab conquest
 is associated with the ceasing of olive cultivation, but olive orchards reappeared under the French protectorate
 (since 1881).

 Tunisia produces two main autochthonous varieties, Chetoui and Chemali, considered of best quality. Chetoui,
 which Is grown in nearly 15 percent of Tunisia olive groves, is present in the coastal region, valleys and
 highlands in the North-West (the main variety of the region). It is naturally high in phenolics, including
 antioxidants, and has good levels of mono-unsaturates (oleic acid) that aid oil stability. However, the high level
 of bitterness in Chetoui means that its flavor can be harsh and unpleasant if the fruitiness of the oil is not well
 conserved. This variety like all olives needs high standards of processing and storage. Chemlali is cultivated in
 warm coastal areas, constitutes nearly 85 percent of olive plantations and represents 80 percent of the
 national production. It has naturally lower phenolics than Chetoui and may have lower levels of mono-
 unsaturates than some other varieties and therefore lower stability; however, this can be mitigated by early
 harvest and high standards of processing and storage. Both these varieties are used for the production of table
 olives and olive oil. There are numerous other varieties that can be utilised, some unique to the NW, others
 from elsewhere. These include Oueslati which is present in Kerouan and Siliana in the North, Zarazi present in
 the south, Jerboui present in the North and North West, and Zalmati and Chemchali present in the south
 (ONH, 2017).

 This natural diversity offers opportunities to blend oils for particular taste profiles. Some producers in the NW
 purchase specific unique oils from other parts of Tunisia for this purpose. Such blends can also deliver stable
 and exciting oils for discerning consumers.

Traditional, hence extensive, agriculture dominates Tunisia’s olive sector and is mainly practiced in
marginal lands, the South, and some areas in the Center. It is characterized by a low use of inputs and
variable rain, with lower levels in the center and south as discussed. Trees in center and south areas are
normally older and less productive. As a result, the productivity in these regions is lower than the NW of
the country. Overall, while in some other MENA countries there is an increasing investment in super-
intensive systems, Tunisia, however, might want to consider intensive systems (i.e. using drop systems or
technologies) especially if it intends to continue to compete on standard extra virgin olive oil exports.
However, super-intensive systems, while existing in the country, present several issues related to water
consumption and sustainability of the trees. There seems to be a general consensus that super-intensive
olive tree farms are not sustainable in the long-term and that both traditional and intensive should be.

10 | P a g e
Tunisia olive oil tends to be favored because of its high quality and organic nature15. 40 percent of
Tunisia’s total olive growing areas are organic olive-growing, covering 125,000 hectares, the third largest
in the world. ~30 Tunisian producers are responsible for the 183 percent increase in organic olive oil
production in Tunisia from 2006-2013. This presents a unique opportunity to portray itself as a leader in
the organic production of food and olive oil in particular. The transition to “organic” cultivation is simple
in Tunisia because of the traditional way of growing olives; the main barrier is the cost of certification.
With respect to organic olive cultivation, the production characteristics production characteristics may
confer advantages regarding organic status, environmental sustainability, carbon status and pest and
disease management, especially when compared with high input high yielding irrigated new farms.
Additionally, more than 70 percent of the production is of extra virgin quality, especially within the first
month of the life of the oil.
Olive oil exports are at the top of agricultural exports and representing about 75 percent of total
production in the country with Tunisia as the fifth main exporter, accounting for 5 percent of the world’s
total olive oil exports16. Main destinations are the European Union, which took around 70 percent of the
exported olive oil, and North America (16 percent); most exports (90 percent) are in bulk. Export of 53,700
tons of Extra Virgin Olive Oil (“EVOO”) in bulk to almost 20 countries including Italy (18,800 tons), Spain
(16,000 tons), the USA (9,000 tons) in addition to several new destinations like Argentina, Austria,
Australia, etc. The country exported 4,200 tons of Bottled (“EVOO”) to 31 destinations, including 1,500
tons in France and 1,000 tons in Canada. Tunisia exports packaged olive oil to 50 markets (28 in 2006/07)
although markets are less diversified for bulk exports. China and Japan are the only two Asian countries
that import Tunisian olive oil, around 1 percent each of them and Brazil is a growing market, three percent
in 2016 (ONH, 2016). Tunisia is trying to market its agricultural production as bio, a niche that has a lot of
potential across products. This has been also the case of the olive oil and the exports of the bio olive oil
are around 12 percent of the total export with a 10 percent higher selling price. Organic olive oil exports
have grown from 2,100 tons in 2004 to 13,500 in 2015.
However, the Tunisia Olive Oil sector suffers from climate related and other constraints affecting
consistency of production levels. Ninety-five per cent of olive growing is rain fed in varying climactic
conditions. The unstable conditions have led to potential shortages in olive oil production in addition to
the bad crops in northern Mediterranean countries (due to decimated crops or hot temperatures that
attract fruit flies and bacteria have damaged groves). Additionally, poor harvests in Spain and Italy led
Tunisia to become the world’s second largest producer of olive oil. In 2015, Tunisia has not been able to
capitalize on this situation. It suffers from low quality standardization, weak marketing and exports
extensively in bulk (90 percent of total olive oil exports, mainly to Italy and to lesser extent to Spain and
France). Value-added bottled and branded oils currently represent barely 10 percent of total olive oil
exports. Small, technologically ill-equipped and poorly organized producers are disadvantaged in face of
the requirements of big international food chains and networks. They find it practically impossible to
comply with high marketing and logistical standards of those (Lybbert and Elabed, 2013).

15
 Major determinants of olive oil quality are variety of olive grown and harvested , climate conditions, cultivation techniques,
ripening of olives, harvesting modalities, transport and storage conditions of olives, extraction system and conditions, and storage
conditions of the obtained oil.
16
 See Box 4, Fig. i in section 6.1 Market opportunities. Harvard Center for International Development – Atlas of Economic
Complexity (accessed 2019/11)

11 | P a g e
Tunisia domestic consumption of olive oil is lower compared to other major producers. The per capita
consumption of olive oil in Tunisia is around ~3 kilograms per person, >3-5 times less than other main
producers: 16 kilograms in Greece, 11 kilograms in Spain and 10 kilograms in Italy. The domestic
consumption of olive oil is relatively weak likely due to its high price in comparison to, subsidized,
vegetable oils and despite its health benefits. Additionally, Tunisia also account for
4. OLIVE OIL VALUE CHAIN ANALYSIS IN NW TUNISIA
4.1 Overview of the olive oil VC in NW Tunisia
The NW region represents 41 percent of Tunisia’s production of organic virgin olive oil (“VOO”) and
EVOO, with a total an average production of 90,000 tons per year. It includes the Beja, Jendouba, Kef,
and Siliana districts with 75 olive mills (~5 percent of total), 7 packaging units (25 percent of total), and
180,000 hectares of land (7 percent of national land but ~10% of crop plantations). The region represents
16% of national total olive trees based on its 100-150 trees per hectare (See Table 2 for overview of NW
value chain) with lowest costs per tons due to its relatively high density and low labor costs. The NW
region records the highest yields (904 kilograms per hectare) (DGPA 2017), compared with Central (870
kilograms per hectare) and South (650 kilograms per hectare) regions of Tunisia. The higher yield is
attributable to its higher rainfall, higher planting density, and younger age of olive trees. Though yields
are high, productivity in the region, especially in Kef and Siliana, is amongst the lowest in the
Mediterranean area.
In this region, the main commonly produced olive oils are EVOO and VOO with the Chétoui olive variety
dominating plantations though some varieties exist as well (see Annex 3 for olive oil standards). ~90
percent of the olive trees are the Chétoui variety and 10 percent are Gerboui and Oueslati. The Chétoui
variety has some of the highest yields (28 percent in oil) and produces fruity oil, with a predominant
aftertaste, that is highly appreciated for its phenolic content and as an antioxidant. Gerboui variety
produces 25% of oil yield with an oil with a flavor reminiscent of fresh fruit with a tinge of
bitterness. Oueslati variety is grown in the Kairouan region (outside of scope of VC analysis) an is a well-
balanced and fruity oil, with low bitterness and a taste that is reminiscent of almonds.

Box 2: Segmentation of the main olive oils, their use, and quality

 Virgin Olive Oil: is commonly used for cooking. An unrefined oil for which no chemicals or heat is used when
 extracting oil from the fruit. It maintains the purity and taste of the olive, though production standards are not
 as rigid as for other oils. It is considered a “commodity” that satisfies the basic needs of buyers. VOO has a free
 acidity, expressed as oleic acid, of not more than 2 % (2 grams in 100 grams) and the other characteristics of
 which correspond to those fixed for this category in this standard. It is derived from virgin oil production only it
 has good taste although inferior to extra-virgin olive oil.
 Extra Virgin Olive Oil: EVOO is high-quality olive oil and the highest internationally recognized standard. It is
 commonly used for seasoning. Because of the way the oil is made, it retains more authentic olive taste and has
 a lower level of oleic acid (not more than 0.8 grams per 100gr) than other olive oil varieties. It also contains more
 of the natural vitamins and minerals found in olives. It is considered an unrefined oil because it is not treated
 with chemicals or altered by temperature. It is derived from virgin oil production and from first pressing only
 and has superior flavor.
 Gourmet/premium olive oil: “Gourmet” olive oil is not only Extra virgin but also a highly-differentiated product,
 with strong value added, few surrogates, and high entry barriers. Quality is subjective as it is based on buyers
 and experts’ opinions when assessing the oil. Differentiation aspects refer to sensory experiences, production
 processes, uniqueness of treatment, packaging. Consumers and buyers of this product are more demanding than
 for the other olive oils. Production is more complex because attention is paid on quality control.

13 | P a g e
You can also read