Comparative Economics of Carbon Capture into Alternative Dispositions, Routes, and End Products - NREL
←
→
Page content transcription
If your browser does not render page correctly, please read the page content below
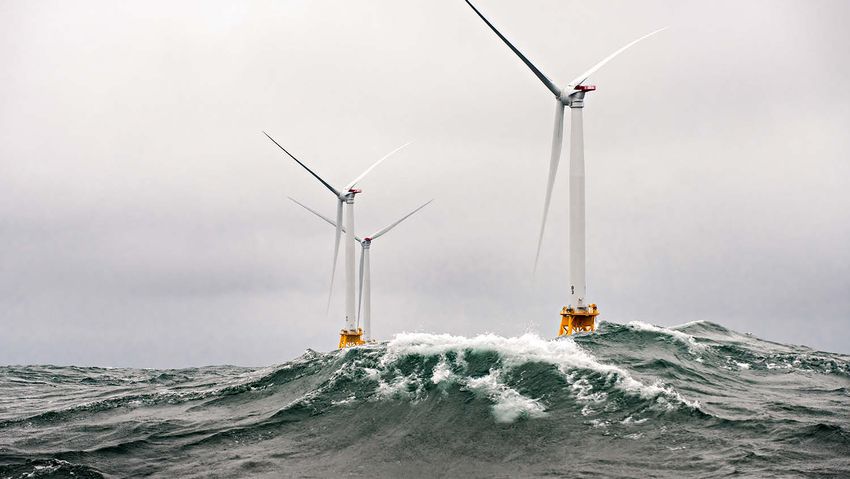
Comparative Economics of Carbon Capture into
Alternative Dispositions, Routes, and End Products
New Technologies & Economics for Carbon Capture/Sequestration Conference
Chapel Hill, North Carolina
March 29, 2019

                                  Thomas D. Foust, Director, Bioenergy Center,
                                  National Renewable Energy Laboratory (NREL)
                                  Professor, Mechanical Engineering, Colorado
                                  State University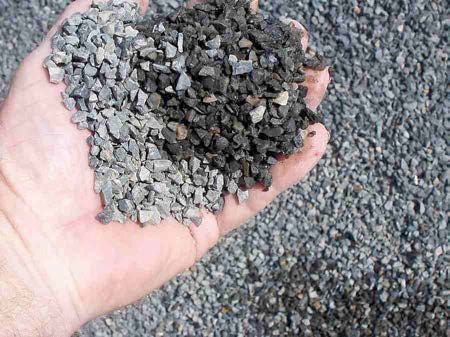
Outline

1 Motivation for CO2 Utilization
2 State of CO2 Utilization
3 Markets, State of Markets, and Potential
4 Conclusions and Potentials by 2030

                                             NREL | 2
Why CO2 Utilization

•   Carbon capture and sequestration will always be added cost and not driven
    by market factors. Carbon capture and utilization could be driven by market
    factors and provide market opportunities for lowering carbon dioxide (CO2)
    emissions.
•   Technologies which use CO2 (pure or as emitted) for revenue generation:
     – Using it unchanged like enhanced oil recovery (EOR), carbonated drinks,
        supercritical CO2 solvent, etc.
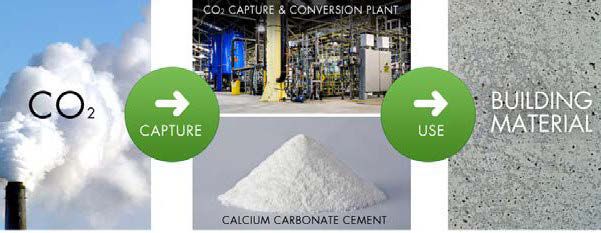
     – Converting it into a value-added end product like a building material
        (concrete), fuel, or chemical

                                                                                  NREL | 3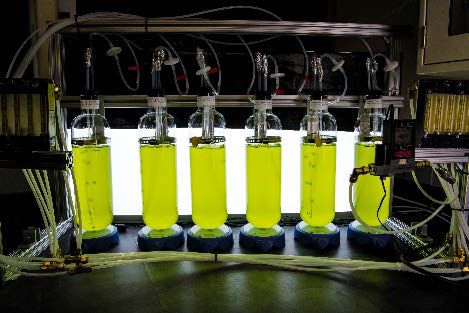
State of CO2 Utilization
State of CO2
        Utilization

•   Global consumption of
    CO2 was 206 million
    metric tons in 2017 of
    which 29 million metric
    tons (14%) entered            The global CO2 market size was valued at USD 6.0 billion in 2015
    merchant market in liquid    and is expected to grow at a compound annual growth rate (CAGR)
                                 of 3.7% over the next nine years. Development in EOR technology
    or solid form.
                                   mostly in North America and the Middle East. African region is
•   Remaining 177 million                            anticipated to drive growth.
    metric tons consumed
    captively in gaseous form,
    mainly for production of     •   2018 worldwide CO2 emissions = 37 billion metric tons
    urea (nitrogen fertilizer)   •   Current usage rate ~0.5% of total emissions
    or EOR.
                                                                                             NREL | 5
CO2 Sources: Quality, Cost, and Suppliers
                  CO2 Content         CO2 Emission           Primary         Capture Cost                 2018 U.S. CO2 Suppliers and Market Share
   Source
                    (vol%)              Intensity           Impurities      ($/tonne CO2)                                           Production
                                                                            $0–$5 – minor            Supplier                        Capacity         % of Total
Corn Mill          Near 100%       3.1 kg/gal ethanol           n/a           drying and                                              (MTD)
                                                                              purification           Linde                             9,172             24.9
                                                                                                     Air Liquide                       6,724             18.2
                                                                            $0–$5 – minor
Natural            Near 100%                n/a                 n/a                                  Praxair                           5,874             15.9
                                                                               cleanup
                                                                                                     Matheson                          3,379             9.2
                                     0.6–1.2 kg/m3                                                   Reliant Holdings                  2,617             7.1
Biogas             35%–65 %                                  CH4, H2S          $20–$75
                                         biogas                                                      POET Biorefining                  1,043             7.1
                                    499 kg CO2/MWh                                                   CF Industries                      880              2.4
Fossil Fuel-
                                       (NG plant)           N2, water,                               Sandhill                           635              1.7
Fired Power         3%–20%                                                     $20–$90
                                    960 kg CO2/MWh          O2, SOX, Ar                              Rentech Energy                     590              1.6
Plants
                                      (Coal plant)                                                   AES Corp.                          354              1.0
                                                                                                     Abengoa Bioenergy                  345              1.0
Air Capture           0.04%                 n/a             N2, O2, Ar       $100–$1,000
                                                                                                     ADM                                318              0.9

    vol% = volume percent | $/tonne CO2 = U.S. dollars per tonne of CO2 | kg/gal = kilogram per gallon | kg/m3 = kilograms per cubic meter | CH4 = methane |
    H2S = hydrogen sulfide | MWh = megawatt hour | N2 = nitrogen | O2 = oxygen | SOX = sulfur oxide | Ar = argon | MTD = ???
                                                                                                                                                          NREL | 6
Markets, State of
Markets, and Potentials
Existing and Potential
          Uses of CO2

•   Non-Reductive: Use CO2 in liquid or
    gaseous form
     – ~ 100% of current use
•   Reductive: Use renewable or nuclear
    low cost, no carbon electricity to
    reduce CO2 to a reactive intermediate
    for fuel, chemical, or material
    production:
     – Very limited commercial practice

                                            Illustration by ???   NREL | 8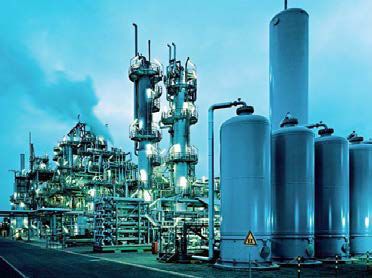
Six Potential Markets

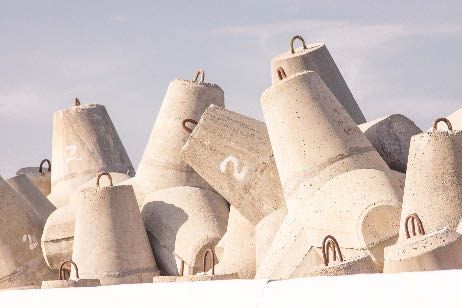
1. Building Materials – Non-Reductive
  •    Thermodynamically easy to make carbonates, less energy necessary. Makes     Photo from Stanislav Kondratiev, Unsplash
       market attractive for developers as technology is more readily scalable.
  •    Main two CO2U technologies used in this market are mineralization to
       carbonate aggregates and the use of CO2 to cure concrete
2. Chemical Intermediates – Reductive
  •    Many research projects to make conversions more efficient, e.g., by
       developing more efficient catalysts
  •    Niche markets have been commercialized, e.g., production of methanol               Photo by Elevate, Unsplash
       using geothermal energy in Iceland
  •    Methanol, syngas, and formic acid are widely being developed
3. Fuels – Reductive
  •    Production of fuels from CO2 fits within the large macro trend to produce
       low carbon fuels such as bio-based fuels
  •    Fuels are often mentioned as the largest potential market for CO2U
       technology in reports on CO2U                                                 Photo from Juan Fernandez, Unsplash
                                                                                                                               NREL | 9
Six Potential Markets

4. Polymers – Reductive
                                                                            Photo from Iker Urteaga, Unsplash
  •    Several production routes have already been commercialized for
       high value products for niche markets, such as
       polyhydroxyalkanoates and polycarbonates
5. Algae – Non-Reductive
  •    Enhance the growth rate and production rate of algae by adding
       gaseous CO2 technology to grow algae for bio-fuels and chemicals
6. Novel Materials – Reductive                                            Photo by Dennis Schroeder, NREL 55029

  •    Very high value materials such as carbon fiber
  •    Technology area is mostly at early research stage with some
       interesting results reported in the scientific literature

                                                                           Photo from Samuel Zeller, Unsplash     NREL | 10
Ranking Developers by Technology Readiness Level (TRL) Reveals
Maturity and Momentum in Specific Target Markets
Building
Materials
Chemical
Intermediates
Example
Polymers companies from
database to
Fuels illustrate range of
commercial
readiness.
Algae
Novel Materials for
Utilization
Stage of Development (TRL)
1 3 5 7 9 >93
Source: Lux Research. “Global Roadmap Study of CO2U Technologies.” Distributed by the Global CO2 Initiative, University of Michigan, Nov. 2018. NREL | 11Which Markets Offer the Best Opportunities for Support and Investment Source: Lux Research, University of Michigan NREL | 12
Developers of CO2U Technology by Market
                       Building                                                                                             Chemical
                       Materials                                                                                         Intermediates

                         Fuels                                                                                              Polymers

Source: Lux Research. “Global Roadmap Study of CO2U Technologies.” Distributed by the Global CO2 Initiative, University of Michigan, Nov. 2018.
                                                                                                                                          13      NREL | 13
The Number of Developers between Europe and North America
Is Comparable with Slight Differences in Market Focus
Number of
Number of % TRL 5 or
Market Developers in % TRL 5 or Lower
Developers in EU Lower
North America
Building Materials 6 50% 10 60%
Chemical Intermediates 18 77% 25 92%
Fuels 7 86% 10 70%
Polymers 9 67% 4 25%
Total 37 73% 48 75%
• Most developments in CO2U technology are early stage (equal or lower than TRL 5) with approximately 85 key
active developers in the Europe and North America
• For both continents, a key area of research is in chemical intermediates focusing on CO2 conversion to methanol,
CO, syngas, or formic acid
• Developers in building materials are especially strong in North America, whereas Europe is stronger in CO2
conversion to polymers. The latter is partially caused by the culture of collaboration in the European Union (EU).
Source: Lux Research. “Global Roadmap Study of CO2U Technologies.” Distributed by the Global CO2 Initiative, University of Michigan, Nov. 2018. NREL | 14Progress that Companies Have Made
in CO2U from 2011 to 2016
Example: Lux Innovation Grid 2011
Weighting for Visualization:
High potential Ahead of the pack
• Y-axis – Technology Score: 20% intellectual property (IP) strength,
10% regulatory factors, 30% competitive landscape score, 40%
Technology Score
technology value
• X-axis – Commercial Development Score: 60% technology
maturity, 25% developer maturity, 15% commercial maturity
Long-shot Undistinguished
• Bubble size – CO2 Mitigation Potential: 30% ease of set-up, 50%
market size, 20% extent that CO2 is used as feedstock Commercial Development Score
Example: Lux Innovation Grid 2016
Lux compared status of developers in High potential Ahead of the pack
2011 and 2016: Active
Technology Score
• Color coded the developers in the graph Pivot
for 2011 based on situation in 2016 Discontinued
Idle or unknown
• Color in the 2016 graph notes the
market segment Long-shot Undistinguished
Commercial Development Score
15 NREL | 15
Source: Lux Research. “Global Roadmap Study of CO2U Technologies.” Distributed by the Global CO2 Initiative, University of Michigan, Nov. 2018.Building Materials – Non-Reductive
Building Materials: Progress during the Last Five Years
Has Been Significant, Immediate Opportunities
2011 2016
5 5
High potential Ahead of the pack High potential Ahead of the pack
CarbonCure
Technologies
Novacem Alcoa Calera Solidia
Calera Technologies
CO2 Upcycling Terra CO 2 Calix Limited
Technology Score
Calix Limited
Technology Score
Carbon Sense Technologies
Solutions New Sky Energy
Solidia
Technologies Carbon8
3 3
CarbonCure New Sky Energy Blue Planet Aggregates
Control Alt Innovation
Technologies
Concepts
Delete Climate Recoval Belgium
CO 2 Solutions Carbstone
Change
Innovation
Cambridge
Carbon Capture Carbicrete Mineral
Carbonation
Wells Products International
The C2B Project
Group
Long-shot Undistinguished Long-shot Undistinguished
1 1
1 3 5 1 3 5
Commercial Development Score Commercial Development Score
Status in 2016 Active
Concrete curing
Pivot
Carbonates
Discontinued
Idle or unknown 28
Source: Lux Research. “Global Roadmap Study of CO2U Technologies.” Distributed by the Global CO2 Initiative, University of Michigan, Nov. 2018. NREL | 17Curing of Concrete by CO2 Is an
Immediate Opportunity
Concentration of Developers:
• High number of developers are near commercialization; whereas we have observed a relatively low
number of early stage developers
• The success of commercialization for building materials is linked to:
– Relatively low amount of energy required for carbonation
– Concrete made by curing with CO2 has better performance characteristics (20% improvement in
compressive strength) than traditional curing methods
Dynamics:
• Several developers have moved from pilot to commercialization stage from 2011–2016 for both
market segments:
– Note that several early-stage developers disappeared as they were not able to develop a product
beyond pilot stage
– We have found several new developers of mineralization to produce aggregates
Building materials can have a significant impact on CO2 emissions with additional allocated resources.
Source: Lux Research. “Global Roadmap Study of CO2U Technologies.” Distributed by the Global CO2 Initiative, University of Michigan, Nov. 2018.
29 NREL | 18Case Study to Sequester CO2 Using CO2U
Technology with No CAPEX for Users
Market
• CarbonCure Technologies in Canada is a developer of a CO2 injection
technology for concrete curing
• Made technology available for both pre-cast and ready-mix concrete markets
• CarbonCure uses an equipment leasing model:
– Eliminates capital expenditure (CAPEX) for its customers
– Charges customer on a per cubic meter (m³) of produced concrete
• Improves compressive strength of Portland cement concrete by 10%–20%:
– Can reduce cement demand by 5-10% and water demand by 30–60
liters per m³ concrete
• Technology was spun out of McGill University by Founder/CEO Robert Niven
• Timeline from founding to revenue generation was 6 years
CarbonCure Technologies commercialized CO2U in six years by (i) utilizing
a licensing and leasing model to eliminate CAPEX for its customers (ii)
using CO2 injection technology developed at a university.
Source: Lux Research. “Global Roadmap Study of CO2U Technologies.” Distributed by the Global CO2 Initiative, University of Michigan, Nov. 2018. NREL | 19Chemical Intermediates, Fuels, and Polymers – Reductive
Convergence of Trends Makes Reductive
Paths to CO2 Utilization Possible
Increasing Deployment and Decreasing Growing Need and Opportunity for
Costs of Renewable Electricity Utilizing Gaseous Carbon Waste Streams
2011 2010
2012
2010
2016 2011
2013 2012
2013
2015 2013
2010 2016 2014
2015
2012 2016
2020 2020 2017
2020
2010 Government, NGO, Industry, Academia, NAS
Fossil Fuel Cost Range 2015
2020
Ethanol Fermentation
C6H12O6 2C2H5OH + 2CO2
IRENA, Renewable Power Generation Costs in 2017
Future Levelized Costs: $0.02– 216 Existing U.S. Biorefineries Emit
$0.07/ kilowatt (kWh) 45 million tons (Mt) of CO2/year*
Opportunity: Improve Biorefinery Carbon Utilization
NREL | 21
*D. Sanchez, et al., “Near-term deployment of carbon capture and sequestration from biorefineries in the United States.” PNAS 115 (2018) 4875.Publications on the Conversion of CO2 by Catalytic
Reduction Has Increased Significantly
Top 10 Institutes by Number of Publications Number of Publications on
Catalysis for CO2 Reduction
Number of
Institute
Publications
800
U.S Department of Energy (DOE) 136
Chinese Academy of Sciences 79 600 Is this translating
Japan Science Technology Agency 63 to increased
400 commercialization?
Centre National de la Recherche
63
Scientifique 200
University of California San Diego 55
0
Tokyo Institute of Technology 52
Princeton University 47
Search on Web of Science using search string:
University of California Berkeley 38 TS=(((CO2 NEAR/2 reduct*) OR ((carbon ADJ
dioxide) NEAR/2 reduct*)) AND (*cataly*))
California Institute of Technology 38 Time Span: 2005-2015
Source: Lux Research. “Global Roadmap Study of CO2U Technologies.” Distributed by the Global CO2 Initiative, University of Michigan, Nov. 2018. NREL | 22General Assumptions
Assumption
Parameter Justification and Reference
SOT Target Theoretical
Polymer Electrolyte Membrane Scalable solution to reach high current density. Industrial
Electrolyzer Style
(PEM) Architecture validation/data (OPUS12, Dioxide Materials).
SOT value depends on each product. Target values from
Current Density (mA/cm2) SOT* 1,500 2,000
hydrogen analysis (H2A)/PEM assumptions.
Theoretical Both SOT and theoretical values depend on product. Target
Cell Voltage (V) SOT* Theoretical
+ 0.6V value +600mV cell overpotential on theoretical.
Faradaic Efficiency (%) SOT* 95% 100% SOT value depends on product. Target=SOT if SOT FE>95%.
H2A assumptions $900, $400, and $200/kW + SOT current
Installed Capital Cost ($/m2) 22,000 10,000 5,000
density / cell voltage.
Single-Pass CO2 Conversion Rarely reported. 20% from 2018 Haas et al. (Siemens). 90% from
20% 90% 100%
(%) 2018 Luc et al.
U.S. Energy Information Administration (EIA) electricity price
Electricity Price ($/kWh) 0.068 0.03 0.02
(sensitivity: $0-$0.068 $/kWh).
Carbon Capture and Storage (CCS)-CO2 capture from power
CO2 Capture Price ($/ton) 40 20 0
plants, first-of-a-kind (FOAK) bioethanol.
CO2 Flowrate (kg/hr) 71,729 Estimated CO2 from annual 200 million gallons of ethanol.
CO2 Separations Cost $50–$80 / tonne CO2 IHS Process Economics Program (PEP).
SOT* is the actual SOT value for each product based on published literature. NREL | 23Target Subsidies for Products Greater than 2 Electrons
Number of Target FE Target Cell Target CD Target MSP Market Required CO2 Subsidy
Electrons (%) Voltage (V) (mA/cm2) ($/kg) Price ($/kg) to Reach Parity ($/MT)
CO 2 98 1.93 1,500 0.22 0.23 $0
Formic Acid 2 98 2.08 1,500 0.25 0.63 $0
Oxalic Acid 2 95 2.30 1,500 0.44 1.73 $0
Ethylene 12 95 1.82 1,500 1.15 0.57 $150
Ethanol 12 95 1.74 1,500 0.70 0.51 $70
Methane 8 95 1.66 1,500 1.24 0.22 $340
Methanol 6 95 1.80 1,500 0.52 0.40 $65
• Products requiring > 2 electrons not economically competitive even under best-case target conditions
• In absence of positive market forces and in addition to achieving target conditions, policy/subsidy drivers will
be required in the range of $65–$340 per MT CO2 depending on each product
• Currently, Low Carbon Fuel Standard (LCFS) credits in California are trading at ~$180 per MT CO2, and the
federal tax (45Q) credit provides $50/MT for CO2 stored geologically, and $35/MT for CO2 stored permanently
via enhanced oil recovery. (Source: California Air Resources Board)
FE = ??? | CD = ??? | MSP = minimum selling price | MT = ??? NREL | 24Chemical Intermediates: Limited Progress Due to
Lack of Incentives and Economic Feasibility
2011 2016
5 5
High potential Ahead of the pack High potential Ahead of the pack
Carbon Mitsui
GoNano Electrocatalytic Chemicals
Mitsui Chemical Recycling Dioxide
Novus Energy Materials
Toronto
Liquid Light Mantra Energy Opus 12 NCF Carbon
Oakbio
Technology Score
Technology score
Carbon Vito Recycling
Recycling International
3 3 Photanol
Dioxide International Haldor Topsoe
Materials Bioamber
Haldor Topsoe Ceramatec
C4X Mantra Energy
Bioamber
Ceramatec Antecy
SINTEF Hago Energetics
Easel Ingenuity Lab Succinity
Cambridge RES Kaidi
Carbon Capture
BSE
Long-shot Undistinguished Long-shot Engineering Undistinguished
1 1
1 3 5 1 3 5
Commercial Development Score Commercial Development Score
Status in 2016 Active
Pivot
Discontinued
Idle or unknown
30
Source: Lux Research. “Global Roadmap Study of CO2U Technologies.” Distributed by the Global CO2 Initiative, University of Michigan, Nov. 2018. NREL | 25Chemical Intermediates that Can Also Be
Used as Fuels Offer the Best Opportunity
Concentration of Developers:
• Low number of developers near commercialization; high number of early stage developers
• Highest number of developers for three market segments: carbon monoxide (syngas), oxalic acid, and formic
acid:
– Reduction reactions involved for these three are less complicated than others
– These chemicals can be used as intermediates, but also as fuels or precursors to fuels
– Fuels from CO2 have been incentivized/funded by governments to lower carbon emissions, this has not been
the case for chemicals
Dynamics:
• Very few developers moved from pilot to commercialization stage for all market segments
• Number of start-ups has increased dramatically; investigating solutions for energy-efficient conversions of CO2
– Most start-ups tend to focus on catalysis and conversions by reduction as there is an unmet need for
conversions that require low energy
The methanol, syngas and formic acid market segments are shown separately in the following pages.
Source: Lux Research. “Global Roadmap Study of CO2U Technologies.” Distributed by the Global CO2 Initiative, University of Michigan, Nov. 2018.
31 NREL | 26Liquid Fuels: Several Developers Have Made
Significant Steps Toward Commercialization
2011 2016
5 5
High potential Ahead of the pack High potential Ahead of the pack
Carbon LanzaTech
Recycling
MitsuiChemical International
CarbonSciences
LanzaTech
Photanol Sunfire
Carbon SOLAR-JET
Technology Score
Technology Score
MitsuiChemical
JouleUnlimited Sunfire Recycling InnosenseLLC
3 International 3 CleanCarbon
AlgenolBiotech Energy
Corporation Catalytic JouleUnlimited
Photanol Innovations
DEUTZAG C4X Antecy
Antecy
Breathe PioneerEnergy
CO2toMethanol
Long-shot Undistinguished Long-shot BSE Engineering Undistinguished
1 1
1 3 5 1 3 5
Commercial DevelopmentScore Commercial DevelopmentScore
Status in 2016 Active Discontinued
Pivot Idle or unknown
Source: Lux Research. “Global Roadmap Study of CO2U Technologies.” Distributed by the Global CO2 Initiative, University of Michigan, Nov. 2018.
39 NREL | 27Liquid Fuel Is Still at the Early Stages
in Terms of Being Economical
Concentration of Developers:
• Four developers near commercialization or have commercialized CO2U; LanzaTech is able to produce in scale
– Note that LanzaTech converts carbon monoxide (CO) into ethanol, hence the low impact on CO2
mitigation score
– Methanol from CO2 is closest to production in scale
Dynamics:
• Development has been relatively fast for this market due to available funding for projects and mandates set
by government for renewable fuels:
– Stage of development went from pilot testing in lab in 2011 to pilot testing at commercial scale in 2016
– Focus of developments has been on integrating CO2 capture, renewable energy supply, hydrogen
generation, and CO2 conversion in the case of methanol and on efficient (multi-step) conversion of CO2
into fuels in the case of other liquid fuels.
– Note that Europe is leading as it has set targets to create a low carbon-emission mobility economy
– Diesel and jet fuels are better targets than gasoline
The significant progress made during the last 5 years shows that the technology is available to be developed to produce at scale.
Source: Lux Research. “Global Roadmap Study of CO2U Technologies.” Distributed by the Global CO2 Initiative, University of Michigan, Nov. 2018.
40 NREL | 28Case Study on New Technology: From Concept
to Full-Scale Production: LanzaTech
• LanzaTech: Developer of ethanol production from CO via anaerobic microbes Market
• Began research based off a microbe purchased in 2005, but it proved too
environmentally sensitive
• Combined selective evolution and recombinant technology to produce a more
suitable microbe, and their founder’s previous experience in bioprocesses
allowed a successful bioreactor design in under 2 years
• LanzaTech develops proprietary microbe strains to convert waste gases
containing CO and H2 into chemical intermediates and fuels:
– Ethanol production from steel mill gas
– Alcohol to jet fuel process at pilot stage in a partnership with Virgin
Atlantic, who started test flights in 2017
• Process requires minimal treatment of waste gas before feeding it to
microbes, reducing cost
• Timeline from founding to commercial operation was 8 years with over $200
million in grants and funding
LanzaTech was able to commercialize their biofuel production from CO by fermentation in 9 years by (i)
development of differentiated technology and (ii) multiple successful rounds of funding.
Source: Lux Research. “Global Roadmap Study of CO2U Technologies.” Distributed by the Global CO2 Initiative, University of Michigan, Nov. 2018. NREL | 29Methane: Significant Progress in Europe during
Last 5 Years Due to Funding of Projects
Status in 2016 Active Discontinued
Pivot Idle or unknown
3
7
Source: Lux Research. “Global Roadmap Study of CO2U Technologies.” Distributed by the Global CO2 Initiative, University of Michigan, Nov. 2018. NREL | 30Polymers: Limited Number of Corporations Investing
in CO2 Mitigation Due to Lack of Incentives
Source: Lux Research. “Global Roadmap Study of CO2U Technologies.” Distributed by the Global CO2 Initiative, University of Michigan, Nov. 2018. NREL | 31Polymers from CO2 Shown to Be
Possible, Currently Not Economical
Concentration of Developers:
• Five developers are near commercialization; few early stage developers:
– Several companies have shown that polymers from CO2 can be produced in scale
• Most companies have focused on polycarbonates and polyols (polyols are used to produce polyurethane).
This allows for replacing technology that uses dangerous phosgene gas.
– Some developers are corporations (Covestro and Asahi Kasei) that have used know-how in catalysis to develop
commercial pilot plants for polymers from CO2
• Production capacity is a small fraction (Conclusions and Potential by 2030
CO2U Product’s
   Mitigation
  Potential in
  Tonnes CO2
   Captured

Source: Lux Research. “Global Roadmap Study of CO2U Technologies.” Distributed by the Global CO2 Initiative, University of Michigan, Nov. 2018.   NREL | 34
CO2U Product’s
    Market Potential

Source: Lux Research. “Global Roadmap Study of CO2U Technologies.” Distributed by the Global CO2 Initiative, University of Michigan, Nov. 2018.   NREL | 35
Conclusions: CO2U Offers Opportunities to Mitigate
CO2 Emissions Driven by Market Factors
• CO2 mitigation is important to decrease the risks associated with carbon emissions. Carbon capture and
utilization (CO2U) can make an important impact on these efforts.
– Carbon capture and storage (CCS) remains an added cost, whereas CO2U utilizes CO2 to produce
materials, fuels, or chemicals
• Significant progress has been made in CO2U during last 5 years, with many technologies shown to be scalable:
– Momentum is in favor for four markets:
1. Construction materials
2. Fuels
3. Chemical intermediates
4. Polymers
– Funding and incentives are necessary to move toward full-scale capabilities
• Aggressive technology development and favorable policies for CO2U open up access to markets valued at
$700 billion.
– CO2U has the potential to utilize 7 billion tonnes of CO2 (~ 30 fold increase from 2018 CO2U levels)
per year by 2030. This is equivalent to approximately 15% of current global CO2 emissions.
Source: Lux Research. “Global Roadmap Study of CO2U Technologies.” Distributed by the Global CO2 Initiative, University of Michigan, Nov. 2018. NREL | 36Q&A
www.nrel.gov
NREL/PR-5100-73573
This work was authored by the National Renewable Energy Laboratory, operated by Alliance for Sustainable Energy,
LLC, for the U.S. Department of Energy (DOE) under Contract No. DE-AC36-08GO28308. Funding provided by the
U.S. Department of Energy Office of Energy Efficiency and Renewable Energy Bioenergy Technologies Office. The
views expressed in the article do not necessarily represent the views of the DOE or the U.S. Government. The U.S.
Government retains and the publisher, by accepting the article for publication, acknowledges that the U.S.
Government retains a nonexclusive, paid-up, irrevocable, worldwide license to publish or reproduce the published
form of this work, or allow others to do so, for U.S. Government purposes.Back-Up Slides
NREL | 38Scenarios Allow for Estimation of Timelines
for Significant Market Penetration
Market Market Market
Market penetration penetration penetration
Market introduction (Pessimistic) (Optimistic) (Best case) Main assumption for barrier
Concrete 2014 pre-2020 pre-2020 pre-2020 No technology barriers
Aggregates 2012 pre-2030 pre-2030 pre-2025 Low-cost product that requires cost-competitive CO2U
Methanol 2011 pre-2030 pre-2025 pre-2020 Integration of carbon capture, CO2 conversion, and hydrogen supply at scale
Formic acid post-2016 post-2030 pre-2030 pre-2025 Research in CO2U technology to form formic acid is lagging
Syngas post-2016 pre-2030 pre-2025 pre-2025 Integration of carbon capture, CO2 conversion, and hydrogen supply at scale
Polymers 2002 pre-2030 pre-2025 pre-2025 Access to low-cost CO2
Methane 2013 post-2030 post-2030 post-2030 Low-cost product that requires cost-competitive CO2U
Liquid fuels post-2016 post-2030 pre-2030 pre-2025 Integration of carbon capture, CO2 conversion, and hydrogen supply at scale
• The markets are listed in order of initial market penetration of products made by CO2U as estimated by Lux Research
• Market introduction is defined as the first time production in scale occurred by CO2U. Note that introduction of polymers is
early due to development of polycarbonates from CO2 in 2002 by Asahi Kasei. Other developments for polymers from CO2 are
in the 2012–2016 time-frame.
• Threshold for time of penetration is achieving more than 2% market share; at this point we believe enough momentum has
occurred to drive adoption of technology
Source: Lux Research. “Global Roadmap Study of CO2U Technologies.” Distributed by the Global CO2 Initiative, University of Michigan, Nov. 2018. NREL | 39Market Drivers: Curing of Concrete Using CO2 Offers
Increase in Performance and CO2 Abatement
Concrete
Market:
• Current concrete curing processes use heat and steam
– Curing of concrete by CO2 injection, add-on to current processes
Curing of concrete by CO2 injection is driven by performance and cost:
• Curing of CO2 is partially driven by increasing performance and reducing cost
• No changes in codes and standards necessary
• CO2 emissions are high for production of concrete. It is a market that would also
be a source of CO2
– However, incentives to reduce CO2 emissions are low
• Funding was available for developers in the past; especially strong in the United
States and Canada. Several companies are in the commercialization stage.
• Concrete offers a solution for permanent CO2 storage CO2 curing would reduce
water usage Source: Carboncure
Source: Lux Research. “Global Roadmap Study of CO2U Technologies.” Distributed by the Global CO2 Initiative, University of Michigan, Nov. 2018. NREL | 40Market Drivers: Carbonate Aggregate Potential
for High Impact on CO2 Abatement
Carbonates Market: Aggregates
• Carbonate aggregates produced from CO2 can be used in concrete, asphalt, and
construction fill
• Conversion of CO2 into carbonates offers the potential to convert low-value
materials (such as solid wastes containing calcium oxide, slugs from steel plants,
or ash from municipal incinerators) into useful products.
• A drawback is that these materials have to be transported to the site where
carbonates are produced, thus increasing the price of CO2 derived carbonates
– Carbonate aggregates from CO2 compete with the current process of
mining carbonates from quarries.
Drivers:
• CO2 emissions are high for production of concrete. It is a market that would also
be a source of CO2
– However, incentives to reduce CO2 emissions are low
• Funding in the past for developers; especially strong in the United States and
Canada. Several companies are in the commercialization stage Source: Calera
• Concrete and others offer a solution for permanent CO2 storage
Source: Lux Research. “Global Roadmap Study of CO2U Technologies.” Distributed by the Global CO2 Initiative, University of Michigan, Nov. 2018. NREL | 41Market Drivers: Conversion of CO2 to Methanol Driven
by Desire for Fuels from Renewable Sources
Largest demand for total methanol market is in chemicals: Methanol
• Formaldehyde (30%) followed by methyl tert-butyl ether, acetic acid and
dimethyl ether
• Methanol to olefins is an emerging sector
• Use as a fuel blend is becoming more popular and will further drive up demand
in the future
Methanol from CO2 is currently only cost competitive in special scenarios:
• Funding for ‘renewable’ methanol is tied to production of energy from
renewable sources
• Limited by the cost of hydrogen, usually produced by the electrolysis of water Source: Methanex
– To produce cheap hydrogen, electricity source must be inexpensive
(e.g., hydrothermal source in Iceland, wind in Germany)
• Policies and regulations for CO2 mitigation could help reduce costs
– Driven by reduction of carbon emissions as set by COP21 in Paris
• Major hurdles for the renewable methanol market are the current high
production costs and low production volumes
Source: Lux Research. “Global Roadmap Study of CO2U Technologies.” Distributed by the Global CO2 Initiative, University of Michigan, Nov. 2018. NREL | 42Market Drivers: Syngas Is Versatile as a Chemical Intermediate,
Making It Suitable for Current Studies on CO2 Conversion
Syngas market: Syngas
• The syngas (CO + H2) market is growing with a CAGR at 8%, although relatively
small in size currently:
– Use of syngas is versatile, more reactive than e.g., methanol
• Syngas can be used to make liquid fuels (by Fischer-Tropsch reaction) as well as
chemical intermediates (e.g., methanol)
• Syngas is also used for power generation. However, this is not applicable to Source: SyngasChem
CO2 conversion as CO2U will not be able to compete with other methods to
generate power.
Developers of CO2 conversion choose syngas as it can be used to produce a
range of chemicals and fuels:
• More versatile as an add-on to a current industrial plant, production of syngas
allows developers to produce fuels or chemical intermediates down stream:
– For example, the technology can be used for an add-on to steel plants
to decrease carbon emissions
• No direct incentives for companies to use renewable sources to produce
syngas currently
• Renewable alternatives include generation of syngas from biomass
Source: Lux Research. “Global Roadmap Study of CO2U Technologies.” Distributed by the Global CO2 Initiative, University of Michigan, Nov. 2018. NREL | 43Market Drivers: Polymers from CO2 Dominated
by Polycarbonates and Polyols
Market: Polymers
• Fewer developers as compared to the other three markets:
– Focus on production of polycarbonates and polyols from CO2
– Research into other types of polymers is more fragmented
• Mainly large companies involved in the development of polymers:
– Partially due to access to know-how and production facilities
Reduction of CO2 emissions at chemical and material plants:
• Funding in place in Europe for companies to explore possibilities of using
CO2 as a feedstock
• Reduction of CO2 emissions at the industrial plant:
– Note that often CO2 is not the only source of carbon, thereby
limiting the impact of CO2 mitigation
• Exploration of alternative feedstocks:
– Use of CO2 as a feedstock made during production of other
Source: Empower Materials
chemicals/polymers
• Currently, the thermo-catalytic process is not cost-competitive due to cost
of process and cost of CO2
Source: Lux Research. “Global Roadmap Study of CO2U Technologies.” Distributed by the Global CO2 Initiative, University of Michigan, Nov. 2018. NREL | 44Market Drivers: Methane from CO2
Competes with Low-Price Natural Gas
Market: Methane
• Methane is produced from resources such as shale gas, tight gas, and
coalbeds:
Natural gas production
– Most natural gas production is expected to come from shale gas in trillion cubic feet
• Bio-methane from renewable sources is being investigated to reduce CO2
emissions:
– Methane from CO2 conversion will compete with bio-methane, both
can be introduced in the net as substituted natural gas
Drivers:
• Funding in Europe for co-electrolysis of CO2 and water is ongoing as several
countries have high alternative energy capacities such as hydro-electric or
wind power
• Funding to lower carbon emissions, Europe is ahead of the pack
– Consortiums set up in Europe involving members of the value chain
(universities, energy supplier, CO2 supplier, converter, and user)
• Shale gas is replacing coal burning plants in the United States; thereby
reducing carbon emissions and reducing the drive for reduction of CO2
emissions in countries such as the United States. Source: Audi-egas
Source: Lux Research. “Global Roadmap Study of CO2U Technologies Distributed by the Global CO2 Initiative, University of Michigan, Nov. 2018 NREL | 45Market Drivers: Mandates for Renewable Fuels
Offer Opportunities for Liquid Fuels from CO2
Market: Liquid Fuels
• Liquid fuel market consists of gasoline, diesel, and kerosene
• This market also includes fuel additives such as methanol and ethanol
• Biofuel segment from renewable sources such as sugar cane has been growing
due to funding and incentives
– Fuels from CO2 conversion has a negligible market share currently
Drivers:
• Funding is in place for renewable fuels to lower carbon emissions, Europe is
ahead of the pack
• Europe has a mandate to have 10% of fuels from renewable sources by 2021:
– Source of energy would have to be renewable
• Consortiums set up in Europe involving members of the value chain Source: Lux Research
(universities, energy supplier, CO2 supplier, converter and user)
• Note that fuels from CO2 conversion target the same market as biofuels from
bio-based feedstocks
– Global market share of bio-fuels has increased to 4% in 2015
Slide 80
Source: Lux Research. “Global Roadmap Study of CO2U Technologies Distributed by the Global CO2 Initiative, University of Michigan, Nov. 2018 NREL | 46General Techno-Economic Analysis (TEA) Methodology
Process Model
Equipment Sizing/Costing
and Raw Material Minimum Selling
Accounting Price (MSP)
Feedstock Composition
Operating Conditions Flow Rates Cost $
Conversion Yields
Product Yield kg or million
Approach: Btu (Mbtu)
• Design conceptual process include all major steps, core conversion, CO2 recycle, product purification, etc.
• Analyze and report three cost numbers: SOT, target, and theoretical conditions
o SOT: Major assumptions and technical metrics based on published results in the open literature
o Target: Technical metrics based on attainable process improvements (engineering judgement)
o Theoretical: Technical metrics based on thermodynamic limitations
• Calculate minimum selling price (MSP) using discounted cash-flow rate of return on investment, equity payback, taxes, and
2016 U.S. dollars
• Perform comparative analysis for various conversion pathways and same product from different pathways
• Perform inclusive sensitivity analysis:
o Identify key cost drivers
o Research and development and policy needs to realize economic advantage of a product over existing market value
NREL | 47You can also read


