Comparison of BLOCPLAN and CORELAP algorithm for Material Handling Improvement at M Bakery
←
→
Page content transcription
If your browser does not render page correctly, please read the page content below
IOP Conference Series: Materials Science and Engineering

PAPER • OPEN ACCESS

Comparison of BLOCPLAN and CORELAP algorithm for Material
Handling Improvement at M Bakery
To cite this article: Raihan Dara Lufika et al 2021 IOP Conf. Ser.: Mater. Sci. Eng. 1082 012006

View the article online for updates and enhancements.

                               This content was downloaded from IP address 46.4.80.155 on 20/09/2021 at 07:29
2nd ICECME 2020                                                                                                          IOP Publishing
IOP Conf. Series: Materials Science and Engineering              1082 (2021) 012006           doi:10.1088/1757-899X/1082/1/012006

Comparison of BLOCPLAN and CORELAP algorithm for
Material Handling Improvement at M Bakery

                     Raihan Dara Lufika1, Prima Denny Sentia1, Irfan Maulana1
                     1
                      Industrial Engineering Department, Universitas Syiah Kuala, Darussalam, Banda
                     Aceh, Indonesia

                     E-mail: primadennysentia@unsyiah.ac.id

                     Abstract. It is essential to have a suitable and effective layout design on a production floor. M
                     Bakery is one of the bread industries that has been established since 2010. The core problem in
                     the case study object is the far distance of the material handling movement. One solution to this
                     problem is to improve the layout of facilities in the production area. The study will compare
                     two different algorithms which are BLOCPLAN and CORELAP and choose the best one
                     between these algorithms. The total movement moment of the current layout is 379,932
                     meters/year and OMH is IDR 1,215,712/year. The results of the BLOCPLAN based layout are
                     the total movement moment of 263,767 meters/year, OMH of IDR 1,054,201/year, and an
                     efficiency rate of 30.57%. While the results of the CORELAP based layout are the total
                     movement moment of 418,710 meters/year, OMH of IDR 1,477,648/year, and an efficiency
                     rate of -10.21%. From the comparison of the result of the two algorithms, the chosen proposed
                     layout design is the BLOCPLAN based layout which has the highest efficiency rate of 30.57%.

1. Introduction
Facility design is one of the core aspects of a successful manufacturing process. The production cost is
closely related to the facility design layout. The concept of facility planning successfully decreases the
operation fee [1]. The characteristics of an ideal layout for material handling are topmost flexibility,
coordination, volume utilisation, visibility, accessibility, and minimum distance [2]. There is no
perfect layout. However, in some cases, the productivity rate increase significantly after the layout
redesign. In one research, there is half distance left of travel route with the new layout [3]. While on
other research, the change of the layout can reduce 55% of total movement and more than 7,000,000
IDR of material handling cost [4].
     The facility layout issues remain as one of the growing field areas of research. There is a rise in
the number of publications in the topics of facility layout optimisation [5]. This shows that there is a
necessity to solve the problem regarding this issue in the real world. One research shows that the
ineffective layout design can lead to profit loss due to the total material handling fee [6]. The issues
are related to the increase of product demand, the shifting of market direction, the fluctuation of
production fee, and many more. Therefore, the facility design should also reflect on the possibility of
future expansion [7]. The other research discusses designing a layout that is considered the human
factor for adjusting the Industrial Revolution 4.0 trend [8].
     There are several methodologies to solve the problem about facility layout design including
mathematical methods, CORELAP, Systematic Layout Plan (SLP), BLOCPLAN, Graph-Based
Theory, and many more [5]. It is essential to choose which methodologies to solve the problem. The
              Content from this work may be used under the terms of the Creative Commons Attribution 3.0 licence. Any further distribution
              of this work must maintain attribution to the author(s) and the title of the work, journal citation and DOI.
Published under licence by IOP Publishing Ltd                          1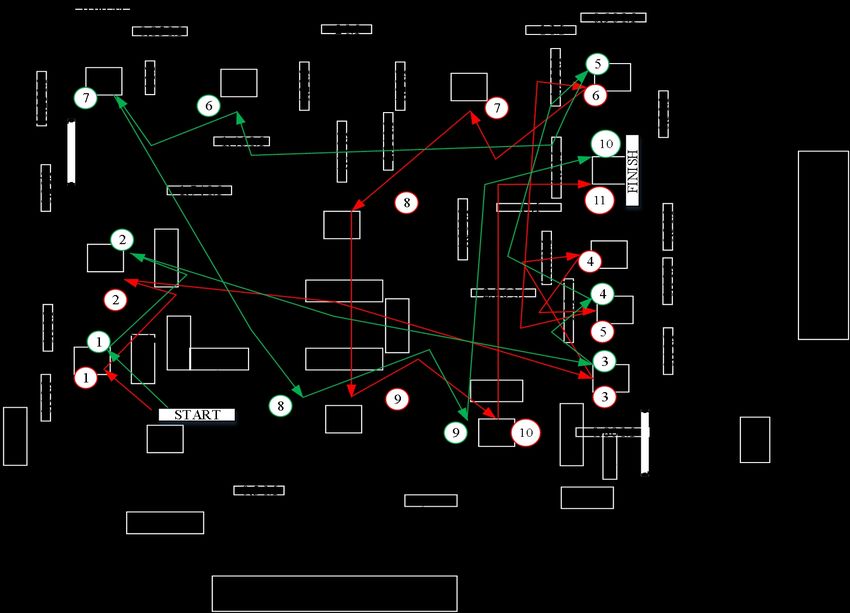
2nd ICECME 2020                                                                                 IOP Publishing
IOP Conf. Series: Materials Science and Engineering   1082 (2021) 012006   doi:10.1088/1757-899X/1082/1/012006

BLOCPLAN algorithm has successfully reduced the distance between facilities and the total material
handling cost [9]. Then, CORELAP which has a similar concept aims to minimise the total
displacement distance and material handling fee [10].
     One of the problem in the M Bakery is the far distance despite the busy movement between the
half-finished product storage and the final product storage. The other problem is the unbalance space
between one aisle to another aisle between facilities. Furthermore, there are three types of product
which two of them shares the same production process while the other one share a different one. This
study aims to examine the current layout in the M Bakery and choosing the best layout
recommendation between one using BLOCPLAN or the other one using CORELAP.

2. Methodology
2.1. Data Collection
This step is to collect the primary and secondary data for the research. The primary data is including
the current layout and the workstation distance, the production floor space, the frequency of movement,
the proximity level, and the production movement time. The secondary data are the production
capacity, the facility number, and the employee salary fee.

2.2. Data Processing
There are fifteen processes including,
1. Current layout design
2. Calculation of distance between facilities based on the current layout
3. Calculation of the total movement moment based on the current layout
4. Calculation of total material handling cost based on the current layout
5. Activity Relationship Chart (ARC) design
6. Software BLOCPLAN 90 running
7. Block Layout design based on the Software BLOCPLAN 90 result
8. Calculation of distance between facilities based on the Software BLOCPLAN 90 result
9. Calculation of the total movement moment based on the Software BLOCPLAN 90 result
10. Calculation of total material handling cost based on the Software BLOCPLAN 90 result
11. Software CORELAP 01 running
12. Block Layout design based on the Software CORELAP 01 result
13. Calculation of distance between facilities based on the Software CORELAP 01 result
14. Calculation of the total movement moment based on the Software CORELAP 01 result
15. Calculation of total material handling cost based on the Software CORELAP 01 result

     The aim of the comparison between the two results of the algorithm is to find the best result
regarding the minimum distance between facilities and the minimum material handling cost. Then the
layout design of the best result will be the suggestion for the company for their improvement.

3. Results and discussion
3.1. Current layout design and calculation
Figure 1 shows the current layout. The layout design refers to the observation during the production
process in M Bakery’s production floor. Then the design used as the reference for the calculation of
the distance between facilities, total distance moment, and total material handling cost (table 1).

                                                         2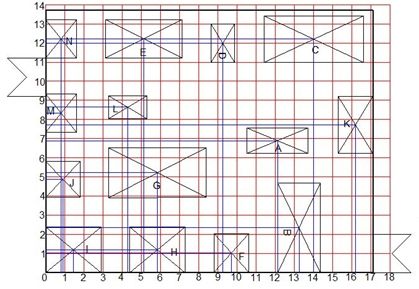
2nd ICECME 2020                                                                                                  IOP Publishing
   IOP Conf. Series: Materials Science and Engineering                    1082 (2021) 012006   doi:10.1088/1757-899X/1082/1/012006

                         Legends:
                         A              = Half-finished product storage
                         B              = Packaging table
                         C              = Raw material storage
                         D              = Dough scale table
                         E              = Dough mixing machine
                         F              = Cooling table II
                         G              = Cooling table I
                         H              = Oven machine I
                         I              = Oven machine II
                         J              = Dough rising area
                         K              = Finished product storage
                         L              = Rolling machine
                         M              = Dough moulding table
                         N              = Dough cutting table

                         Colour:
                         1. Red = Production line bread A and B
                         2. Green = Production line bread C
                         .

                                                   Figure 1. Current layout design.

   Tabel 1. Calculation of distance between facilities, total distance moment, and total material handling cost
                                           based on current layout.
                                                                Distance        Total
      Start      End                       Movement                                                      Total
N                                                               Between      Movement OMH/
     Work- Work-             Worker        Frequency/                                                    OMH/
o                                                            Facilities dij   Moment/        Meter
     station station                      Year (times)                                                    year
                                                                   (m)      Year (times)
1       C          D                          12,045              0.21          2,529         8.55       21,622
                           Nanda
2       D          E                          12,045              1.79          21,561        8.55      184,346
3       E          N       Riki, Herman       12,045              5.65          68,054        2.94      200,078
4       N          L       Zami               9,490               2.00          18,980        3.35       63,583
5       N         M        Riki and           1,825               1.20          2,190         2.94       6,438
6       L         M        Herman             6,570               0.80          5,256         2.94       15,452
7       M          J       Zami               8,395               3.72          31,229        3.35      104,617
8       J          H                          2,190               5.75          12,593        5.73       72,157
                           Roji
9       J          I                          7,300               2.30          16,790        5.73       96,206
10      I          G       Tama               10,950              4.15          45,443        3.30      149,961
11      G          B       Riki, Herman       10,950              3.06          33,507        2.94       98,510
12      H          F       Tama               2,920               1.92          5,606         3.30       18,499
13      F          B       Riki, Herman       2,920               1.84          5,373         2.94       15,796
14      B          A                          13,870              2.03          28,156        1.52       42,797
                           Fahmi
15      A          K                          13,870              5.96          82,665        1.52      125,650
               TOTAL                         127,385              42.38        379,932       59.60     1,215,712

                                                                             3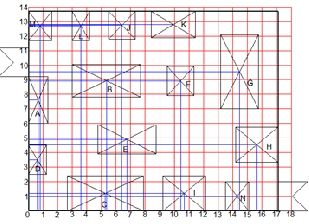
2nd ICECME 2020 IOP Publishing
IOP Conf. Series: Materials Science and Engineering 1082 (2021) 012006 doi:10.1088/1757-899X/1082/1/012006
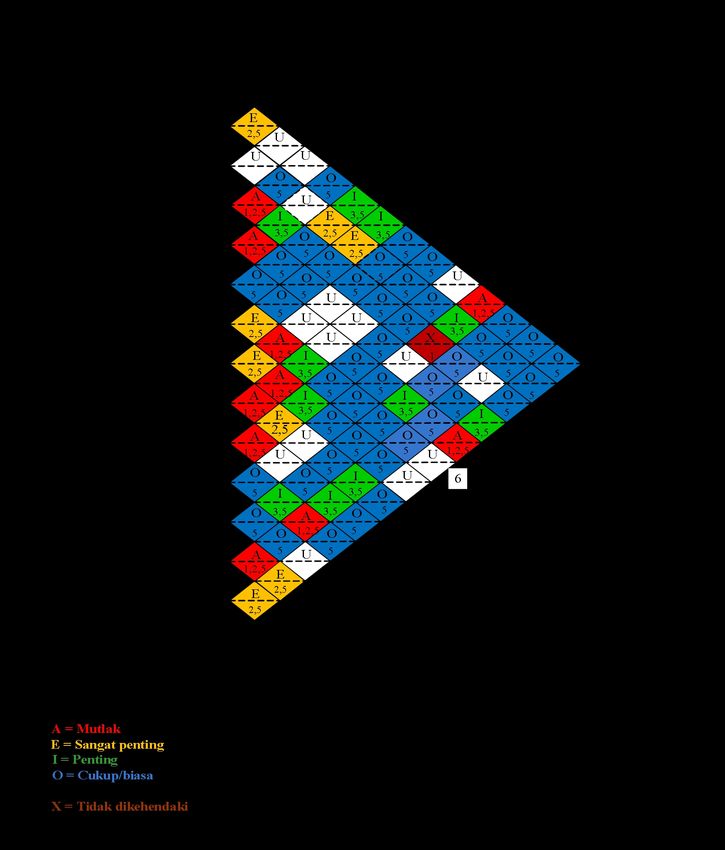
3.2. Activity Relationship Chart (ARC) design
The aim of designing the Activity Relationship Chart (ARC) is to connect activity in pair for
understanding the relationship between activities in the production floor of M Bakery. The symbols of
each relationship between facilities are A, E, I, O, U, and X with the reason for close or far distance at
each facility.
Figure 2. Activity Relation Chart(ARC).
3.3. BLOCPLAN layout design and calculation
For running the BLOCPLAN 90 software, the input data are the total floor space and Activity
Relationship Chart (ARC). The result of twenty iterations for looking at the highest r-score is layout
number 9 with the score of 0,76.
Figure 3. BLOCPLAN result (left) and block layout (right).
4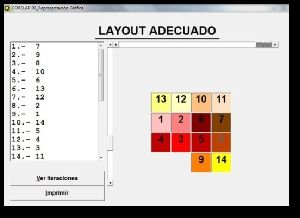
2nd ICECME 2020                                                                                      IOP Publishing
IOP Conf. Series: Materials Science and Engineering   1082 (2021) 012006       doi:10.1088/1757-899X/1082/1/012006

 Tabel 2. Calculation of distance between facilities, total distance moment, and total material handling cost based on
                                                 BLOCPLAN result.
                                                                Distance        Total
      Start       End                       Movement                                                            Total
                                                                Between       Movement
No Work- Work-                Worker       Frequency/                                        OMH/Meter         OMH/
                                                              Facilities dij  Moment/
     station station                       Year (times)                                                          year
                                                                   (m)       Year (times
 1      C          D                          12,045               2.47         29,751            8.55         254,372
                           Nanda
 2      D           E                         12,045               1.97         23,729            8.55         202,880
 3      E          N       Riki, Herman       12,045               2.16         26,017            2.94          76,490
 4      N           L      Zami                9,490               0.02           190             3.35            636
 5      N          M       Riki and            1,825               1.93          3,522            2.94          10,355
 6      L          M       Herman              6,570               1.91         12,549            2.94          36,893
 7      M           J      Zami                8,395               1.68         14,104            3.35          47,247
 8       J         H                           2,190               0.75          1,642            5.73           9,411
                           Roji
 9       J          I                          7,300               1.57         11,461            5.73          65,671
10       I         G       Tama               10,950               4.21         46,100            3.30         152,128
11      G          B       Riki, Herman       10,950               2.26         24,747            2.94          72,756
12      H           F      Tama                2,920               1.73          5,051            3.30          16,670
13      F          B       Riki, Herman        2,920               2.42          7,066            2.94          20,775
14      B          A                          13,870               0.01           139             1.52            211
                           Fahmi
15      A          K                          13,870               4.16         57,699            1.52          87,703
               TOTAL                         127,385              29.25        263,767           59.60       1,054,201

       Table two shows that the calculation of total material handling based on BLOCPLAN per year
is 1,054,201 IDR. The farthest distance is the distance of half-finished product storage (A) to the final
product storage (K) which is 57,699 meters/year. Meanwhile, the highest material handling cost per
year is for the activity from the raw material area (C) to dough scaling table (D) which is IDR 254,372
OMH/year.

3.4. CORELAP layout design and calculation
The CORELAP layout designing process is including the layout drawing, coordinate point
determination, the distance between facilities determination, total movement moment calculation, and
total material handling cost calculation. There is only one result from the CORELAP 01 software
which based on the value of Total Closeness Rating (TCR). That one result is the core data for thirteen
iterations to determine which facilities should be the first one laying in the production floor.

                          Figure 4. CORELAP result (left) and block layout (right).

                                                         5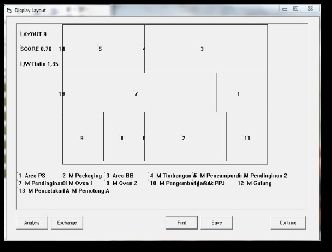
2nd ICECME 2020                                                                                     IOP Publishing
IOP Conf. Series: Materials Science and Engineering   1082 (2021) 012006      doi:10.1088/1757-899X/1082/1/012006

Tabel 3. Calculation of distance between facilities, total distance moment, and total material handling cost based
                                             on CORELAP result.
                                                                             Total
                                                              Distance
     Start       End                       Movement                      Movement                          Total
                                                              Between
No Work- Work-               Worker       Frequency/                      Moment/        OMH/Meter        OMH/
                                                              Facilities
    station station                       Year (times)                       Year                           year
                                                               dij (m)
                                                                            (times)
 1     C           D                         12,045              1.18        14,213           8.55        121,522
                          Nanda
 2     D           E                         12,045              3.78        45,530           8.55        389,282
                          Riki,
 3     E           N                         12,045              1.81        21,801           2.94         64,096
                          Herman
 4     N           L      Zami                9,490              0.50         4,745           3.35         15,896
 5     N          M       Riki and            1,825              0.90         1,643           2.94         4,829
 6     L          M       Herman              6,570              1.40         9,198           2.94         27,042
 7     M           J      Zami                8,395              2.82        23,674           3.35         79,307
 8      J          H                          2,190              0.53         1,161           5.73         6,651
                          Roji
 9      J          I                          7,300              3.63        26,499           5.73        151,839
10      I          G      Tama               10,950              6.06        66,357           3.30        281,978
                          Riki,
11     G           B                         10,950              4.86        53,217           2.94        156,458
                          Herman
12     H           F      Tama                2,920              0.43         1,256           3.30         4,143
                          Riki,
13      F          B                          2,920              2.53         7,388           2.94         21,719
                          Herman
14     B           A                         13,870              3.01        41,749           1.52         63,458
                          Fahmi
15     A           K                         13,870              7.23       100,280           1.52        152,425
              TOTAL                         127,385             40.67       418,710          59.60       1,477,648

      Table 3 shows that the total material handling cost per year is IDR 1.477.648. The farthest
distance is the distance of half-finished product storage (A) to the final product storage (K) which is
100,280 meters/year. Meanwhile, the highest material handling cost per year is for the activity from
dough scaling table (D) to dough mixing machine (E) which is IDR 389,282 OMH/year.

3.5. Comparison between BLOCPLAN and CORELAP
Table 4 shows the comparison between the current layout, BLOCPLAN based layout, and CORELAP
based layout. The total movement moment of BLOCPLAN algorithm and the total material handling
cost is 263.767 times/year and 1.054.201 OMH/year respectively. Therefore, the efficiency rate for
this algorithm is 30.57% than the current layout. Meanwhile, the total movement moment of
CORELAP algorithm is 418.710 times/year and the total material handling cost is 1.477.648
OMH/year. Therefore, the efficiency rate for this algorithm is -10.21% than the current layout.

           Table 4. Comparison of current layout, BLOCPLAN based layout, and CORELAP
                                             based layout.
                                             Total Movement        Total      Efficiency
           No          Layout
                                               Moment/year      OMH/year         Rate
           1 Current layout                       379,932       1,215,712          -
               BLOCPLAN based
           2                                      263,767       1,054,201      30,57%
               layout
           3 CORELAP based layout                 418,710       1,477,648      -10,21%

                                                         6
2nd ICECME 2020 IOP Publishing
IOP Conf. Series: Materials Science and Engineering 1082 (2021) 012006 doi:10.1088/1757-899X/1082/1/012006
The main reason for the large gap between the two algorithms is because of the high rectilinear
distance between the half-finished product storage to the finished product storage of CORELAP
algorithm compare to others. The other reason is the result of CORELAP algorithm shows that there is
an inefficiency process flow where there is a back and forth movement in the area of packaging table
and cooling table two. This inefficiency may disturb the whole production process which can lead to
longer production time and higher material handling cost.
4. Summary
Based on the comparison between the two algorithms, the best-proposed layout improvement is the
BLOCPLAN based layout. That is because the calculation shows that the layout proposed a minimum
total movement moment, a minimum total material handling fee, and the highest efficiency rate than
the CORELAP based layout. It is highly possible for the M Bakery to applies the modification to the
production floor because all facilities is a moveable machine, tables, and storages.
5. References
[1] Kovacs G, and Kot S, 2017, Facility Layout Redesign for Efficiency Imrpovement and Cost
Reduction, Journal of Apllied Mathematics and Computational Mechanics, 63-74
[2] Shanthpure M, and Shivakumar M R, 2017, Designing Facility layout and effective material
handling for a ceramic insulator plant, International Research Journal of Engineering and
Technology, 1675-1678
[3] Nyati V, Jaybhaye M D, and Sardar V, 2017, Optimization of Facility Layout for Imrpovement in
Productivity, Conference: 4th International Conference on Industrial Engineering (ICIE
2017)
[4] Puspita I A, Iqbal M, Pratami D, and Pratomo A, 2015, Production Facility Layout Design Using
Blocplan Algorithm, American Scientific Publishers: Advanced Science Letters, 1-5
[5] Kikolski M, and Ko C H, 2018, Facility Layout Design - Review of Current Research Direction,
Engineering Management in Production and Services, 70-79
[6] Lekan O K, Kayode O I, and Morenikeji A A, 2017, Analysis of Plant Layout Design for
Operational Efficiency with Craft Algorithms, Acta Universitas Danubius Economica, 15-27
[7] Kadane S M, and Bhatwadekar S, 2011, Manufacturing Facility Layout Design and Optimization
Using Simulation, International Journal of Advanced Manufacturing System, 59-65
[8] Li J, Tan X, And Li J, 2018, Reserach on Dynamic Facility Layout Problem of Manufacturing
Unit Considering Human Factors, Hindawi Mathematical Problem in Engineering, 1-13
[9] Setiawati L, Noviyarsi, and Wulandari R, 2012, Perbaikan Tata Letak Fasilitas Produksi Dengan
Menggunakan Algoritma Blocplan (Production Facility Layout Improvement using the
BLOCPLAN Algorithm), Jurnal Teknik Industri - Universitas Bung Hatta, 206-216
[10] Rajesh M, Naidu N V R, and Kumar P N, 2016, Plant Layout Optimization of Oven
Manufacturing Unit Using CORELAP Algorithm, International Journal of Research in
Engineering and Technology, 67-71
7You can also read