Comparison of Chemical Constituents in Pseudostellariae Radix with Different Dosage Forms Based on HPLC-Q-Exactive Orbitrap/MS Combined with ...

Page created by Annie Dominguez
 
CONTINUE READING
Comparison of Chemical Constituents in Pseudostellariae Radix with Different Dosage Forms Based on HPLC-Q-Exactive Orbitrap/MS Combined with ...
Hindawi
Evidence-Based Complementary and Alternative Medicine
Volume 2021, Article ID 6644127, 10 pages
https://doi.org/10.1155/2021/6644127

Research Article
Comparison of Chemical Constituents in Pseudostellariae
Radix with Different Dosage Forms Based on HPLC-Q-Exactive
Orbitrap/MS Combined with Multivariate Statistical Analysis

          Yujiao Hua , Xiaoyuan Liu , and Fen Xie
          Department of Clinical Pharmacy, Affiliated Hospital of Jiangnan University, Wuxi 214000, China

          Correspondence should be addressed to Fen Xie; 303991002@qq.com

          Received 15 December 2020; Revised 6 April 2021; Accepted 27 April 2021; Published 10 May 2021

          Academic Editor: Amir Syahir

          Copyright © 2021 Yujiao Hua et al. This is an open access article distributed under the Creative Commons Attribution License,
          which permits unrestricted use, distribution, and reproduction in any medium, provided the original work is properly cited.
          Background. Pseudostellariae Radix (PR) is an important traditional Chinese herbal medicine with vast clinical consumptions,
          which has two different dosage forms, PR decoction pieces and PR formula granules. However, these two forms are bound to have
          an impact on the accumulation of the effective components in PR, so the effectiveness of clinical use cannot be guaranteed.
          Objective. To determine the effective composition of PR. Methods. In this research, PR decoction pieces and formula granules were
          collected, and their composition was detected by HPLC-Q-Exactive Orbitrap/MS; multivariate statistical analysis was used to
          distinguish differential metabolites between PR decoction pieces and formula granules. Results. A clear cut difference in the
          composition of the two groups was observed. 98 differential chemical constituents could be identified in the positive mode, while
          52 differential chemical compositions could be identified in the negative mode. The differential chemical compositions were
          mainly concentrated in flavonoids, organic acids, fatty acids, and amino acids and present different change rules, mainly involved
          in the isoquinoline alkaloid biosynthesis metabolic pathways. Conclusions. This study provides basic information to reveal the
          influence law of different dosage forms on the metabolite synthesis and quality formation mechanism of PR.

1. Introduction                                                        a potent drug with high traditional following. On the other
                                                                       hand, the advantages of PR formula granules lie in small
Pseudostellariae Radix (PR) is an arid tuberous root of                package, multiple varieties, and multiple specifications, and
P. heterophylla (Miq.) Pax ex Pax et Hoffm [1]. It is a kind of         the relevant parameters of drugs are clearly marked, which is
important traditional Chinese herbal medicine which has                conducive to the identification and selection of medicinal
the functions of promoting immunity, relieving cough,                  materials by patients; also, the formula granules are easy for
antitumor, antioxidation, and protecting myocardial func-              patients to take home [10, 11].
tion [2]. This herbal medicine is used wildly for its positive             The different dosage forms are bound to have an impact
effects. It is reported that PR can be used for inappetence [3],        on the accumulation of its effective constituents, so the
thirst [4], debility [5], diabetes [6], and weakness after illness     effectiveness of clinical use cannot be guaranteed, and the
[7]. Currently, PR decoction pieces and formula granules are           active components of these two dosage forms have not been
utilized in a Chinese hospital; among them, PR formula                 studied in depth. In order to have a more comprehensive
granules is a novel form of decoction pieces, which is                 understanding on the synthesis and accumulation of me-
prepared by water extraction, concentration, drying, and               tabolites in PR with different dosage forms, as well as the
granulation of the PR decoction pieces [8, 9]. These two               difference in quality between PR decoction pieces and
types of PR used have their own advantages and disad-                  formula granules, it is necessary to build a quality analysis
vantages. One of the advantages of PR decoction pieces                 method for the overall chemical constituents of PR with
being that it has been prescribed since thousands of years as          different dosage forms.
Comparison of Chemical Constituents in Pseudostellariae Radix with Different Dosage Forms Based on HPLC-Q-Exactive Orbitrap/MS Combined with ...
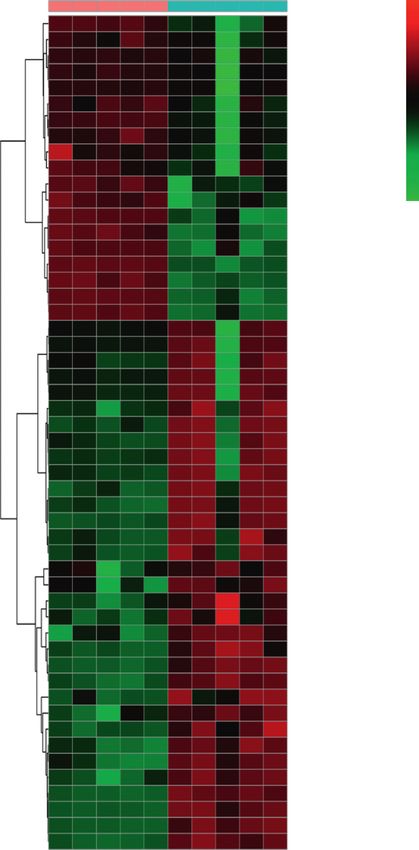
2                                                               Evidence-Based Complementary and Alternative Medicine

    Metabolomics technology is a new omics technology          PR decoction pieces and formula granules were pulverized
developed in the mid-1990s, among which plant metab-           into homogeneous powders (80 mesh). Powder samples
olomics is a high-throughput, unbiased, and comprehensive      (0.1 g) were accurately weighed out and transferred to a
analysis technology for metabolomics in plant extracts, and    25 mL conical flask equipped with a stopper. Then, samples
it is especially fit for the analysis of multicomponent         were applied to extraction procedure, extracted with 800 μL
complex systems of TCM [12–14]. In recent years, liquid-       of methanol and 10 μL of internal standard (2.8 mg/mL, DL-
mass coupling technology is widely used in the qualitative     o-chlorophenylalanine). All samples were grinded to fine
and quantitative research of complex TCM systems [15, 16],     powder using a grinding mill at 65 Hz for 90 s, and then, they
and the commonly used mass spectrometry techniques             were ultrasonicated for 30 min, by 40 KHz and let stand for 1
include quadrupole mass spectrometry, ion trap mass            hour at −20°C. The samples were centrifuged at 12000 rpm
spectrometry, time-of-flight mass spectrometry, and com-        and 4°C for 15 min, and the supernatants were filtered
pound tandem mass spectrometry [17–20]. The structure of       through a 0.22 μm membrane before injection into the
the compounds can be rapidly identified based on the            HPLC system.
fragmentation information of the multistage mass spec-
trometry compounds and related database. Liquid phase
                                                               2.4. HPLC-Q-Exactive Orbitrap/MS Conditions. The HPLC
with high efficiency and rapid separation performance
                                                               analysis was performed on the Ultimate 3000 HPLC system
combined with sensitive and accurate mass spectrometry is
                                                               (Thermo, Waltham, MA, USA). A hyper gold C18 column
one of the most promising metabolomics technologies and
                                                               (100 mm × 2.1 mm × 1.9 μm) (Thermo, Waltham, MA, USA)
has been widely used in the analysis of polar compounds,
                                                               was used to carry out the chromatographic separation at
thermal unstable compounds, and macromolecular
                                                               40°C. The mobile phase consisted of eluent A (water + 5%
compounds.
                                                               acetonitrile + 0.1% formic acid, v/v) and eluent B
    In this study, an accurate and reliable method based on
                                                               (acetonitrile + 0.1% formic acid, v/v) with a flow rate of
HPLC-Q-Exactive Orbitrap/MS coupled with multivariate
                                                               0.35 mL/min with a liner gradient program: 100%–80% A
statistical analysis and signal pathway analysis has been
                                                               from 0 to 1.5 min, 80%–0% A from 1.5 to 9.5 min, 0% A from
developed to analyze the differential chemical compositions
                                                               9.5 to 14.5 min, 0%–100% A from 14.5 to 14.6 min, and 100%
and major metabolic pathways in PR decoction pieces and
                                                               A from 14.6 to 18 min.
formula granules, exploring the dynamic change law of
                                                                   Mass spectrometry detection was performed on
different dosage forms of PR. It is expected to provide basic
                                                               Q-Exactive Orbitrap/MS (Thermo, Waltham, MA, USA)
data for revealing the influence of different dosage forms on
                                                               equipped with an electrospray ionization (ESI) source op-
the synthesis and accumulation of metabolites of PR and for
                                                               erating in the positive and negative ion modes. The scan
discussing the formation mechanism of the quality in PR
                                                               range was m/z 50–1000 and m/z 50–1100 in positive and
decoction pieces and formula granules.
                                                               negative ion modes, respectively. The optimized instru-
                                                               mental parameters were as follows: heater temperature was
2. Materials and Methods                                       300°C, sheath gas flow rate was 45 arb, Aux gas flow rate was
2.1. Chemicals and Reagents. Formic acid and acetonitrile of   15 arb, sweep gas flow rate was 1 arb, and capillary tem-
HPLC grade were purchased from Sigma-Aldrich (St. Louis,       perature was 350°C. The spray voltage was floating at 3.0 KV
MO, USA) and Merck (Darmstadt, Germany), respectively.         (ESI+) or 3.2 KV (ESI−). S-lens RF level was 30% (ESI+) or
Ultrapure water was prepared using a Milli-Q purifying         60% (ESI−).
system (Millipore, Bedford, MA, USA) under a resistivity of
18.2 MΩ/cm, and other reagent solutions such as methanol       2.5. Data Analysis. The data were performed feature ex-
and 2-chloro-L-phenylalanine were analytical grade (Merck,     traction and preprocessed with Compound Discoverer soft-
Darmstadt, Germany).                                           ware (Thermo, Waltham, MA, USA) and then normalized
                                                               and edited into a two-dimensional data matrix by Excel 2010
2.2. Plant Materials. Five PR decoction pieces were pur-       software (Redmond, WA, USA), including retention time
chased from Suzhou Tianling Chinese Herbal Medicine Co.        (RT), compound molecular weight (compMW), observations
Ltd., Jiangsu Province, China. Five PR formula granules        (samples), and peak intensity. The edited data matrix was
were purchased from Jiangyin Tianjiang Pharmaceutical Co.      imported into SIMCA-P 13.0 software (Umetrics, Umea,
Ltd., Jiangsu Province, China. The botanical origin of the     Sweden) for multivariate statistical analysis. Principal com-
materials was identified by Professor Xunhong Liu (De-          ponent analysis (PCA) was performed to intuitively express
partment for Authentication of Chinese Medicines, Nanjing      the difference in chemical compositions between PR decoc-
University of Chinese Medicine, China), and the voucher        tion pieces and PR formula granules by observing the ag-
specimens were deposited at TCM pharmacy of Affiliated           gregation of each sample. Partial least squares discriminant
Hospital of Jiangnan University.                               analysis (PLS-DA) and orthogonal least squares discriminant
                                                               analysis (OPLS-DA) were performed to further classify the
                                                               samples. Two parameters, R2Y and Q2, were used to evaluate
2.3. Sample Preparations. PR decoction pieces and PR           the model, the closer R2Y is to 1, the more stable the model is,
formula granules were naturally put at room temperature        and Q2 > 0.5 indicates a high prediction rate. Variable im-
prior to HPLC-Q-Exactive Orbitrap/MS analysis. The dried       portance in the projection (VIP) > 1 via OPLS-DA analysis
Comparison of Chemical Constituents in Pseudostellariae Radix with Different Dosage Forms Based on HPLC-Q-Exactive Orbitrap/MS Combined with ...
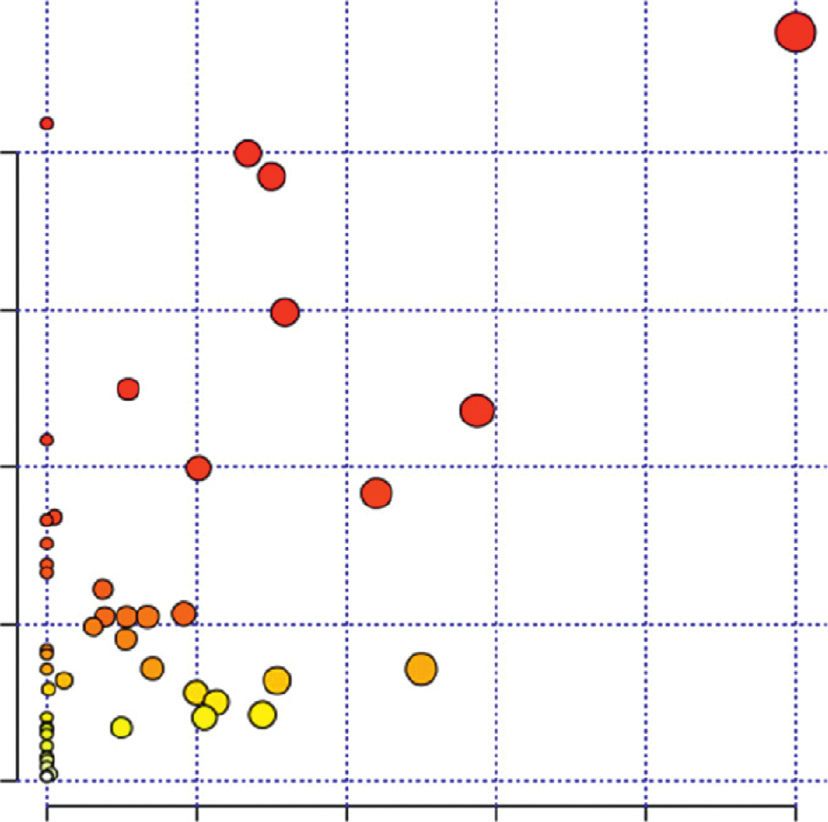
Evidence-Based Complementary and Alternative Medicine                                                                                                                                                                                                           3

                            RT: 0.00–18.00          ESI+                                                                                                    RT: 0.00–18.00            ESI–
                                                                                                                        16.31                                      0.88
                            100                                                                                                                             100
                             95                                                                                                                              95
                             90             2.78
                                                                                                                                                             90
                             85                                                                                                                              85
                             80                                                                                                                              80
                             75                                                                                                                              75       0.95
       Relative abundance

                                                                                                                                       Relative abundance
                             70 0.86                                                                                                                         70
                             65                                                                                                                              65
                             60                                                                                                                              60
                             55                                                                                                                              55
                             50                                                                                                                              50
                             45                                                                                           16.56                              45                3.10
                             40                                                                                                                              40
                             35                3.11
                                                 3.48
                                                                                              11.63                                                          35                          5.06
                             30                                                                                                                              30        1.15       3.47
                                                                                                                                                                                                                   10.55 10.69
                                                                                                                                                                                                                                               16.34
                             25                                                       10.09                                                                  25                             5.31               9.61                                16.47
                             20       1.15
                                                        5.08                7.88 8.63                                                                        20                                    7.99 9.12           11.28
                                                                                          10.89                  16.21                                                                4.71 5.58                           11.93 12.67
                             15                                      7.07          9.42
                                                                                                                                                             15            2.78
                                                                                                                                                                                                   7.62
                                                                                                                                                                                                                                  12.75
                             10                      4.71 5.32                                         13.25                                                 10                                                                             16.19
                                       1.34                                                                     16.03                                                     1.56                                                            14.90
                              5                                                                                                                               5
                              0                                                                                                                               0
                                 0        2         4        6               8     10             12       14       16            18                             0         2         4         6      8     10            12        14         16          18
                                                                            Time (min)                                                                                                               Time (min)

                                                                            (a)                                                                                                                      (b)
                            RT: 0.00–18.00           ESI+                                                                                                   RT: 0.00–18.00           ESI–
                                                                                                                    16.29                                          0.89
                            100                                                                                                                             100
                             95                                                                                                                              95
                             90                                                                                                                              90
                             85 0.87                                                                                                                         85
                             80                                                                                                                              80       0.98
                             75                                                                                                                              75
                             70                                                                                                                              70
       Relative abundance

                                                                                                                                       Relative abundance
                             65       1.16                                                                                                                   65
                             60                                                                                                                              60
                             55              2.78 3.09                                                                                                       55
                             50                                                                                                                              50       1.15
                                                  3.48
                             45                                                                                                                              45
                             40          2.72                                                                             16.49                              40               3.10
                             35                                                                                                                              35                         5.07
                                                                                              11.63
                             30                          5.06                                                                                                30                  3.47      5.32
                             25                                                                                                                              25                                                     11.27
                             20        1.28                                                                                                                  20                    3.97
                                        1.83        3.61                              10.09                     16.20                                                                                           10.57                           16.34
                             15                             5.31                                                                                             15            2.72              5.59
                                                              5.58   5.84 6.93     9.93                                                                                 1.39                  5.67                                                 16.43
                             10                                                                   12.45 12.59   16.06                                        10                                    7.10 7.20 10.10      11.64
                                                                                                                                                                                                                            12.25 13.08     16.26
                                                                                                                                                                                                                                                     16.78
                              5                                                                                                                               5
                              0                                                                                                                               0
                                 0        2          4          6            8     10             12       14       16            18                             0        2         4         6          8     10        12       14           16          18
                                                                            Time (min)                                                                                                                Time (min)

                                                                            (c)                                                                                                                      (d)

                            Figure 1: BPC of PR decoction pieces (a-b) and PR formula granules (c-d) in both positive and negative modes.

and the p value of the t-test (p < 0.05) were used to find                                                                              for this experiment. Different mobile phases (including
potential metabolites that significantly contributed to the                                                                             methanol-water, acetonitrile-water, methanol-0.1% formic
difference among the groups [21]. Biochemical databases,                                                                                acid water, acetonitrile-0.1% formic acid water, acetonitrile
METLIN (http://metlin.scripps.edu/), HMDB (http://www.                                                                                 with 0.1% formic acid water-acetonitrile with 0.1% formic
hmdb.ca/), KEGG (http://www.kegg.com/), and Metab-                                                                                     acid, and 5% acetonitrile with 0.1% formic acid water-ace-
oAnalyst (http://www.metaboanalyst.ca/), were used to                                                                                  tonitrile with 0.1% formic acid), flow rate (0.25, 0.35, and
identify potential metabolites. According to the data of                                                                               0.45 mL/min), and column temperature (35, 40, and 45°C)
MetaboAnalyst, the impact value threshold was set at 0.6, and                                                                          were examined and compared. As a result, a 5% acetonitrile
therefore, the most important potential metabolic pathways                                                                             with 0.1% formic acid water-acetonitrile with 0.1% formic
were filtered out [22].                                                                                                                 acid at a flow rate of 0.35 mL/min and a column temperature
                                                                                                                                       of 40°C was found satisfactory for separation of molecules in
                                                                                                                                       a short time.
3. Results and Discussion                                                                                                                  According to the set conditions of sample treatment,
                                                                                                                                       liquid chromatography and mass spectrometry were de-
3.1. Based Peak Chromatogram. The extraction conditions,
                                                                                                                                       termined. The based peak chromatogram (BPC) of PR de-
including extraction (ultrasonic and refluxing extraction),
                                                                                                                                       coction pieces and formula granules obtained from the
extraction solvent (100% methanol, 70% methanol, 50%
                                                                                                                                       analysis in both positive and negative modes is shown in
methanol, and 30% methanol), and extraction time (15, 30,
                                                                                                                                       Figure 1.
45, 60, and 75 min) were optimized to acquire the most
outstanding extraction efficiency. The results showed that
the chromatographic peak shape and relative peak area were
                                                                                                                                       3.2. Multivariate Statistical Analysis
superior to the others under ultrasonic extraction with 100%
methanol for 30 min.                                                                                                                   3.2.1. Principal Component Analysis. Based on LC-MS
    In order to gain fast effective analysis, a hyper gold C18                                                                          spectra, chemical classification of all samples was carried out
column (100 mm × 2.1 mm × 1.9 μm) column was employed                                                                                  by multivariate data analysis, which aims to evaluate the
Comparison of Chemical Constituents in Pseudostellariae Radix with Different Dosage Forms Based on HPLC-Q-Exactive Orbitrap/MS Combined with ...
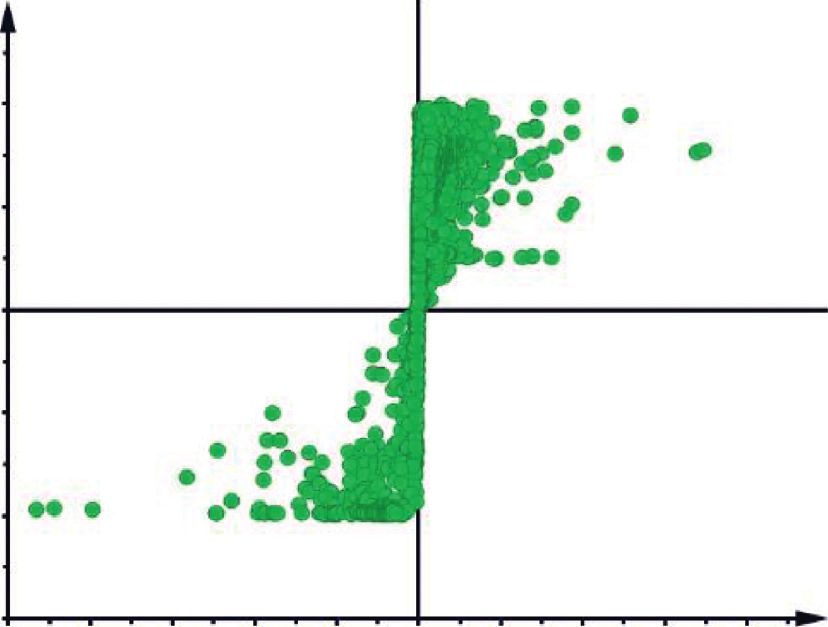
4                                                                                                 Evidence-Based Complementary and Alternative Medicine

              80                                                                                       80
              60                                                                                       60
              40                                                                                       40
              20                                                                                       20
                0                                                                                       0
     t (2)

                                                                                          t (2)
             –20                                                                                  –20
             –40                                                                                  –40
             –60                                                                                  –60
             –80                                                                   ESI+           –80                                                                      ESI–
             –100                                                                                 –100
                –150         –100       –50           0           50         100                     –150            –100       –50             0           50           100
                                                    t (1)                                                                                     t (1)

                         PR decoction pieces                                                                     PR decoction pieces
                         PR formula particles                                                                    PR formula particles
                                              (a)                                                                                       (b)

Figure 2: The scores plot obtained from PCA analysis of PR decoction pieces and formula granules. The scores plot of PCA revealed that the
10 samples were classified into two major groups in the positive mode (a) and negative mode (b).

                        80
                                                                                             0.8
                        60
                        40                                                                   0.6
                        20                                                                   0.4
               t (2)

                         0
                       –20                                                                   0.2
                       –40                                                                        0
                       –60
                                                                                           –0.2
                       –80                                                         ESI+                                                                            ESI+
                    –100                                                                   –0.4
                       –150      –100         –50            0         50     100                     0.1    0.2    0.3   0.4   0.5     0.6    0.7    0.8    0.9     1
                                                          t (1)                                             R2
                                                                                                            Q2
                              PR decoction pieces
                              PR formula particles
                                                    (a)                                                                           (b)

                                                                                                  1
                       100
                                                                                             0.8
                        50
                                                                                             0.6
               t (2)

                         0                                                                   0.4
                                                                                             0.2
                       –50
                                                                                                  0
                    –100
                                                                                           –0.2
                                                                                   ESI–                                                                            ESI–
                    –150                                                                   –0.4
                       –100 –80 –60 –40 –20                  0 20       40   60     80                0.1    0.2    0.3   0.4   0.5     0.6    0.7    0.8    0.9     1
                                                          t (1)
                                                                                                            R2
                              PR decoction pieces                                                           Q2
                              PR formula particles
                                                    (c)                                                                           (d)

Figure 3: PLS-DA scores plot and the permutation test with 200 permutations of PR decoction pieces and formula granules. The scores plot
of PLS-DA revealed that PR decoction pieces and PR formula granules could be clearly distinguished into two groups in the positive mode
(a) and negative mode (c). The permutation test with 200 permutations indicated that PLS-DA is effective and can be used for subsequent
differential component analysis in the positive mode (b) and negative mode (d).
Comparison of Chemical Constituents in Pseudostellariae Radix with Different Dosage Forms Based on HPLC-Q-Exactive Orbitrap/MS Combined with ...
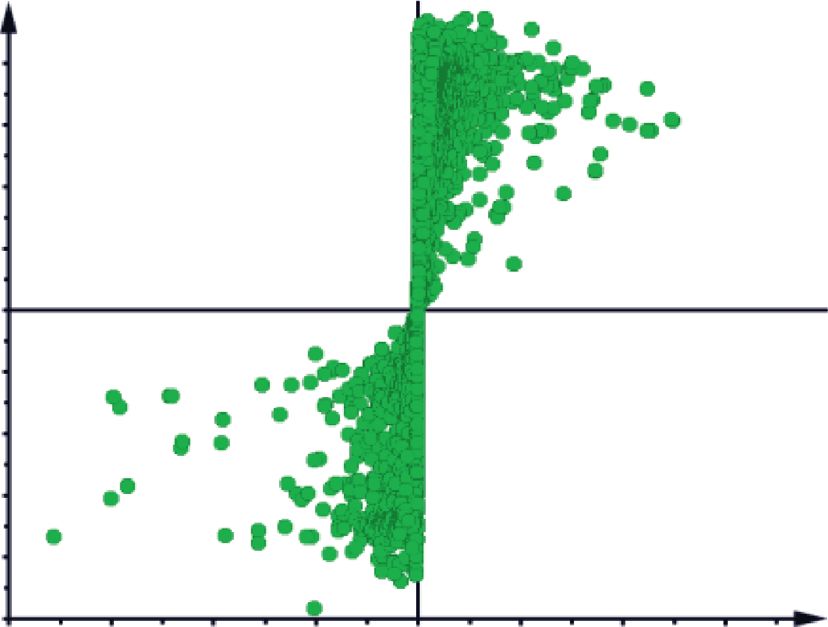
Evidence-Based Complementary and Alternative Medicine                                                                                                                          5

                               100                                                                                 100

                                50                                                                                  50
           1.14041 ∗ to (1)

                                                                                               1.02796 ∗ to (1)
                                 0                                                                                   0

                               –50                                                                                 –50

                          –100                                                                                    –100
                                                                                        ESI+                                                                            ESI–
                          –150                                                                                    –150
                             –100 –80 –60 –40 –20              0 20        40     60     80                           –100 –80 –60 –40 –20 0 20               40   60     80
                                                            t (1)                                                                      1.00028 ∗ t (1)

                                     PR decoction pieces                                                                  PR decoction pieces
                                     PR formula particles                                                                 PR formula particles
                                                     (a)                                                                                   (b)

                               0.8
                                                                                                                    1
                               0.6
                               0.4
                                                                                                                   0.5
           p (corr) (1)

                                                                                               p (corr) (1)
                               0.2
                                0                                                                                   0
                              –0.2
                                                                                                                  –0.5
                              –0.4
                              –0.6
                                                                                                                   –1
                              –0.8                                                     ESI+                                                                             ESI–
                               –1                                                                                 –1.5
                                 –0.2 –0.15 –0.1 –0.05        0     0.05    0.1        0.15                          –0.25 –0.2 –0.15 –0.1 –0.05 0       0.05 0.1 0.15 0.2
                                                            p (1)                                                                                p (1)
                                                     (c)                                                                                   (d)

Figure 4: OPLS-DA scores plot and S-plot of PR decoction pieces and formula granules. The scores plot of OPLS-DA revealed that PR
decoction pieces and PR formula granules were significantly different in the two classes in the positive mode (a) and negative mode (b). S-
plots indicated that the farther the distance from the central region represented the metabolites contributing more to the separation between
groups in the positive mode (c) and negative mode (d).

differences in chemical constituents of PR decoction pieces                                          In this research, the model parameters were R2X � 0.799,
(TY) and formula granules (TK). Principal component                                                 R2Y � 0.840, Q2 � 0.452 in ESI+ (Figure 3(a)); R2X � 0.884,
analysis (PCA) was utilized to reduce the dimensions of                                             R2Y � 0.993, and Q2 � 0.885 in ESI− (Figure 3(c)). The PLS-
multivariate problems. After Vilfredo Pareto with mean                                              DA scores plot showed that TY and TK were clearly isolated
centering, the data were showed as scores in a coordinate                                           into two groups, and the interclass differences were less than
system of latent variables, which resulted from the above                                           that in the PCA model, so the PCA model was more effective
samples. The PCA score plot (R2X � 0.805, Q2 � 0.686 in                                             to ensure the differences in two different dosages of PR. The
ESI+, Figure 2(a); R2X � 0.886, and Q2 � 0.654 in ESI−,                                             PLS-DA model was further validated by a permutation test
Figure 2(b)) showed clear separation in different dosage                                             with 200 permutations (Figures 3(b) and 3(d)). The R2 and
forms of PR in both ESI+ and ESI−. This indicated that there                                        Q2 values generated by the random permutation at the left
was a significant difference in chemical constituents between                                         end are both smaller than the original values at the right end,
TY and TK.                                                                                          indicating that the predictive power of the original model is
                                                                                                    greater than that of the random permutation y variables, so
                                                                                                    the model is effective and can be used for subsequent dif-
3.2.2. Partial Least Square Discriminant Analysis. Partial                                          ferential component analysis [24].
least square discriminant analysis (PLS-DA) is a supervised
analysis, which extends a regression of PCA and uses class
information to maximize the separation between groups of                                            3.2.3. Orthogonal Least Squares Discriminant Analysis.
observations [23]. This frequently used classification method                                        In order to further identify the significant metabolites
is categorical (categories described with dummy variables)                                          contributing to distinction in the two forms of PR, or-
and expressed the class membership of the statistical units.                                        thogonal least squares discriminant analysis (OPLS-DA), a
Comparison of Chemical Constituents in Pseudostellariae Radix with Different Dosage Forms Based on HPLC-Q-Exactive Orbitrap/MS Combined with ...
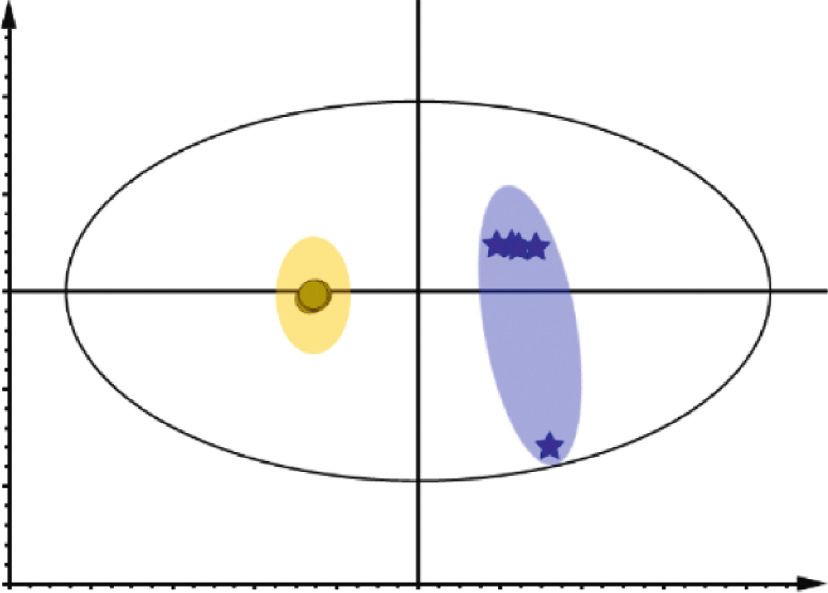
6                                                                                                                                      Evidence-Based Complementary and Alternative Medicine

                                                                                   Group
                                                                                   Guanosine                                                                                                                     Group
                                                                                   Choline                                2
                                                                                   Plaunol B                                                                                                                     L-Glutamate                  2
                                                                                   Isoformononetin
                                                                                   LysoPE (0:0/16:0)                                                                                                             Thymidine
                                                                                   LysoPC (16:0)
                                                                                   Formononetin                           1                                                                                      Apiin
                                                                                                                                                                                                                                              1
                                                                                   Diosmin                                                                                                                       Sucrose
                                                                                   Spinosic acid A
                                                                                   Soyasapogenol C                                                                                                               Raffinose
                                                                                   Vitamin D2                             0                                                                                                                   0
                                                                                   Sphinganine                                                                                                                   L-Ascorbic acid
                                                                                   Phytosphingosine
                                                                                   Camellenodiol                                                                                                                 Citric acid
                                                                                   Terminaline                            –1
                                                                                   Sphingosine                                                                                                                   D-Glucarate                  –1
                                                                                   Formononetin 7-(6″-malonylglucoside)
                                                                                   α-Tocotrienol                                                                                                                 Succinic acid
                                                                                   Pfaffic acid
                                                                                   Glutinone                              –2                                                                                     Uridine                      –2
                                                                                   Phosphocholine                                                                                                                Hesperetin 7-O-glucuronide
                                                                                   Sophoraflavanone B
                                                                                   Sophoraisoflavanone A                                                                                                         (-)-Jasmonic acid
                                                                                   Uracil
                                                                                   L-asparagine                                                                                                                  LPA(0:0/16:0)
                                                                                   Epinephrine
                                                                                   5′-deoxyadenosine                                                                                                             Diosmin
                                                                                   Indoleacrylic acid
                                                                                   L-glutamine                                                                                                                   Linoleic acid
                                                                                   2-furoic acid
                                                                                   L-tryptophan                                                                                                                  6″-Malonylapiin
                                                                                   5′-methylthioadenosine
                                                                                   Pantothenic acid                                                                                                              lsoformononetin
                                                                                   Cinnamic acid
                                                                                   p-coumaroyl quinic acid                                                                                                       LysoPE(0:0/16:0)
                                                                                   Thymol                                                                                                                        Fomiononetin
                                                                                   Adenine
                                                                                   Genistin                                                                                                                      3′-Sialyllactose
                                                                                   6-gingerol
                                                                                   Tangeritin                                                                                                                    Pantothenic acid
                                                                                   Histamine
                                                                                   S-adenosylhomocysteine                                                                                                        Auxin a
                                                                                   cis-jasmone
                                                                                   Pyroglutamic acid                                                                                                             Tropic acid
                                                                                   Trigonelline
                                                                                   Quercetin                                                                                                                     Nonanedioic acid
                                                                                   Glutinosone
                                                                                   DL-pipecolic acid                                                                                                             Hexadecanedioic acid
                                                                                   Coumarin                                                                                                                      Traumatic acid
                                                                                   (-)-jasmonic acid
                                                                                   L-dopa                                                                                                                        Abscisic acid
                                                                                   Valeric acid
                                                                                   p-hydroxyphenylacetic acid                                                                                                    Tangeritin
                                                                                   L-leucine
                                                                                   Adenosine                                                                                                                     Sebacic acid
                                                                                   L-proline
                                                                                   Guanine                                                                                                                       Chrysin
                                                                                   L-histidine
                                                                                   Benzoic acid                                                                                                                  Daidzein
                                                                                   L-Phenylalanine
                                                                                   L-valine                                                                                                                      Gallocatechin
                                                                                   Norepinephrine
                                                                                   Chrysin                                                                                                                       Citramalic acid
                                                                                   Niacinamide                                                                                                                   L-Dopa
                                                                                   Tropic acid
                                                                                   Anthranilic acid                                                                                                              Chlorogenic acid
                                                                                   Caprolactam
                                                                                   Isokaempferide                                                                                                                Glycitein
                                                                                   L-nicotine
                                                                                   4-hydroxybenzaldehyde                                                                                                         Liquiritigenin
                                                                                   L-tyrosine
                                                                                   L-methionine                                                                                                                  Keioside
                                                                                   Hesperidin
                                                                                   Glabrolide                                                                                                                    Glutaric acid
                                                                                   Gentisin
                                                                                   Naringin                                                                                                                      Taxifolin
                                                                                   Salicylic acid
                                                                                   Jasmolone                                                                                                                     Eriodictyol
                                                                                   α--ketoisovaleric acid                                                                                                        Riboflavin
                                                                                   Niacin
                                                                                   3-indoleacetic acid                                                                                                           α-D-Glucose
                                                                                   Ferulic acid
                                                                                   Naringenin-7-0-glucoside                                                                                                      Astragalin
                                                                                   Pyridoxal
                                                                                   Dopamine                                                                                                                      Quinic acid
                                                                                   Cirsilineol
                                                                                   Glycitein                                                                                                                     Luteolin
                                                                                   Genipin
                                                                                   Hydrouracil                                                                                                                   Genistein
                                                                                   Malvidin
                                                                                   Puerarin                                                                                                                      Naringenin-7-O-Glucoside
                                                                                   Luteone 7-glucoside                                                                                                           p-Coumaroyl quinic acid
                                                                                   Luteolin
                                                                                   Pyridoxamine                                                                                                                  Malvidin
                                                                                   Phenylacetic acid
                                                                                   Naringenin                                                                                                                    3″,4″-Diacetylcosmosiin
                                                                                   Sinapic acid
                                                                                   Liquiritigenin                                                                                                                Hesperetin
            TYS1

                   TYS2

                          TYS3

                                 TYS4

                                        TYS5

                                               TYS6

                                                      TYS7

                                                             TYS8

                                                                    TYS9

                                                                           TYS10

                                                                                                                                          TYS1

                                                                                                                                                 TYS2

                                                                                                                                                        TYS3

                                                                                                                                                               TYS4

                                                                                                                                                                      TYS5

                                                                                                                                                                             TYS6

                                                                                                                                                                                    TYS7

                                                                                                                                                                                           TYS8

                                                                                                                                                                                                  TYS9

                                                                                                                                                                                                         TYS10

    Group                                                                                                                      Group
       TK                                                                                                                         TK
       TY                                                                                                                         TY

                                                                      (a)                                                                                                              (b)

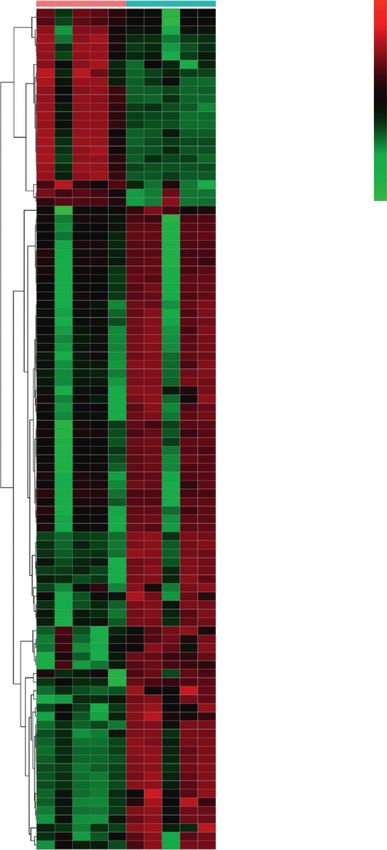
Figure 5: Hierarchical clustering analysis of PR decoction pieces and formula granules. Clear differentiation was observed in the heat map,
colors varying from green to red graphically indicated that the relative contents of metabolites were from low to high. 98 and 52 differential
chemical compositions were identified in the positive mode (a) and negative mode (b).

supervised pattern recognition approach was performed                                                                              Q2 � 0.984 in ESI− (Figure 4(b)), which indicated good
[25]. In OPLS-DA scores plot, each spot represents a sample.                                                                       ability of prediction and reliability of the model. To identify
As shown in Figure 4, the TY group can be clearly separated                                                                        the metabolites contributing to the discrimination, S-plots
from the TK group in both positive and negative modes, and                                                                         were generated (Figure 4(c) and 4(d)). Each spot in OPLS-
the model parameters were R2X � 0.933, R2Y � 1, Q2 � 0.673                                                                         DA scores plot and S-plots represents a variance. Farther the
in ESI+ (Figure 4(a)); R2X � 0.884, R2Y � 0.993, and                                                                               distance from the central region, higher is the contribution
Comparison of Chemical Constituents in Pseudostellariae Radix with Different Dosage Forms Based on HPLC-Q-Exactive Orbitrap/MS Combined with ...
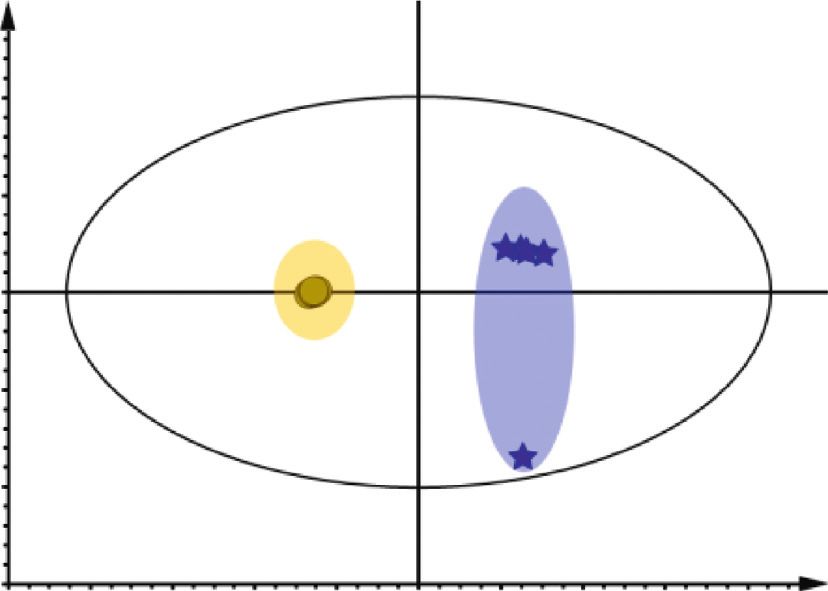
Evidence-Based Complementary and Alternative Medicine                                                                                   7

                                                                                              1% 1% 1%
                                             4%                                         1%
                                      4%
                                 4%
                                                                                             3%
                            4%                                                          3%
                                                                                   3%
                        4%                                     31%            4%                             24%
                       5%                                                4%

                                                                        5%
                             13%

                                                                          10%                                  23%
                                                        31%

                                                                                             17%

                        Fatty acids                      Alkaloids
                        Flavonoid                        Terpenoids
                        Organic acids                    Vitamins         Organic acids                  Alkaloids
                        Nucleosides                      Steroids         Flavonoid                      Active amines
                        Phenols                                           Amino acids                    Phenols
                                                                          Nucleosides                    Coumarins
                                                                          Vitamins                       Ketone
                                                                          Terpenoids                     Fatty acids
                                                                          Catecholamines                 Aldehyde
                                                  (a)                                              (b)

                                             5%                                               3% 3%
                                                                                         3%
                                      5%                                            3%

                                                                               6%
                             11%                              26%
                                                                          6%
                                                                                                               49%
                        11%

                                                               21%
                                                                                         27%
                                       21%

                        Flavonoid                        Carbohydrate     Flavonoid                      Fatty acids
                        Organic acids                    Vitamins         Organic acids                  Phenylpropanoids
                        Fatty acids                      Amino acids      Carbohydrate                   Catecholamines
                        Nucleosides                                       Vitamins                       Terpenoids
                                                  (c)                                              (d)

Figure 6: Comparative analysis of contents of differential chemical compositions in PR decoction pieces and formula granules. (a) The
relative contents of differential chemical compositions in PR decoction pieces > PR formula granules in the positive mode. (b) The relative
contents of differential chemical compositions in PR decoction pieces < PR formula granules in the positive mode. (c) The relative contents
of differential chemical compositions in PR decoction pieces > PR formula granules in the negative mode. (d) The relative contents of
differential chemical compositions in PR decoction pieces < PR formula granules in the negative mode.

of the metabolites. The importance of each variance to                  3.3. Identification of Differential Compositions with Relative
classification was determined by the value of variable in the            Contents Analysis. VIP >1 of OPLS-DA combined with the
projection (VIP). Metabolites with the VIP value above 1.0              t-test (p < 0.05) was used to discover the significantly dif-
and P value below 0.05 were considered as potential met-                ferential metabolites in TY and TK. METLIN and HMDB
abolic markers.                                                         databases are used to search the accurate mass-to-charge
Comparison of Chemical Constituents in Pseudostellariae Radix with Different Dosage Forms Based on HPLC-Q-Exactive Orbitrap/MS Combined with ...
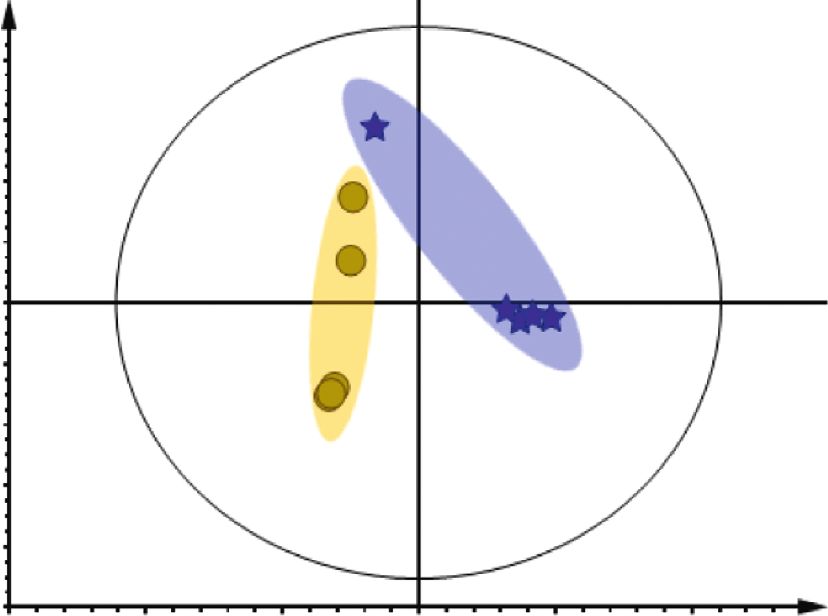
8                                                                 Evidence-Based Complementary and Alternative Medicine

ratio to identify the differential chemical compositions. As
seen from hierarchical clustering analysis (Figures 5(a) and
5(b)), a total of 98 and 52 differential chemical compositions                     4
were identified in the positive mode and negative mode,
respectively, and the detailed information is given in
Table S1 and Table S2.                                                            3
    Clear differentiation was observed in the heat map based
on differential chemical compositions, and colors varying

                                                                       –log (p)
from green to red graphically indicate that the relative                          2
contents of metabolites are from low to high. In the positive
mode, there were 23 differential chemical compositions that
had the relative contents of TY greater than that in TK, while                    1
there were 75 differential chemical compositions that the
relative contents of TY were less than that in TK. In the
                                                                                  0
negative mode, there were 19 differential chemical com-
positions that the relative contents of TY were greater than                          0.0   0.2     0.4     0.6    0.8   1.0
that in TK, while there were 33 differential chemical com-                                         Pathway impact
positions that the relative contents of TY were less than that   Figure 7: Analysis of pathway impact. Isoquinoline alkaloid
in TK.                                                           biosynthesis which was the potential key metabolic pathway.
    As shown in Figures 6(a) and 6(b), in the positive mode,
the relative contents of differential chemical compositions in
TY above that in TK were distributed in nine kinds of            the larger the radius. The color of dots represents the p value
compositions. Flavonoids and fatty acids had the highest         of the metabolic pathway, and the lower the p value, the
proportion, accounting for 31%. The relative contents of         redder the color. The threshold value for the effect of the
differential chemical compositions in TY below that in TK         metabolic pathway was set to 0.6 with topological Fenix,
were distributed in fourteen varieties of compositions.          greater than which will be selected as potential key metabolic
Among them, 18 organic acids accounted for the largest           pathways. Finally, one metabolic pathway, isoquinoline al-
proportion (24%), followed by flavonoids (17, 23%) and            kaloid biosynthesis (A), was coenriched (Figure 7).
amino acids (13, 17%). In the negative mode, the relative
contents of differential chemical compositions in TY above        4. Conclusions
that in TK were mainly involved in seven varieties of
compositions. Flavonoids (5, 26%) were the most abundant,        In this research, the difference of chemical compositions in
followed by organic acids (4, 21%) and fatty acids (4, 21%)      PR with different dosage forms was analyzed by HPLC-Q-
(Figure 6(c)). The relative contents of differential chemical     Exactive Orbitrap/MS combined with multivariate statistical
compositions in TY below that in TK belonged to eight            analysis. Results showed that the chemical compositions
varieties of compositions. Among them, flavonoids                 exited great differences in TY and TK. A total of 98 dif-
accounted for the highest proportion (16, 49%), followed by      ferential chemical compositions were found in ESI+, while
organic acids 9, 27% (Figure 6(d)). The results showed that      52 were found in ESI−. These constituents were mainly
differential chemical compositions of PR with different            concentrated in flavonoids, organic acids, fatty acids, and
dosage forms were mainly concentrated in flavonoids, or-          amino acids, mainly involved in the isoquinoline alkaloid
ganic acids, amino acids, and fatty acids. In additional, in     biosynthesis metabolic pathways. In addition, both in
both positive and negative modes, the amounts and types of       positive and negative modes, the amounts and types of
differential chemical compositions with higher relative           differential chemical compositions with higher relative
contents in TK were both more than those with higher             contents in TK were both more than those with higher
relative contents in TY, for example, flavonoids with anti-       relative contents in TY, including flavonoids with the an-
tumor effects, including chrysin, naringin, luteolin, and         titumor effect, organic acids containing the antibacterial
genistin; antimicrobial resistance to oxidation of organic       antioxidant effect, and amino acids which can boost
compounds, including cinnamic acid, ferulic acid, and            immunity.
salicylic acid; and amino acid compounds with immune-                This study will provide the basic information for ex-
promoting effects, including L-tryptophan, L-phenylalanine,       ploring the influence law of different dosage forms on the
and L-tyrosine.                                                  synthesis and accumulation of metabolites in PR and its
                                                                 quality-forming mechanism. It will also provide a reliable
                                                                 and accurate approach for the analysis of complex samples
3.4. Metabolic Pathway Analysis. The metabolic pathway           and identification of differential chemical compositions.
was analyzed by MetaboAnalyst website, and the Kyoto
Encyclopedia of Genes and Genomes (KEGG) of the above            Data Availability
identified compounds was introduced to MetaboAnalyst for
pathway analysis. The radius of dots represents the impact       The data used to support the findings of this study are
value of the metabolic pathway. The larger the impact value,     available from the corresponding author upon request.
Comparison of Chemical Constituents in Pseudostellariae Radix with Different Dosage Forms Based on HPLC-Q-Exactive Orbitrap/MS Combined with ...
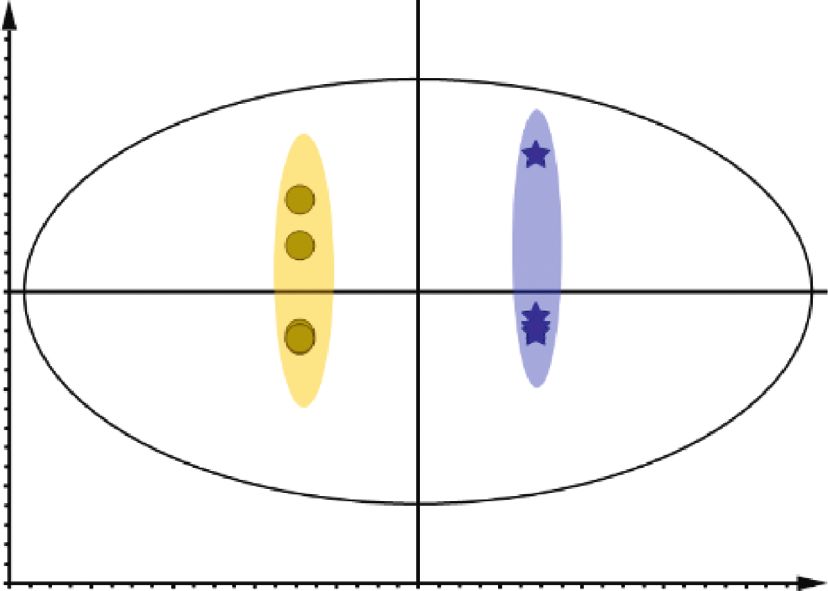
Evidence-Based Complementary and Alternative Medicine                                                                                         9

Conflicts of Interest                                                     [9] Y. H. Li, Z. F. Wu, Y. Y. Li, H. T. Li, and M. Yang, “Analysis on
                                                                              relativity of drying process of extract and pelleting quality of
The authors declare that they have no conflicts of interest.                   Chinese materia medica formula granule based on powder
                                                                              properties,” Chinese Traditional and Herbal Drugs, vol. 48,
Authors’ Contributions                                                        no. 10, pp. 1930–1935, 2017.
                                                                         [10] J. Han, “Comparison and analysis of free-fried Chinese herbal
Yujiao Hua and Xiaoyuan Liu carried out the experiments,                      formulagranules and traditional Chinese herbal pieces,”
analyzed data, and composed the draft of the article. Yujiao                  China Continuing Medical Education, vol. 10, no. 28,
Hua analyzed data and wrote the article. Xiaoyuan Liu                         pp. 142–144, 2018.
                                                                         [11] J. Chen, S. Sun, and Q. Zhou, “Direct and model-free de-
provided the samples of PR. Fen Xie participated in the
                                                                              tection of carbohydrate excipients in traditional Chinese
supervision of this study and edited the article. All authors
                                                                              medicine formula granules by ATR-FTIR microspectroscopic
read and approved the final draft of the article.                              imaging,” Analytical and Bioanalytical Chemistry, vol. 409,
                                                                              no. 11, pp. 2893–2904, 2017.
Acknowledgments                                                          [12] N. Schauer and A. Fernie, “Plant metabolomics: towards
                                                                              biological function and mechanism,” TRENDS in Plant Sci-
This work was supported by the Talent Plan of Affiliated                        ence, vol. 11, no. 10, pp. 508–516, 2006.
Hospital of Jiangnan University (Wuxi No. 4 People’s                     [13] C. Y. Li, Z. Wang, P. Wang, and X. L. Meng, “Therapeutic
Hospital) (201821) and Wuxi Science and Technology De-                        material basis and action mechanism of Chinese materia
velopment Medical and Health Guidance Plan (NZ2019012).                       medicabased on metabonomic technology,” Chinese Tradi-
                                                                              tional and Herbal Drugs, vol. 44, no. 7, pp. 918–922, 2013.
                                                                         [14] S. Lyu, S. L. Yang, Y. Rao, and Y. L. Feng, “Application of
Supplementary Materials
                                                                              metabolomics and related technologies in research and de-
Table S1. Components identified with significant differences                     velopment field of traditional Chinese medicine,” China
from Pseudostellariae Radix with different dosage forms in                     Journal of Chinese Materia Medica, vol. 43, no. 21,
the positive ion mode (p < 0.05). Table S2. Components                        pp. 4182–4191, 2018.
                                                                         [15] Y. J. Hua, S. N. Wang, and C Chai, “Quality evaluation of
identified with significant differences from Pseudostellariae
                                                                              pseudostellariae radix based on simultaneous determination
Radix with different dosage forms in the negative ion mode                     of multiple bioactive compontents combined with grey re-
(p < 0.05). (Supplementary Materials)                                         lational analysis,” Molecules, vol. 22, no. 1, pp. 13–27, 2017.
                                                                         [16] J. Tan, C. Wang, H. Zhu et al., “Comprehensive metabolomics
References                                                                    analysis of xueshuan xinmaining tablet in blood stasis model
                                                                              rats using UPLC-Q/TOF-MS,” Molecules, vol. 23, no. 7,
 [1] Chinese Pharmacopoeia Commission, Chinese Pharmaco-                      pp. 1650–1665, 2018.
     poeia 2015. Part1, p. 68, China Medical Science Press, Beijing,     [17] S. Wang, Y. Hua, Y. Lin et al., “Dynamic changes of metabolite
     China, 2015.                                                             accumulation in Scrophulariae Radix based on liquid chro-
 [2] X. S. Fu, X. H. Liu, H. Xu et al., “Research status and trends of        matography-tandem mass spectrometry combined with
     pseudostellariae radix,” Chinese Journal of New Drugs, vol. 21,          multivariate statistical analysis,” Journal of Separation Science,
     no. 7, pp. 757–760, 2012.                                                vol. 40, no. 14, pp. 2883–2894, 2017.
 [3] X. C. Shen, L. Tao, S. Bo et al., “Ameliorated effects of Radix      [18] H. Zhao, Y. Yan, and C. C Wang, “Comparison of chemical
     Pseudostellariae on oxidative stress in rat chronic heart failure        constituents in magnoliae OfficinalisCortex processed by
     induced by acute cardiac infarction,” Journal of Chinese
                                                                              “sweating” and “non sweating” based on UltraFast liquid
     Pharmaceutical Sciences, vol. 23, pp. 413–416, 2008.
                                                                              chromatography-triple quadrupole-time of flight mass spec-
 [4] C. L. Zhang and X. X. Zhang, “Effects of polysaccharides from
                                                                              trometry and gas chromatography-triple QuadrupoleMass
     Pseudostellariaheterophylla on exercise endurance capacity
                                                                              spectrometry combined with multivariate statistical analysis,”
     and oxidative stress in forced swimming rats,” Scientific Re-
     search and Essays, vol. 6, pp. 2360–2365, 2011.                          Natural Product Communications, vol. 13, no. 8, pp. 987–991,
 [5] R. Sheng, X. Xu, Q. Tang et al., “Polysaccharide of radix                2018.
     pseudostellariae improves chronic fatigue syndrome induced          [19] X. Zhao, Y. Zhang, X. Meng et al., “Effect of a traditional
     by poly I:C in mice,” Evidence-Based Complementary and                   Chinese medicine preparation Xindi soft capsule on rat model
     Alternative Medicine, vol. 2011, Article ID 840516, 9 pages,             of acute blood stasis: a urinary metabonomics study based on
     2011.                                                                    liquid chromatography-mass spectrometry,” Journal of
 [6] S. D. Ni, L. Z. Xia, X. X. Xu et al., “Effect of pseudostellaria          Chromatography B, vol. 873, no. 2, pp. 151–158, 2008.
     polysaccharides in diabetic mice by alloxan,” Anhui Medical         [20] B. Zhuang, Z.-M. Bi, Z.-Y. Wang, L. Duan, C.-J.-S. Lai, and
     and Pharmaceutical Journal, vol. 14, pp. 521-522, 2010.                  E.-H. Liu, “Chemical profiling and quantitation of bioactive
 [7] W. Pang, S. Lin, Q. Dai, H. Zhang, and J. Hu, “Antitussive               compounds in Platycladi Cacumen by UPLC-Q-TOF-MS/MS
     activity of pseudostellaria heterophylla (miq.) Pax extracts and         and UPLC-DAD,” Journal of Pharmaceutical and Biomedical
     improvement in lung function via adjustment of multi-cy-                 Analysis, vol. 154, pp. 207–215, 2018.
     tokine levels,” Molecules, vol. 16, no. 4, pp. 3360–3370, 2011.     [21] Y. Hua, Y. Hou, S. Wang et al., “Comparison of chemical
 [8] Y. Li, X. Shi, and Z Wu, “Near-infrared for on-line deter-               compositions in pseudostellariae radix from different culti-
     mination of quality parameter of Sophora japonica L. (formula            vated fields and germplasms by NMR-based metabolomics,”
     particles): from lab investigation to pilot-scale extraction             Molecules, vol. 21, no. 11, pp. 1538–1549, 2016.
     process,” Pharmacognosy Magazine, vol. 11, no. 41, pp. 8–13,        [22] Y. F. Zhou, M. Niu, and J. X Fang, “Metabonomics study on
     2015.                                                                    hepatoprotective of SchisandraeChinensis Fructus based on
Comparison of Chemical Constituents in Pseudostellariae Radix with Different Dosage Forms Based on HPLC-Q-Exactive Orbitrap/MS Combined with ...
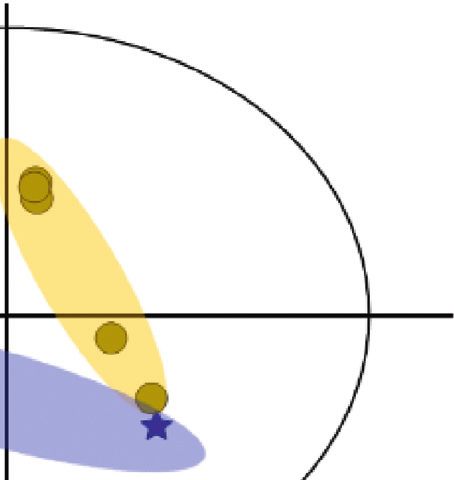
10                                                                      Evidence-Based Complementary and Alternative Medicine

     UPLC-Q/TOF-MS,” China Journal of Chinese Materia
     Medica, vol. 43, no. 18, pp. 3756–3763, 2018.
[23] J. Trygg, E. Holmes, and T. Lundstedt, “Chemometrics in
     metabonomics,” Journal of Proteome Research, vol. 6, no. 2,
     pp. 469–479, 2007.
[24] Z.-Y. Li, H.-J. Zhi, F.-S. Zhang et al., “Metabolomic profiling
     of the antitussive and expectorant plant Tussilago farfara L. by
     nuclear magnetic resonance spectroscopy and multivariate
     data analysis,” Journal of Pharmaceutical and Biomedical
     Analysis, vol. 75, pp. 158–164, 2013.
[25] N. C. Luo, W. Ding, and J Wu, “UPLC-Q-TOF/MS coupled
     with multivariate statistical analysis as apowerful technique
     for rapidly exploring potential chemical markers to differ-
     entiate between radix paeoniae alba and radix paeoniae
     rubra,” NaturalProduct Communications, vol. 8, no. 4,
     pp. 487–491, 2013.
You can also read