Compelling Insights, Impactful Research - Confidence comes with knowledge and exprience, and empowers you to prepare for the ever-changing world ...
←
→
Page content transcription
If your browser does not render page correctly, please read the page content below

Confidence comes with
                       knowledge and exprience,
                         and empowers you to
                            prepare for the
                          ever-changing world
                             and industry.

Compelling Insights,
Impactful Research
BENCHMARK SURVEY 2021 Insights   1

Contents
Foreword		                                               2
Kanyisa Mkhize, CEO:
Sanlam Corporate
Evolution of retirement funding                          6
Rigitté van Zyl, Chief Client Officer and
Lorraine Mekwa, Business Development Manager:
Sanlam Corporate Investments
Trends in union funds since 2013                         11
Mkuseli Mbomvu, Executive: Group External Relations
Sanlam Group Market Development
and Lorraine Mekwa,
Business Development Manager:
Sanlam Corporate Investments
How much are members saving for retirement              18
Danie van Zyl, Head: Smoothed Bonus Centre
of Excellence
Sanlam Corporate Investments
Infrastructure Investing with purpose                   20
Darryl Moodley, Head: Tailored Investments
Sanlam Corporate Investments
The more things change                                  24
Avishal Seeth, CEO:
Sanlam Umbrella Solutions
Impact of COVID-19 and ensuring sustainable             30
pricing in Group Risk
Michele Jennings, Managing Executive: Group Risk
Sanlam Corporate
Looking towards the horizon                             36
Barend le Grange, Head: Individual Member Suppor,
Sanlam Corporate
Smoothed bonus portfolios weather the storm             40
Managing Executive: Investments
Sanlam Corporate
Satrix – A partner for reforming the retirement         42
funds industry
Helena Conradie, Chief Executive Officer
Satrix
and David Gluckman, Chairman:
Sanlam Umbrella Fund
Benchmark 2021: Annuities                               46
Karen Wentzel,Head: Annuities
Sanlam Corporate Investments
A trusted partner for your group insurance needs        48
Reinier van Gijsen
Sanlam Group Risk
Evolution of digital technology and its impact on       51
member engagements
Tebogo Legodi, Digital Lead:
Sanlam Corporate
Retirement Funds and Advisors – oil and water?          54
Dominic Sides,
Sanlam Corporate Investments
Umbrella Funds Research and overview                    57
Ana Siwiak, Head: Product Development,
Sanlam Umbrella Solutions
The changing role of the independent principal          63
officer and trustee
Kobus Hanekom, Principal Officer:
Sanlam Umbrella Fund
Advice to Boards and Employers in an Evolving World     66
Elrina Wessels, Head: Technical and Compliance
Simeka

BENCHMARK SURVEY 2021 Insights   2

Foreword

       Kanyisa Mkhize
       CEO:
       Sanlam Corporate

       Our 40-year journey
       of compelling
       insights and
       impactful
       research
       It is 40 years since we conducted our
       first Sanlam Benchmark research,
       and it’s been a remarkable journey.
       Our main objective with the research
       is to provide insights that stimulate
       conversation, create meaningful
       opportunities for further engagement
       with industry stakeholders and
       ultimately to help effect a positive
       financial outcome in retirement for
       South Africans.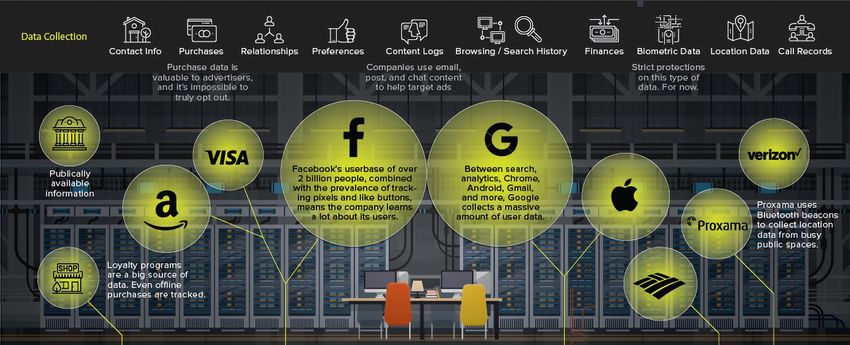
BENCHMARK SURVEY 2021 Insights                3

Why do we conduct the                    Our research takes current economic realities into account
                                         and relies on ‘best practice’ diagnostic tools to model
Sanlam BENCHMARK™                        solutions for the future benefit of all South African retirees.
Survey?                                  Every year we observe the financial impact of socio-
Market research is a formalised means    economic conditions on the living standards of members
of obtaining information to influence    and retirees. In South Africa we are currently experiencing an
decision making. Our research seeks      unprecedented high level of more than 30% unemployment
to find information to address some of   according to the Reserve Bank. Such a high level of
the behavioural challenges and aims      unemployment is one the primary factors for members not
to improve the poor savings culture in   reaching their financial retirement goals.
South Africa.                            For this reason our research includes a combination of
What are the benefits of the research    qualitative and quantitative fieldwork so that we may better
for the employee benefits industry you   understand the needs of our stakeholders. Over the past
might ask?                               year we have had 534 structured conversations with our
                                         stakeholders, with the Benchmark research at the centre of
For members, we aim to empower           insights development.
them with simple and easy-to-
understand information regarding         We appreciate the input from our stakeholders who year on
financial matters:                       year sit through our interviews and allow us to brainstorm
                                         the industry challenges with them. Our research is
    enable access to information
                                         conducted by BDRC Africa, an independent research agency,
    in order to help improve their       and participation in our research is completely confidential.
    understanding and knowledge of
    their personal retirement matters    The information is freely accessible via the Sanlam
                                         Benchmark website. Funds are able to design benefit
    enable engagement more readily
                                         structures and communication strategies based on the
    with their retirement funds on
                                         membership needs and issues uncovered in the research.
    specific issues in the medium that
                                         By improving the levels of saving for retirement, the industry
    is most suited to them
                                         is also in a position to improve the current savings levels in
    enable them to be more proactive     South Africa.
    and take accountability for their
    own retirement needs.                The Sanlam Benchmark survey has proved its value and
                                         worth, making it the pioneering study that it is. Since 1981,
With the aid of personal financial       we’ve been delving deeply into the retirement fund industry
advisors, members are empowered          through a comprehensive and rigorous research process.
with information to start retirement     What started out as a single study among stand alone
planning much sooner. For trustees       retirement fund representatives has expanded to cover
and industry players, the benefits       participating employers in commercial umbrella funds, active
include having a repository of           members, retirees and financial advisors. We have now
information and trends specific to       conducted more than 100 separate surveys over the past
retirement funding.                      40 years and have learned a lot in the process.
BENCHMARK SURVEY 2021 Insights           4

Looking back over the 40 years, there are some key events, shifts and milestones
that got us to where we are as an industry, as reflected in the Sanlam Benchmark
surveys and reports.

The 1980s were the          In the 1990s, the          Then came the            Over the 2010s,
‘struggle years’,           years of ‘political        2000s, which were        particularly since
a time of conflict          freedom and                the ‘consolidation       2016, we have seen
when discriminatory         reconciliation’,           years’, when             the increased role
laws and practices          amid greater               legislation increased    technology plays
curtailed the freedom       political freedom          as a means to offer      in how financial
of so many, when            and reconciliation,        more protection          institutions operate,
only 75% of funds           members were               to members, but          and how we engage
were open to all races,     offered much more          we also witnessed        with members.
and eligibility was         freedom — which            greater uncertainty
                                                                                And now our latest
limited in many ways,       came with its own          for members who
                                                                                report looks back
including for women.        risks — in their           could not meet
                                                                                at probably one of
Retirement benefits         investment choices         their financial goals,
                                                                                the most profound
were provided on a          and had a greater say      because they were
                                                                                events in recent
defined benefit basis,      in the management          cashing in their
                                                                                human history, which
which was a very            of their funds. While      withdrawal benefits
                                                                                has come at a cost
paternalistic structure     some members               when changing
                                                                                to members and
— members had               thrived on the             jobs. Members
                                                                                financial institutions.
little choice, but also     freedom to align their     consistently believed
                                                                                It is only with wisdom
carried very little risk.   benefits with their        they were not on
                                                                                — built on information
It is worth bearing in      own specific financial     track to meet their
                                                                                gleaned from reports
mind that there was         goals, many members        financial goals. The
                                                                                such as the Sanlam
no legislation forcing      found the range of         lack of preservation
                                                                                Benchmark surveys —
employers to provide        options bewildering.       is confirmed by
                                                                                that we can navigate
a retirement fund for       Instead of seeking         the fact that 71%
                                                                                our way through
employees, but most         financial advice, they     of funds estimate
                                                                                these uncharted
employers decided           pushed the whole           that members will
                                                                                waters and restore
it was necessary for        idea of saving for         withdraw and take
                                                                                our members’
the benefit of their        retirement and even        their full fund value
                                                                                confidence in their
employees.                  retirement itself to the   in cash. The industry
                                                                                financial futures.
                            back of their minds.       responded to the lack
Near the end of the
                                                       of preservation and
decade, through
                                                       other sub-optimal
the influence of
                                                       outcomes by focusing
trade unions, we
                                                       on communication
saw an increasing
                                                       and education.
shift from pension to
provident funds. The
driving force behind
this move was the
restrictive withdrawal
conditions in defined
benefit pension funds.
BENCHMARK SURVEY 2021 Insights             5

Milestones of and                          A wider range of member benefits have become available
                                           over the years, with funeral cover, critical illness cover,
changes in the research                    education policies, financial wellness and retirement benefits
programme over the                         counselling being offered alongside traditional death and
years                                      disability cover.

Moving into an umbrella fund               The 2021 survey looked at attitudes towards a holistic
arrangement remains on the agenda          integrated health and financial wellness offering, and this
for a high proportion of stand-alone       concept appears to have considerable support, especially
funds — 42% had considered this            from stand-alone funds, 49% of which believe it delivers
when last measured in 2019. The            higher productivity and staff happiness.
number of stand-alone funds available      The employee benefits industry is unique in that our
to participate in the Benchmark Survey     competitors are also key partners in shaping retirement
each year is shrinking                     outcomes for all South Africans. Their contributions to the
Since the mid-2000s we have seen           retirement funding industry over the past 40 years are also
a steady migration from stand-alone        recognised and applauded.
to umbrella funds, mainly in a bid to      My team and I remain deeply committed to our research
reduce costs, ease administration and      initiative and continue to step up our efforts and investment,
outsource fiduciary responsibility. But,   as we are able to clearly see the contribution it is making
thankfully, we have a high year-on-year    towards the development of a new, improved retirement
participation rate, especially among       system in South Africa.
stand-alone funds (typically around
70%).
While we set broad quotas each year
to ensure representation of funds
of different sizes (and sub-funds)
in the sample, the average size of
funds participating in the study has
increased:
Stand-alone funds:
2021: 10 015 members and R3.45 bn
assets
2011: 2 022 members and R479 m
assets
Umbrella funds (participating
employers):
2021: 594 members and R299 m
assets
2011: 400 members and R106 m assets
BENCHMARK SURVEY 2021 Insights              6

Evolution of
retirement
funding
                Rigitté van Zyl
                Chief Client Officer
                and
                Lorraine Mekwa
                Business Development Manager:
                Sanlam Corporate Investments

Over the past 40 years,                More than ever before, the needs of our members’ families
                                       have morphed together with their personal, career and
the retirement funds                   financial aspirations. As our society and our values have
industry has evolved                   changed, we’ve also witnessed mindsets change — individually
                                       and collectively. So today we will share some of those
alongside the social,                  changes in trends that relate specifically to retirement
political, economic and                funding, and what this means for members reaching their
                                       desired retirement outcomes.
technological changes in
                                       Our research methodology has remained mostly consistent
our society. It goes without           over the years. Last year, we adapted our measurement
saying that we expect                  tool by changing questions to be fit for purpose during a
                                       global pandemic. This year, we have reverted to our original
this evolution to continue             research approach, but conducted face-to-face interviews
– 10 or 40 years from                  virtually via Zoom, as we do most engagements these days.
now, our industry may be               In total we conducted 200 interviews and once again we
unrecognisable from what               received overwhelming year-on-year participation, with 68%
                                       of stand-alone funds and 48% of employers participating in
it is now. These broader,              umbrella funds from the 2019 survey also participating this
contextual changes have                year. A further 4% who participated in the stand-alone survey
                                       in 2019 were interviewed as umbrella fund participants this
impacted every facet of                year. This confirms the trend of conversion from stand-alone
our members’ lives and                 to umbrella funds.

reshaped their individual              We now have eight years’ data to analyse since we first
                                       included a subset of 10 union funds in the stand-alone survey.
needs.                                 These 10 funds this year represent a total of R109 billion in
                                       assets representing over 500 000 members. Since inception,
                                       we have observed a marked increase in the average asset
                                       size, which spiked this year to just under R11 billion (double
                                       the R5,5 billion of 2019). The year-on-year participation of
                                       the union sample remains impressive at 80%.
BENCHMARK SURVEY 2021 Insights                                  7

Impact of COVID-19                        Healthcare Integration Strategies used
                                                                                                    Umbrella Funds         Stand-alone funds
As an industry collective we
                                           Believe a holistic integrated health and                                                  49%
have one goal in mind, and that            financial wellness programme delivers
is to improve members’ financial          higher productivity and staff happiness                                            36%

outcomes at retirement. We cannot                The employer selects wellness /                      17%
ignore the impact and the reality               health programmes independent
                                                                  of each other                                      30%
of the pandemic. Over the past
year and a half significant research              The employer integrates some
                                               programmes but manages others
                                                                                              12%

was conducted on the effect that                                 independently                12%

the pandemic has had on people,
                                               Do not take responsibility for an             11%
employees, businesses and funds to         employee’s health but adhere to legal
                                                    requirements in this regard
understand how we can do better as                                                                      19%

an industry.                                  Don’t believe there is a causal link    0%
                                           between employee health and overall
The physical, financial and emotional                    staff productivity levels    1%

impact on employees was highlighted
                                                                                            10%
last year and is still very real today.                                  Not sure
This was also a recurring theme, with                                                  2%

employers and funds expressing their                                                  1%
concern for their employees’ overall                               Not applicable
                                                                                      0%
wellness. With this in mind, we wanted
to understand how employers are           A notable trend we observed is the proliferation of
providing for their employees with        employees working from home. This flexible approach has, of
regard to this holistic need.             course, brought its own challenges, with employees having
                                          to balance work, childcare and their domestic responsibilities
Most employers and funds believe that     in the same space.
having a holistic health and financial
wellness programme in place is            The transition from office to home office has not been
important, but apply different ways of    seamless, with technology and internet access posing a
providing this.                           substantial obstacle.
Half of stand-alone funds and only        This meant that employers have had to think out of the box
36% of participating employers of         and out of their comfort zones when they needed to ensure
umbrella funds believe a holistic         employee productivity was not negatively affected and
integrated health and financial           that employees remain safe. Workplace safety protocols for
wellness programme delivers higher        industries/employees who were not able to work from home
productivity and staff happiness.         also had to be adjusted.
This is also supported by our client      A recent Gartner poll showed that 48% of employees will,
experience research, where 40%            post-COVID, likely work remotely at least part of the time,
of participants indicated that they       compared to 30% prior to the pandemic. With this increase
find the idea of a one-stop-shop          in the amount of time employees are spending online, the
solution appealing. Others still offer    risk associated with cyber fraud has been amplified.
these benefits but manage some
programmes separately.                    Just briefly casting our minds back, in the 2019 Benchmark
                                          Survey we highlighted the risk of cyber fraud and in response
                                          launched the Cyber resilience benchmark. This year we
                                          asked participants to share their views on whether there
                                          has been an increase in risks associated with cyber security
                                          because of staff working remotely. The majority of funds
                                          reported an increase in such risks.
                                          Funds and employers have been proactive in mitigating
                                          their risk. Most of the respondents said they had upgraded
                                          security software and increased security procedures, while
                                          only about 13% of stand-alone funds and only a small portion
                                          of participating employers of umbrella funds have purchased
                                          cyber insurance. Assuming that most funds/employers have
                                          some type of insurance in place, we still expect this number
                                          to grow in the future since the expectation is that the global
                                          cyber-security insurance market is expected to grow at a
                                          compounded annual rate of 21,2% by 2025.
BENCHMARK SURVEY 2021 Insights               8

Most popular steps taken to                                 highlighted the significant impact the pandemic has had on
minimise cyber security risk of                             members’ immediate financial needs.
remote working practices                                    The industry was very quick to respond to this financial
Upgraded security
                                                      83%
                                                            reality through offering contribution suspensions. Twenty-
software to detect
      virusses and                                          seven per cent of stand-alone funds and 41% of employers
                                              61%
 hacking attempts
                                                            participating in umbrella funds indicated that they had
Increased security
 procedures to log
                                                            suspended retirement fund contributions during 2020
                                           56%
 on to our systems                                          due to the financial impact of the economic lockdown. On
      remotely, e.g.
         additional
                                             59%            average this was for4.5 months, which was in line with the
        passwords
                                                            expectations indicated at last year’s Benchmark Survey.
 Purchased cyber
                       5%
                                                            However, two funds indicated that they had suspended
       insurance
                            13%                             contributions for a year or more. In the case of union funds,
                                                            70% indicated that retirement contributions had also been
                        7%                                  suspended for on average five months.
      Still training
                        7%                                  Our latest suspension statistics indicate that 8,5% of
             Umbrella Funds       Stand-alone funds         membership of the Sanlam Umbrella Fund still have
                                                            suspended contributions to retirement savings. This is a
In response to the global financial crisis                  marked improvement from August 2020 when nearly 25%
triggered by the pandemic, we have                          of membership had suspended contributions, indicating that
seen businesses closing and going into                      there has been some economic recovery.
liquidation. Also, global M&A activity
has accelerated and companies                               Contribution and fees
have been reorganising to increase
efficiencies.                                               In 2014 we discussed the seven habits of a financially
                                                            healthy retiree. Over the years a lot has changed, but saving
From our Benchmark research, we                             enough through adequate contributions levels, selecting the
see that 1 in 3 funds surveyed has                          appropriate investment portfolio, preserving, considering
experienced some kind of reduction in                       wider needs and getting the right guidance/advice still
workforce as a result of the pandemic.                      remain the foundation.
We anticipate some stand-alone                              It is important to recognise that throughout this journey
funds might reconsider the option                           members have diverse needs and preferences. And on their
of joining an umbrella fund this year.                      way to retirement, they are balancing their preparation for
There seems to be strong anecdotal                          the future with immediate financial needs.
evidence that this is the case. National
Treasury and the Financial Services                         Saving enough through contributions is something that
Conduct Authority are also driving                          we’ve been tracking over the years. If we don’t take the
industry consolidation. In addition,                        COVID-19-related contribution suspensions into account,
the operational and financial stress                        since 2014 we have seen a steady increase in contribution
on businesses means that employers                          levels. For funds and participating employers of umbrella
who have stand-alone funds will also                        funds, contribution levels have remained fairly stable from
want to focus purely on core business                       2019 to 2021, with an increase in employer contributions and
activities to ensure they are operating                     a slight reduction in member contributions in umbrella funds.
as optimally as possible. The reduction                     Our research has indicated that the average time for which
in workforce combined with this                             contribution rates were suspended, was 4,5 months. If we
focus on core activities could result in                    consider the total stand-alone contributions of 17,46%, this
many of these employers considering                         rate drops to 10,91% due to the effect of the suspensions.
umbrella funds.                                             While this contribution adjustment was intended to provide
                                                            temporary financial relief to employees during the pandemic,
This also has a direct impact on
                                                            some of the economic impacts might be longer lasting.
members and their ability to reach
                                                            Hopefully we will see the increasing trend continuing into the
their retirement goals and outcomes.
                                                            coming years.
When we asked employers and funds
what the financial impact on members                        Regarding administration costs, the majority of funds
had been, an overwhelming 80%                               continue to express their expenses as a percentage of a
indicated that members had either                           member’s salary, at 49% for stand-alone funds and 75% for
experienced a reduction in expected                         umbrella funds. In the case of umbrella funds this percentage
annual increases, a reduction in                            has grown from 65% in 2019. Almost 40% (38%) of stand-
current pay or had been forced to                           alone funds express this cost as a fixed rand amount per
take sabbaticals without pay. This                          member per month. In the past two years, we have seen
BENCHMARK SURVEY 2021 Insights                    9

a notable increase in the number of          highlight a perceived lack of improvement in member
funds using a combination of fee-            behaviour regarding preservation and annuitisation since the
charging models to service their             implementation of default regulations. In fact, 57% of stand-
administration costs, instead of             alone funds say that they have not seen an improvement
charging exclusively a % of total asset      in member preservation. Some of the main reasons cited
value.                                       include members wanting access to their cash, inadequate
As in previous years, members of very        communication, and the deterioration in economic
large funds benefit from economies of        conditions in South Africa.
scale and pay a lower administration         Have Default Regulations improved member
fee of 0,5% compared to members              behaviour?
of smaller funds who pay on average            PRESERVATION?         ANNUITISATION AT            UTILISATION OF
0,7%. The average deduction for                                        RETIREMENT?                RETIREMENT
administration costs has continued to                                                               BENEFITS
                                                                                                 COUNSELLING?
decrease for all funds over the past
five years, benefiting retirement fund            10.0%                    9.0%                      6.0%
members and demonstrating that
the industry is making progress in its                    33.0%                                  25.0%
                                                                                    45.0%
efficiency drive.
                                                                       46.0%
The COVID-19 pandemic has highlighted            57.0%                                                      69.0%

the importance of employers offering
risk benefits to their employees. The
average deduction to cover the cost                                  Yes       No     Not sure
of life cover within the retirement
funds was 1,51% for stand-alone              However, what we’ve seen in practice over the past year in
funds and 1,2% for umbrella funds,           the Sanlam Umbrella Funds was that the preservation rate
which is aligned with previous years.        has actually increased by 5% overall. We believe one of the
However, considering that group risk         main drivers of the increasing preservation rate has been
experience has been heavily impacted         proactive Retirement Benefits Counselling, where we can see
by the pandemic and there is so much         a significant positive difference in choices members make
uncertainty about the effectiveness of       when counselled, compared to when they don’t receive
the vaccine roll-out, it is likely that we   counselling.
will see this number increase in next        At 94%, it is safe to say almost all stand-alone funds have
year’s research.                             trustee-endorsed strategies in place; among umbrella
A clear trend with regard to stand-          subfunds, a slightly smaller proportion, 85%, have such
alone funds is that since 2015 funds         strategies. It is still surprising that 6% are without such
have increasingly offered additional         strategies given that legislation requires trustee-endorsed
flexible group risk benefits on top of       strategies to be in place.
core benefits, allowing members to           When considering trustee-endorsed annuities, what is
adjust cover that suits their individual     interesting is the shift from living annuities to providing a
needs and financial situation.               combination of different annuities. This is potentially one of
                                             the ways funds are aiming to address various member needs
Default regulations                          through acknowledgement that different types of annuities
                                             would cater for different member needs and preference, as it
One of the key intentions of the             relates to flexibility, affordability, risk appetite and longevity
Default Regulations was to improve           risks in retirement. We have seen a shift from members who
retirement outcomes for members,             potentially would have bought living annuities to rather opt
by considering what would be                 for life annuities, likely as a result of life annuities offering
appropriate and relevant for the             better value given the pricing in 2020.
specific fund’s membership. A lot of
work has been done in the industry           Considering default investment strategies, Lifestage is
to minimise the risk to members. The         still the preferred trustee choice or default for most of the
Default Regulations play a key role          funds, with half opting to offer member choice as well. For
here by focusing on default investment       the subset of union funds, it was interesting to note that
strategies, default preservation,            Single portfolio investment (70%) was more popular than a
annuity strategies and counselling           Lifestage strategy (30%). This is likely because most union
on retirement benefits to improve            funds are invested in smooth bonus portfolios.
member outcomes and behaviours.              Multi-manager strategies continue to dominate. It is
The results we have seen this year           surprising that a pure passive approach is not more popular,
10 BENCHMARK SURVEY 2021 Insights
especially given the specific Over the years our research has covered some of the
requirement in the Default Regulations broader investment themes, namely Regulation 28,
to consider passive management in transformation, and ESG. In our research that looked
constructing the default investment specifically at attitudes to infrastructure investments, we
strategy. It is quite likely though that note that proposed changes to Regulation 28 have resulted
many of the multi-manager strategies in increased awareness of infrastructure as potential
include a passively managed core investments. We are all well aware of the need for better
component. infrastructure for South Africa, and it’s probably something
Increasingly, we are seeing an that retirement fund clients need to be considering more
alignment of the trustee-endorsed seriously.
annuity strategy with the lifestage
investment strategy. For participating Legislation
employers this increased from 43% The industry as a whole has been flooded with legislation
in 2018 to about 60% in 2021, and for and regulations and at times it does feel overwhelming, but
stand-alone funds from 45% in 2015 all this is in the spirit of improving outcomes for members.
to 70% in 2021. When the defaults first
came into effect, funds viewed them Policyholder Protection Rules have been in effect for the
completely separately. Now, funds are past three years and the long-awaited T-Day came into
potentially reviewing them together effect on 1 March. As an industry we are now preparing for
to align members’ pre- and post- POPIA. We expect the onerous requirements and additional
retirement journeys, which is a matter costs of complying with additional legislation will have the
Sanlam highlighted at the Benchmark effect of forcing many stand alone funds to consider the
Symposium in 2016. umbrella environment once again. Part of our research was
to understand the level of awareness that exists with regard
Is your life stage investment to this legislation. Funds appear to be well aware of the
strategy explicitly aligned to requirements imposed on their fund and providers. How this
your Trustee-endorsed annuity awareness is put into practice is what we will keep a close
strategy? eye on in the future.
It is perhaps too soon to tell if the aberrations of 2020 and
2021 will be mere temporary fluctuations that will soon
17.9% be put behind us, or whether they will shape how people,
employers and retirement funds prepare for the future. If
nothing else, what we have experienced over the past 18
2021 59.7%
22.4% months will build on how the industry has evolved and
provide us with the opportunity to reflect and see every day
as a new chance to do better.
24.5%
2019 43.4%
32.1%
25.5%
2018 42.6%
31.9%
Yes No Not sureBENCHMARK SURVEY 2021 Insights 11
Trends in union
funds since 2013
Mkuseli Mbomvu
Executive: Group External Relations
Sanlam Group Market Development
and
Lorraine Mekwa
Development Manager:
Sanlam Corporate Investments
Profile of union funds
We now have eight years of data to analyse since we first included a subset of 10 union funds in the
stand-alone survey. These 10 funds this year represent a total of R109,4 billion in assets in respect of
512 200 members. Since inception, we have observed an increase in the average asset size, which spiked
to just under R11 billion this year (R5,5 billion in 2019). The year-on year participation of the union sample
remains impressive at 80%.
According to Stats SA, South Africa has experienced some GDP growth in the 1Q2021. The graphic below
reflects the industries that contributed to that growth. Despite this improvement in GDP the official
unemployment rate was 32,6% in the first quarter of 2021.BENCHMARK SURVEY 2021 Insights 12
Retirement fund membership is completely reliant on individuals being employed. We have seen
significant volatility in membership, with a sharp reduction from 114 750 (2017) to 27 260 (2018), which
has subsequently doubled to 51 220. Most of the funds have a membership of between 2 000 and more
than 10 000 members.
2021 2019 2018 2017 2016 2015 2014 2013
51 220 27 260 114 750 62 500 53 353 7 670 4 745 5 857
Fund membership
80.0%
70% 70%
60%
60.0%
50% 50% 50% 50%
45.5%
40%
40.0% 36.4%
30% 30% 30%
20%
20.0%
10% 10% 10% 10% 9.1%
0.0% 0% 0% 0% 0% 0%
2021 2019 2018 2017 2016 2015 2014 2013
2 001 to 5 000 5 001 to 10 000 10 001 or more
Changes in contribution levels and costs
Total contribution levels have remained fairly consistent year on year. This year, between 70% and 90%
of employers contribute between 5,1% and 12,5%. Since the inception of this study the total employer
contribution has averaged 9,1%, whereas the majority (60% to 90%) of employees contribute at a rate of
5% to 7,5%, with an average of 6,8%.
The percentage of members’ salary (as a proportion of PEAR) that goes towards the fund’s pure
administration cost, excluding asset management fees, consulting and risk costs, has decreased
significantly from 3,75% (2015) to 0,2% (2021), which seems less than the average of stand-alone
retirement funds (0,56%) in the core study.
3.75%
0.81%
0.62% 0.50%
0.36%
0.20%
2021 2018 2017 2016 20151 2013
Conversely, in those funds that express their administration costs as a fixed rate based on a member per
month, we have seen a significant increase from R26 (2013) to R45 (2021). This year, some of the funds
indicated this fee to be as high as between R70 and R84 per member per month.
This year we have also recorded the highest (90%) incidence of risk benefits being provided as part of
the fund or on an approved basis.
90% 90%
80% 80%
70% 70%
63.6%
50%
2021 2019 2018 2017 2016 2015 2014 2013
Approved: part of the fund Unapproved: Seperate schemeBENCHMARK SURVEY 2021 Insights 13
We have also noted a 1% decrease in the percentage of salaries applied to the total cost of death
benefits/life cover under the fund between 2018 and 2021. This is in line with the industry’s call for cost
efficiencies, which ultimately lead to greater savings towards retirement funding.
2.68%
2.58%
2.25%
1.75% 1.81%
1.56%
1.25%
0.92%
2021 2019 2018 2017 2016 2015 2014 2013
The total cost of disability income benefits (PHI) has averaged 1,2% of salaries over the eight years.
1.42% 1.44%
1.25% 1.25%
1.10% 1.13%
1% 1.05%
2021 2019 2018 2017 2016 2015 2014 2013
Funds are almost equally split in respect of costs covered by the employer.
2021 2019 2017 2016 2015 2014 2013
Base: All Respondents 10 10 0 10 11 10 10
Fixed contribution only (i.e. total cost
to company no additional costs) 50,0% 60,0% 40,0% 45,5% 60,0% 50,0% 50,0%
Fixed contribution plus the cost of
administration and the cost of risk
benefits 50,0% 30,0% 60,0% 54,5% 40,0% 30,0% 40,0%
Death and disability benefits
We have noted a shift in the size of the lump sum payable at death on approved funds, with 2 in 3 funds
providing 3 or 4 times multiple of salary between 2015 and 2019. However, in 2021 we see these popular
multiples decrease to 1 in 3 and more members (40%) opting for flexible benefits. This is significantly up
from 10% in 2018.
The size of the lump sum payable upon disability on approved funds has decreased slightly from 3 times
annual salary in 2015 to a multiple of 2,6 times in 2021.
Multiple of salary on disability
3 3
2.75 2.75 2.7
2.6
2021 2019 2018 2017 2016 2015BENCHMARK SURVEY 2021 Insights 14
A trend we will continue to monitor relates to the size (replacement ratio) of the income benefit payable
upon disability, which was first introduced in this survey in 2019. This implies that more union-based funds
are providing lump-sum capital disability benefits.
2021 2019
Base: All who provide risk benefits 10 10
75% - 79% of annual salary 10,0% 70,0%
85% - 89% of annual salary 10,0% 10,0%
Not sure 30,0% 0,0%
No benefit 50,0% 20,0%
Mean 82 78,25
10 10
Table size 100,0% 100,0%
We tested the extent to which rewards programmes have penetrated the union-influenced retirement
funds. Only 1 out of 10 indicated that they had a benefit with one of the insurance providers. That
respondent was of the view that rewards in a retirement fund context in its current form have very little
value in the lives of members.
Retirement
All funds indicated that the trustee-endorsed annuity strategy was appropriate and effective for their
members and that they monitored outcomes and were satisfied with the utilisation. The majority (8 out
of 10) planned to review the annuity strategy on an annual basis. The funds’ trustee-endorsed annuity
strategy has a very low level of in-fund offering (30%) and external provider (10%) and the majority of
funds do not have a trustee-endorsed annuity strategy.
Investments
The investment strategy of an overwhelming majority of funds, between 50% and 80%, comprises
Trustees’ Choice, i.e. there is no choice for members.
2021 2019 2018 2017 2016 2015 2014
Base: All Respondents 10 10 10 10 11 10 10
Trustees’ Choice, i.e. there is no
choice for members 70,0% 80,0% 50,0% 80,0% 54,5% 80,0% 80,0%
Default investment portfolio, plus
member choice 20,0% 20,0% 50,0% 0,0% 36,4% 10,0% 0,0%
Combination of the above for
different categories of members 10,0% 0,0% 0,0% 20,0% 9,1% 10,0% 10,0%
Table Size 10 10 10 10 11 10 10
100,0% 100,0% 100,0% 100,0% 100,0% 100,0% 100,0%BENCHMARK SURVEY 2021 Insights 15
We asked whether the investment portfolio of the Trustees’ choice/Default comprised a Lifestage
strategy (with portfolio transitioning) or a single-portfolio investment. It was interesting to note that a
single-portfolio investment (70%) was more popular than a Lifestage strategy (30%).
In almost all instances the Trustees’ choice/Default is structured on a Multi-managed (90%) and Single
manager - balanced active (10%).
Asset managers’ performance is benchmarked against CPI.
Each Asset Manager has their own 0.0%
benchmark equity 10.0%
Combination of benchmarks 10.0%
0.0%
CPI-related
60.0%
50.0%
Indices / composite index
30.0%
0.0%
Indices / composite portfolio benchmark
30.0%
Industry survey / peer group 0.0%
0.0%
10.0%
2019 2021
We asked respondents to which extent their fund would invest in infrastructure investments as made
available by the proposed changes to Regulation 28. Close to half (40%) of the funds indicated that it
was a decision that would be taken by the investment manager. Regarding current investments in impact
investing, union funds responded that on average they currently have an exposure of 3,6% of total AUM.
Impact investing
50%
30%
20%
0% 1% - 10% Not sure
Current exposure to ESG portfolios was slightly higher, averaging just under 10% of assets. Of the funds
with current investments in ESG portfolios, two indicated that they have more than 20% invested in ESG
portfolios.BENCHMARK SURVEY 2021 Insights 16 Special Topics Changes in member behaviour More than half (60%) of the respondents indicated that since the implementation of default regulations, they have noticed an improvement in member behaviour with regard to preservation on withdrawal. Just under half (40%) reported observing improvement in member behaviour with regard to annuitisation at retirement. More members have also started to make use of retirement benefits counselling where this is provided. Half of the funds that reported a lack of improvement in member behaviour with regard to preservation on withdrawal attributed it to members’ lack of understanding or knowledge of various options available on exit. One in three members have cash-flow challenges and are therefore only interested in taking the withdrawal benefit in cash. Similarly, the lack of improvement in member behaviour with regard to annuitisation at retirement was also attributed to members’ lack of understanding or knowledge of options available (40%), as well as members wanting to have access to their retirement benefits in cash (40%). The FSCA released the Smoothed Bonus Conduct Standard in October 2020, which sets out the conditions that Smoothed Bonus portfolios need to comply with in order to form part of a retirement fund’s default investment strategy. Half of the funds that offer Smoothed Bonus portfolios had received information from their insurer regarding their compliance with this revised requirement. Some funds (40%) believed that the enhanced disclosure required by the Conduct Standard made having a Smoothed Bonus portfolio more attractive as an investment option. Retirement Benefits Counselling Retirement benefits counselling was first introduced in 2018. Not all stand-alone funds have provided access to such facilities yet. Of those funds that are planning to implement this, 90% are of the opinion that the fund administrator will be providing retirement benefits counselling. It is interesting that written communication is still the preferred medium (70%) of delivery, with less than half (40%) stating that technology solutions, e.g. WhatsApp, interactive videos and online portals will be used. Written communication will be in the form of email or via the fund’s website, and newsletters are still considered appropriate for retirement benefits counselling. Funds believe they can easily reach three quarters of their membership with this medium. Healthcare Integration Almost half (40%) of the funds believe a holistic integrated health and financial wellness programme delivers higher productivity and staff happiness, whereas 10% of employers integrate some programmes but manage others independently. They have implemented a type of hybrid application to integrated health and financial wellness. One in five funds believes its responsibility to employees’ health is limited to the obligatory legal requirements. Advice Since 2013 about half of the funds have indicated that they have a formalised strategy for rendering financial advice to active members. The majority (60%) of these funds refer members to the preferred financial advisor made available by the fund or employer. One in five funds offers advisory services to members by way of an advisor paid for or subsidised by the fund, i.e. a salaried advisor. For the balance of the funds, financial advisory services are provided to members by way of an advisor charging a negotiated special fee, i.e. a reduced advice fee. Most (80%) funds provide advice mainly at retirement, followed closely by withdrawal and when members join the fund. There is some concern about only 1 in 5 members receiving advice when he or she elects to make an investment switch. Those who don’t have a strategy simply indicated that the fund did not wish to take on the responsibility or liability of enabling financial advice. Impact of COVID-19 One of the impacts of COVID-19 was that a number of funds have reviewed their existing risk benefits provision. The majority (90%) of funds have increased their group insurance. During this time only 1 in 5 experienced a rate increase, with 10% actually experiencing a slight decrease in the group insurance rate.
BENCHMARK SURVEY 2021 Insights              17

Given the financial pressure experienced all round, it was not surprising that 70% of funds suspended
retirement fund contributions due to COVID-19 for an average of 5,4 months.
The biggest concern at this time was naturally the financial impact of the lockdown on members. The real
scare was the fact that some members endured multiple effects as reflected in the table below.

                                                                                                      2021
Base: All Respondents                                                                                    10
Retrenchments at the workplace                                                                       90,0%
Reduction in pay                                                                                     90,0%
Reduction in annual increases                                                                        30,0%
Enforced sabbaticals without pay                                                                     60,0%
Liquidation of the employer                                                                          60,0%
No impact                                                                                            10,0%
                                                                                                        34
Table Size                                                                                         340,0%

Most companies have had staff working remotely since the start of the pandemic. The risk of cyber
security has increased for at least 1 in 3 funds.
Regulations
There are a number of regulatory requirements with which funds have to comply.
Policyholder Protection Rules
Half of funds indicated that they are aware of the requirements of the Policyholder Protection Rules
(PPRs) when changing group risk cover between insurers. Naturally, the concern is about the half that are
not completely aware of the stringent requirements. The reason is probably because 90% of funds have
not changed insurers in the past 12 months. Most members across the board are communicated with by
the fund (70%) or the fund and insurer (30%).
T-Day
Most funds (80%) believed that T-Day will not impact the way the funds structure their group risk
benefits, e.g. moving from approved to unapproved benefits for lump-sum disability cover. All members
are able to view their respective vested and non-vested components online (10%) or via their member
statements (100%). About half of the funds communicated the impact of T-Day to members either via
the fund administrator (40%), Human Resources or Employee Benefits department (20%) or did not
provide communication to members at all (40%).
 It seems that all the funds that communicated about the impact of T-Day had opted for email as their
communication medium.
Protection of Personal Information Act (POPIA)
Almost all funds (90%) were aware of the requirements of the Protection of Personal Information Act
(POPIA) on the fund and service providers, e.g. consultant, administrator, insurer etc. Most funds intended
to rely on consultants to monitor across providers and would require compliance reports in the Board
pack. Only 1 in 5 would actually employ specialist skills to deal with the requirements of POPIA.
While union fund experience tends to largely mirror that of other stand-alone funds, there are a few
notable differences, which have been highlighted in this report. The drive to ensure desired financial
retirement outcomes for all members lies at the heart of each fund regardless of differences in fund or
benefit structures. As a collective, each fund aims to attain the best possible retirement outcome in line
with the management board’s fiduciary responsibility.
BENCHMARK SURVEY 2021 Insights 18
How much are
members saving
for retirement
Danie van Zyl
Head: Smoothed Bonus Centre
of Excellence
Sanlam Corporate Investments
Pensionable salary and retirement savings
For the majority of our South African retirement fund members,
their contribution to their retirement fund consists of two
components, namely an employer and employee contribution
based on their pensionable salary. The employer/employee
contribution distinction is mostly due to historical
differences in how the employer and employee contributions
were previously handled in calculating a member’s income
tax.
Most employers (56%) continue to operate on a total-cost-
to-company basis. A smaller number of funds (34%) report
that the employer also pays the cost of administration and risk
benefits in addition to the employer contribution to the retirement
fund.
Pensionable salary is the income used by an employer to calculate a
member’s retirement fund contribution. This will typically include any fixed remuneration, such as salary
or wages, but may exclude variable amounts such as commission, bonuses or overtime. For ease of
comparison, all figures on the next page refer to pensionable salary (also known as PEAR).
Employer and employee contributions
The average employer contribution, as a percentage of salary, was 10.84% — the highest figure we
have seen since 2015. In this year’s survey, 6% of funds reported that the employer does not make any
contribution to retirement funding. In all likelihood these employers remunerate staff on a cost-to-
company basis and all contributions to a retirement are viewed as employee contributions.
The average employee contribution rate remained steady at 6.62% of salary (similar to the 6.63% in 2019).
Twelve per cent of funds indicated that their members do not make employee contributions to a retirement
fund, with all contributions deemed to be employer contributions. The total contribution towards
retirement funding for small funds (with fewer than 500 members) continues to exceed that of the very
large, mainly blue-collar, funds (with more than 10 000 members).BENCHMARK SURVEY 2021 Insights 19
Average over past three years Average over past
five years
All stand-alone Funds with more Funds with fewer All stand-alone
funds than 10 000 than 500 funds
members members
Employer contributions 10.26% 9.67% 10.42% 10.37%
Employee contributions 6.31% 6.86% 6.77% 6.81%
Total retirement 16.57% 16.52% 17.20% 17.17%
contribution
The impact of COVID-19
The COVID-19 pandemic has not only impacted the lives and livelihoods of members, but for many also
their retirement provision. Twenty-seven per cent of funds indicated that they had suspended retirement
fund contributions during 2020 due to the financial impact of the virus. On average this was for 4,5 months,
although two funds indicated that they had suspended contributions for a year or more.
Administration costs
Most funds continue to express their administration expenses as a percentage of a member’s salary (49% of
funds), while a further 38% of funds, mainly those with more than 10 000 members, expressed this cost as a
fixed rand amount per member per month. Only 2% of funds expressed their administration expenses as a
percentage of the fund’s assets, which is more in line with the charging model in the retail savings market. A
further 11% of funds use a combination of the above.
A fixed-rand-per-member approach implies the lowest level of cross-subsidy between members, but this
is one instance where Sanlam believes cross-subsidisation may be preferred. The fixed-rand-per-member
costs weigh more heavily as a percentage reduction on small salaries and have a much smaller effect on
large salaries. Funds that use this method of cost recovery lose any administration expense cross-subsidy
between higher-paid and lower-paid workers.
For those funds deducting a percentage of salary for administration, the average deduction amounted to
0,55%, broadly in line with the result over the past three years, while the average fixed fee per member for
standard members amounted to R52.30 a month. Five funds indicated that they pay in excess of R90 per
member per month.
As in previous years, members of very large funds (more than 10 000 members) benefit from economies
of scale and pay a lower administration fee (0,4%) compared to members of smaller funds (fewer than
500 members) who pay on average 0.69%. Expressed as a fixed fee per member, this varies from R38.02 a
month for very large funds to R59.10 a month for smaller funds. The average deduction for administration
has continued to decrease for all funds over the past five years, benefiting retirement fund members.
Average over past three years Average over past
five years
All stand-alone Funds with more Funds with fewer All stand-alone
funds than 10 000 than 500 funds
members members
Deduction for 0.56% 0.48% 0.72% 0.70%
administration costs
Group risk costs
Forty-seven per cent of employers provide risk benefits (group life and disability cover) via their retirement
fund (so-called approved risk benefits), while 16% provide these benefits under a separate scheme
(unapproved benefits). The bulk of the remainder (36%) provides benefits both via the retirement fund and
separate scheme. The average deduction to cover the cost of life cover within the retirement funds was 1.51%.BENCHMARK SURVEY 2021 Insights 20
Infrastructure –
Investing with
purpose
Darryl Moodley
Head: Tailored Investments
Sanlam Corporate Investments
Humankind has been At the same time, there’s been a rapid increase in our
population, from 2 billion in the 1930s to almost 8 billion in
very fortunate to have 2021, coupled with an increase in GDP by a factor of roughly
lived through a period 40 over this same period. This has invariably led us to
progressively push closer to the boundaries of planet Earth.
of sustained economic The material footprint of our production has increased by
growth since the an estimated 40 times as a result of the need to meet the
demands of the surging population size. Agricultural land
Agricultural Revolution. use has increased by 30%, and to provide energy for our
This economic progress lifestyles our use of non-renewable and polluting natural
resources (such as coal, oil, gas) has increased by eight
has allowed us to times. This increase in consumption coupled with a similar
make unprecedented increase in input use has transformed the face of our planet
and has given rise to well-documented side-effects and new
improvements in challenges.
consumption, health, Reference is often made to the megatrends of our time,
education, technology and including rapid urbanisation, demographic and social
change, shifting economic power, technological change,
in addressing inequality and of course climate change. These are some of the trends
– although arguably with that continue to shape conversations globally. South Africa
in particular has been slow to address these trends. It is
varying levels of success. this backdrop that has led asset managers, as custodians
of capital, to increasingly be pulled into debates on the
evolution of capitalism, the role of capital markets, and
addressing the social challenges or megatrends into the
future.
The struggle years
The 1980s are often referred to as the struggle years in South
Africa, and that they certainly were. Under the leadership of
the apartheid government at the time, South Africa movedBENCHMARK SURVEY 2021 Insights 21
firmly out of the ranks of the West and into the club of failing African economies — especially serious
was the collapse of the savings rate, ailing infrastructure and the skewed distribution of share ownership
on the JSE. For individuals, the 1980s was considered to be a lost decade as per capita incomes in 1990
were lower than in 1980 after falling in 6 out of 10 years.
And all of this when sanctions were imposed against South Africa and protectionist sentiments were
well entrenched in the industrial sector. There’s no doubt that we’ve made incredible progress as a nation
in many respects, particularly on the human rights front, but there is a perception that many of the
economic gains of the past 40 years are slowly being reversed.
GDP per Capita in SA
Lost decade
GDP per Capita (US$)
Lost decade
1970 1980 1990 2000 2010 2019
Source: World Bank
Infrastructure as an investment
There is no doubt that the biggest crisis South Africa currently faces is the economic fallout of COVID-19.
The pandemic has magnified many harsh realities in South Africa, namely those of poverty, high levels of
inequality and unemployment, and rapidly aging infrastructure. Inadequate infrastructure, in particular,
remains a major obstacle towards South Africa achieving its economic growth potential — and our
government has rightly identified meeting the demand for key infrastructure as a priority and potential
panacea to dealing with our wider societal problems.
But unlike investing in listed stocks or bonds, the amazing characteristic of infrastructure investments
is that you are building something tangible from scratch. At its very core, it’s about procuring land,
sourcing materials, hiring people who would likely have been unemployed, contracting various suppliers
in the value chain, professionals, architects, engineers, lawyers, and others. It really is the very essence of
creating economic activity and espousing confidence when you put up infrastructure assets. And once
these are up and running, it makes economic activity easier by reducing frictional costs. This is one of the
investment themes that generate not only good financial returns for investors but also improve society’s
productive capacity.
Continued Underinvestment
35
TARGET 30%
% GDP
25%
20%
15%
10%
%
0
1960
1962
1964
1966
1968
1970
1972
1974
1976
1978
1980
1982
1984
1986
1988
1990
1992
1994
1996
1998
2000
2002
2004
2006
2008
2010
2012
2014
2016
2018
Private business enterprises General government Public corporations NDP target
Source: SARB, Intellidex calculationsBENCHMARK SURVEY 2021 Insights 22
Worryingly, it is estimated that South Africa will have a R1,7 trillion infrastructure funding shortfall over the
next 10 to 15 years over 276 different initiatives ranging from water, transport and energy to agriculture.
The need for infrastructure investment and development has not gone away. In fact, it is more apparent
than ever. Although backlogs continue to be a concern and a political priority, a more critical issue is
that of the condition of South Africa’s existing infrastructure assets, much of which are nearing, or have
reached, the end of their useful lives.
Our energy infrastructure is just one glaring example. Apart from the regular bouts of load-shedding
linked to productive capacity and energy availability, solving the decarbonisation challenge will be critical
for South Africa’s competitiveness in the global context. And this would require huge infrastructure
investments in South Africa — both public and private — to navigate that decarbonisation pathway.
There’s no doubt that being an emerging economy we expect to have more carbon headroom to grow
our economy, but according to the Paris Agreement we have just three decades to decarbonise the
global economy. And South Africa is currently the 12th-largest greenhouse gas emitter in the world, being
roughly double the world average in per capita terms. Locally, we boast being home to Sasol’s Secunda
complex, which is acknowledged to be the single largest point-source of greenhouse gases on the planet.
Our renewable energy independent power producer programme is, however, a step in the right direction. It
has been globally hailed as a massive success after already catalysing over R200 billion in investments. And
with more rounds of projects being approved, this is expected to add significant capacity to the sustainable
energy mix in South Africa. This further increases the number of bankable infrastructure opportunities
available to investors — something which has long been highlighted as a problem for this asset class.
Appropriateness for retirement funds
Now this infrastructure funding gap that I referred to presents a tremendous opportunity for long-term
investors — such as retirement funds — to step in to fill the void. Long-term infrastructure assets could
provide retirement funds with a perfect “long-term hedge’ as well as offer attractive risk-adjusted returns
if managed well.
But, from the perspective of asset managers, it is important to recognise that they are not the owners
of the assets being managed, they are merely stewards. Retirement funds and the underlying members
actually own the assets. Asset managers simply execute on their needs and their strategies. They inform
clients on ideas and clients give them permission to do things on their behalf.
While the asset management industry generally believes infrastructure investments can be leveraged
to catalyse economic growth in South Africa, it does appear to be a sentiment seemingly shared by the
respondents in our 2021 Benchmark survey. For example, stand alone retirement funds indicated they will
invest on average 6,6% of their fund assets into infrastructure, with participating employers of umbrella
funds indicating an allocation of around 4,7%. The obvious question is: Is this enough? Will the industry
find itself on the right side of history with this level of investment?
Investment in Infrastructure
Standalone Funds Umbrella Funds
25 25
20 20
% of respondents
% of respondents
15 15
10 10
5 5
0 0
0% 1% - 10% 11% - 20% 21% - 30% 31% - 45% 0% 1% - 10% 11% - 20% 21% - 30% 31% - 45%
Mean: 6.6% Mean: 4.7%You can also read