Compound Extremes of Air Temperature and Precipitation in Eastern Europe
←
→
Page content transcription
If your browser does not render page correctly, please read the page content below

climate
Article
Compound Extremes of Air Temperature and Precipitation in
Eastern Europe
Elena Vyshkvarkova *                 and Olga Sukhonos

                                          Institute of Natural and Technical Systems, 299011 Sevastopol, Russia
                                          * Correspondence: aveiro_7@mail.ru

                                          Abstract: The spatial distribution of compound extremes of air temperature and precipitation was
                                          studied over the territory of Eastern Europe for the period 1950–2018. Using daily data on air
                                          temperature and precipitation, we calculated the frequency and trends of the four indices—cold/dry
                                          (CD), cold/wet (CW), warm/dry (WD) and warm/wet (WW). The connection between these indices
                                          and large-scale patterns in the ocean–atmosphere system, such as the North Atlantic Oscillation
                                          (NAO), the East Atlantic (EA) and Scandinavia (SCAND) patterns, was also studied. The positive
                                          and statistically significant trends in the region were observed for the warm extremes (especially the
                                          WW index) in all seasons, with maximum values in the winter season, while negative trends were
                                          obtained for the cold extremes. The NAO index has a strong positive and statistically significant
                                          correlation with the warm compound indices (WD and WW) in the northern part of Eastern Europe
                                          in winter like the EA pattern, but with smaller values. The spatial distribution of the correlation
                                          coefficients between compound extremes and the SCAND index in the winter season is opposite to
                                          the correlation coefficients with the NAO index.

                                          Keywords: compound extremes; temperature; precipitation; Eastern Europe; trends; teleconnection
                                          patterns

Citation: Vyshkvarkova, E.;
Sukhonos, O. Compound Extremes of
Air Temperature and Precipitation in      1. Introduction
Eastern Europe. Climate 2022, 10, 133.         Simultaneous or consecutive occurrences of several extreme phenomena (events) in
https://doi.org/10.3390/cli10090133       climatology are referred to as compound extreme events. Over the last decade, these events
Academic Editor: Mário                    have been attracting the attention of the scientific community due to their increased impacts
Gonzalez Pereira                          on nature and society [1–6]. Extreme precipitation and temperature values, which are two
                                          of the key variables in climatology and hydrology, are multidimensional phenomena, and
Received: 21 July 2022
                                          they can occur at different synoptic periods (e.g., blocking anticyclones with droughts
Accepted: 1 September 2022
                                          and heatwaves) [7,8]. Changes in temperature and precipitation are often physically linked;
Published: 5 September 2022
                                          for example, droughts and heatwaves in 2003 and 2015 in Europe, in 2010 in Russia, and
Publisher’s Note: MDPI stays neutral      2012–2014 in California. These events featured extreme temperature and precipitation (the
with regard to jurisdictional claims in   lack of thereof) that resulted in significant casualties and economic effects [9–13]. In a changing
published maps and institutional affil-   climate, a change in the frequency of compound extremes is likely if the component of the
iations.                                  extreme has a tendency; for example, an increase in surface air temperature can lead to an
                                          increase in compound extremes including it [14].
                                               Extreme temperature and precipitation are considered independently using one-
                                          dimensional statistical methods [15–19]. There are several approaches to the analysis of
Copyright: © 2022 by the authors.
                                          compound extremes [20]. The statistical methods include the following [20]: empirical, mul-
Licensee MDPI, Basel, Switzerland.
                                          tivariate distribution [21,22], indicator approach [23], quantile regression [24], and Markov
This article is an open access article
                                          chain model [25]. The empirical approach to the analysis of compound extremes is man-
distributed under the terms and
conditions of the Creative Commons
                                          ifested in the calculation of the number of simultaneous or consecutive occurrences of
Attribution (CC BY) license (https://
                                          several extremes. Beniston [26] suggested using the combination of air temperature and
creativecommons.org/licenses/by/          precipitation values exceeding the set thresholds (the 25th and 75th percentiles) in the em-
4.0/).                                    pirical analysis of compound extremes. The joint distribution of the two weather variables

Climate 2022, 10, 133. https://doi.org/10.3390/cli10090133                                                        https://www.mdpi.com/journal/climate
Climate 2022, 10, x FOR PEER REVIEW 2 of 17
Climate 2022, 10, 133 2 of 16
empirical analysis of compound extremes. The joint distribution of the two weather vari-
ables like the temperature and precipitation is a rational indicator of weather conditions
and their
like the stability [27,28].
temperature Compoundisdistributions
and precipitation reflect of
a rational indicator weather
weather conditions
conditionsbetter than
and their
the statistics for the temperature or precipitation alone [4,28]. The study
stability [27,28]. Compound distributions reflect weather conditions better than the statistics of compound
extremes
for using thisortechnique
the temperature precipitationwasalone
carried outThe
[4,28]. for study
manyof regions,
compoundsuchextremes
as Northusing
America
this
[29–31], China
technique [32], India
was carried out [33], some regions,
for many parts of such
Europe (Spanish
as North mountains,
America Serbia,
[29–31], China central
[32],
Europe)
India [34–37],
[33], some Australia [38] and(Spanish
parts of Europe on the global scale [39].
mountains, Serbia, central Europe) [34–37],
Air temperature
Australia [38] and on the andglobal
precipitation
scale [39].variability and their extremes in the European re-
gionAiraretemperature
affected by interannual large-scale
and precipitation circulation
variability patterns
and their in thein
extremes ocean–atmosphere
the European re-
system,
gion such as by
are affected theinterannual
North Atlantic Oscillation
large-scale (NAO)
circulation [40], the
patterns in East Atlantic pattern (EA)
the ocean–atmosphere sys-
[41,42],
tem, suchtheas Scandinavia pattern
the North Atlantic (SCAND)(NAO)
Oscillation [41,43], and
[40], thethe East
East Atlantic/West
Atlantic Russia
pattern (EA) pat-
[41,42],
the
ternScandinavia
(EA/WR) [41]. pattern (SCAND)
The impacts [41,43],
of these and the
patterns wereEast Atlantic/West
covered Russia pattern
by many researchers from
(EA/WR) [41]. The
different regions ofimpacts
the world of these
[44,45].patterns
Analysis were covered
of the by many
influence researchers
of the large-scalefrom dif-
circula-
ferent regions on
tion patterns of the world [44,45].
compound extremes Analysis of the out
was carried influence
for theofregions
the large-scale circulation
of Switzerland [27],
patterns on compound
the highlands extremes wasbasin
of the Mediterranean carried
[46],out
andforChina
the regions
[32,47].ofUnderstanding
Switzerland [27],the the
fre-
highlands
quency ofofoccurrence
the Mediterranean basincauses
and possible [46], and China [32,47].
of compound Understanding
extremes thedeveloping
will allow frequency
of occurrence
strategies and possible
to reduce causes of compound
their dangerous extremes
impact on society will
and allow developing strategies
ecosystems.
to reduce their of
The goal dangerous
this workimpact on society
is to analyze theand ecosystems.
compound extremes of air temperature and
The goal in
precipitation of Eastern
this work is to analyze
Europe the compound
for the period 1950–2018, extremes of studying
as well as air temperature and
the connec-
precipitation in Eastern Europe for the period 1950–2018, as well
tion between these indices and large-scale patterns in the ocean–atmosphere system. as studying the connection
between these indices and large-scale patterns in the ocean–atmosphere system.
2. Materials and Methods
2. Materials and Methods
2.1. Сlimatic Characteristics of the Study Region
2.1. Climatic Characteristics of the Study Region
The study region (Figure 1) includes the large part of Eastern Europe (25–45° E, 42–
The study region (Figure 1) includes the large part of Eastern Europe (25–45◦ E, 42–61◦ N).
61° N).
Figure1.
Figure 1. The
The study
study region
region (purple
(purple rectangle).
rectangle). Numbers
Numbers correspond
correspondto
tothe
the countries
countriesincluded
includedin
inthe
the
study region: 1—Estonia, 2—Latvia, 3—Lithuania, 4—Belarus, 5—Ukraine, 6—Moldova, 7—Roma-
study region: 1—Estonia, 2—Latvia, 3—Lithuania, 4—Belarus, 5—Ukraine, 6—Moldova, 7—Romania,
nia, 8—Bulgaria,
8—Bulgaria, 9—Georgia,
9—Georgia, 10—Russia.
10—Russia.
The region
The region isis characterized
characterizedby byaavariety
varietyofofclimatic
climaticconditions.
conditions. In In the
the north
north ofof the
the
European part of Russia, the continental climate prevails. Marine
European part of Russia, the continental climate prevails. Marine air masses cause mildair masses cause mild
winterswith
winters withfrequent
frequentthaws
thawsand andmoderately
moderately warm,
warm, sometimes
sometimes cool
cool summers.
summers. TheThe aver-
average
age temperature
temperature in January is −8 .is. .−8…
in January ◦ C;°C;
−11−11 in July,
in July, +16 +16… ◦ C.°C.
. . . +19+19 TheThe amount
amount of precipita-
of precipitation
tionyear
per per isyear is 600–700
600–700 mm. To mm.
the To the there
south, south,isthere is an increase
an increase in the air
in the average average air temper-
temperature and
aature
decrease
and aindecrease
the amount of precipitation.
in the The climateThe
amount of precipitation. of the Central
climate Federal
of the District
Central Federalof
Russia
Districtisof
temperate
Russia iscontinental, the averagethe
temperate continental, temperature in January isinfrom
average temperature −7 to
January is − 14 ◦ C;
from −7
in July—from +16 to +22 ◦ C. Precipitation falls 500–600 mm per year. The rainiest time is
the end of summer and autumn [48].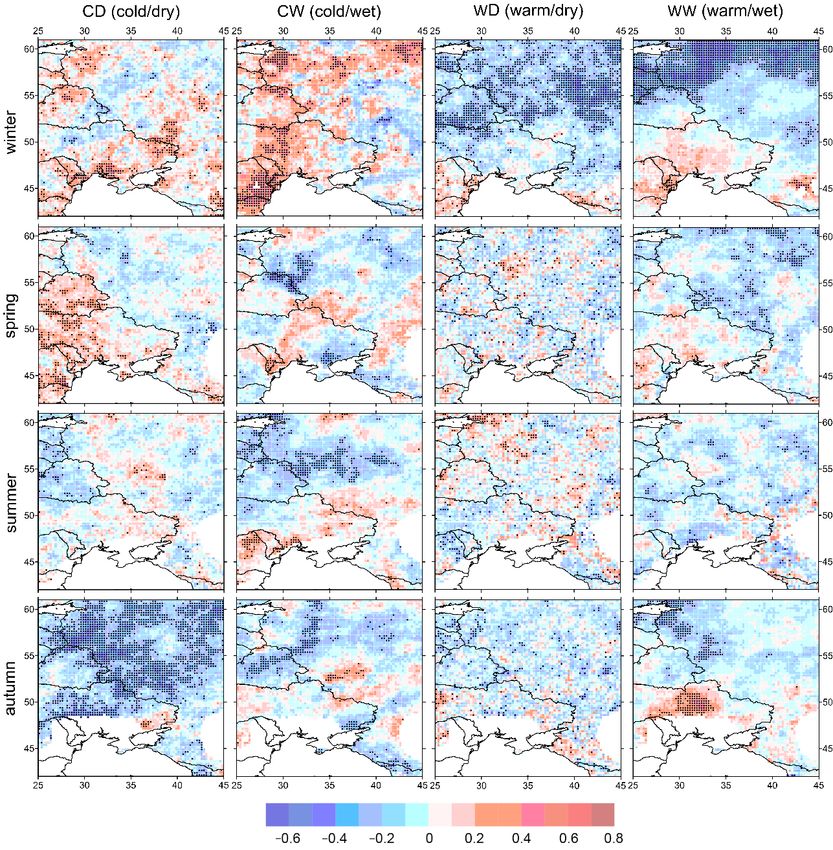
Climate 2022, 10, 133                                                                                             3 of 16

                              The territory of the south of the European part of Russia can be conditionally divided
                        into three parts: flat, foothill and mountainous. They differ in their topography, climate,
                        soil and vegetation. In most of this area, the climate is temperate continental. In this regard,
                        the climate is characterized by warm and long summers—the average July temperature
                        ranges from +20 ◦ C to +24 ◦ C. The average January temperature ranges from −5 ◦ C to
                        −2 ◦ C. The average annual precipitation decreases from 400 to 600 mm in the west to
                        200–400 mm in the east [49,50].
                              The subtropical type of climate is characteristic of the Black Sea coast of the Caucasus.
                        The spurs of the Caucasus Mountains protect the coast from the penetration of cold air
                        masses from the East European Plain in winter. The average January temperature in this
                        area is positive. Summer is warm and long. The average temperature in July is between
                        +22 ◦ C and +26 ◦ C. The climate of the coast is both warm and humid. On average, the total
                        precipitation is about 800 mm, which is a relatively even distribution throughout the
                        year [51].
                              The western coast of the Black Sea (the territory of the countries of Bulgaria, Romania
                        and Moldova) is one of the driest in Eastern Europe, with a total precipitation below
                        300 mm per year in some areas, especially at the confluence of the Danube into the Black
                        Sea [52]. Annual rainfall reaches 700 mm per year in the south of the region. Average
                        monthly air temperatures throughout the year are predominantly positive, especially in the
                        south, with maximums up to +24 ◦ C in July or August and minimums in January (–2 ◦ C to
                        +2 ◦ C) [53].
                              Ukraine is characterized by noticeable climatic differences across the country. The ter-
                        ritory of Ukraine is located in the temperate continental climate zone. The average temper-
                        ature of the coldest month (January) is negative (from −7.5 ◦ C to −2 ◦ C), the average tem-
                        perature in July ranges from +17.5 ◦ C to +22 ◦ C [49]. Precipitation is unevenly distributed,
                        large amounts fall in the west (the region of the Carpathian Mountains with precipitation
                        up to 1600 mm per year) and north (700–750 mm per year), in smaller quantities—in the
                        east and southeast (300–350 mm per year). Winters vary from cool along the Black Sea to
                        cold in the interior of the country, summers are warm in most of the country and hot in the
                        south [54].
                              The climate of Latvia and Estonia is maritime and humid, with cool summers and
                        moderate winters [55]. The average annual air temperature in Latvia ranges from +4.9
                        to +7.1 ◦ C for the period 1961–2010, which is due to the influence of continentality and
                        remoteness from the Baltic Sea. The average annual rainfall varies from 576 to 757 mm.
                        The least amount of precipitation occurs in the spring, and the most in the summer [56].
                        The average annual temperature in Estonia is 6.4 ◦ C, and the average precipitation is about
                        667 mm per year [57]. Lithuania is characterized by a transitional climate from maritime to
                        continental, with humid and temperate summers and winters [58].
                              Belarus is characterized by a temperate continental climate with cold winters and cool,
                        rainy summers. The average air temperature ranges from +6.4 ◦ C in the northeast to +7.7 ◦ C
                        in the southwest. The average January temperature is around –4 ◦ C, and the average July
                        temperature is around +19 ◦ C. The average annual rainfall range is 600–750 mm. About
                        70% of precipitation falls during the warm season [59].

                        2.2. Data and Methods
                             In this work, we used the data on daily average surface (2 m) air temperature and
                        precipitation amounts over the period of 1950–2018 in Eastern Europe. The data were taken
                        from the reanalysis E-obs 20.0 (with a spatial resolution of 0.25◦ × 0.25◦ ) [60]. This dataset
                        is based on observations from over 20,000 meteorological stations across Europe. The data
                        availability maps showed enough data at the grid nodes (more than 80%) over the period
                        1950–2018.
                             To characterize compound extremes, combined air temperature and precipitation
                        indices were used [26]. The cold/wet (CW) index was calculated as a combination of
                        the number of days with the average temperature below the 25th percentile (T25) and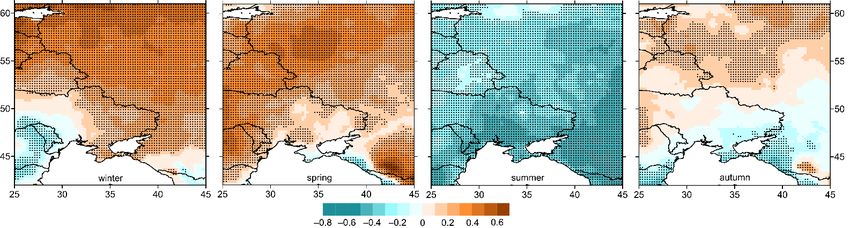
Climate 2022, 10, 133                                                                                           4 of 16

                        the daily precipitation amount higher than the 75th percentile (R75) at the same time.
                        The same procedures were applied to calculate other indices, such as the cold/dry days
                        (CD—T25/R25), warm/dry days (WD—T75/R25), and warm/wet days (WW—T75/R75).
                        We use 25th and 75th percentiles to identify a large number of compound extreme events for
                        air temperature and precipitation [26]. These percentiles characterize moderate extremes.
                              The threshold values for air temperature and precipitation were calculated based
                        on daily data for each of the seasons over the base climate period of 1961–1990 at each
                        node of the regular grid. The precipitation percentiles were determined from daily data.
                        Precipitation time series have used precipitation values above 1 mm. The compound
                        temperature and precipitation extreme were identified if the specific extremes occurred
                        on the same day in 1950–2018. After that, the total number of such coincidences per
                        month/season/year was counted. Calculations were performed for all seasons. Winter
                        corresponds to January and February of the current year, and December of the previous
                        year. The results are presented for each reanalysis point in the form of raster maps without
                        spatial interpolation.
                              To analyze the correlations between the compound extreme indices and circulation
                        patterns, the North Atlantic Oscillation, East Atlantic pattern, and Scandinavia pattern
                        over the period of 1950–2018 were used. The indices were taken from the Climate Explorer
                        website (https://climexp.knmi.nl, access on 8 March 2022).
                              The values of linear trend coefficients were determined using the least-squares method.
                        The non-parametric Mann–Kendall test was used to obtain the statistical significance
                        of trends (with a significance level of 95%). The Pearson’s correlation coefficient was
                        calculated, and its statistical significance using Student’s criterion (95% significance) was
                        obtained between compound extremes indices and circulation patterns.

                        3. Results
                        3.1. Frequency of Compound Indices
                              The total number of days with index CD in winter for most of the region is in the inter-
                        val 50–100 with an increase of up to 150 days for the entire study period in the north of the
                        region and on the western coast of the Black Sea (Figure 2). An increase of the compound ex-
                        treme index is noticeable in high-mountainous regions—the Carpathians, and the Crimean
                        and Caucasian mountains (up to 250 days). The CW (cold/wet) combination occurred up
                        to 50–100 days for the whole period. The compound WD index above 50 latitude reaches
                        250 days. The WW index has the highest values in the winter season; in the north of the
                        region, its values reach 450 days for the period 1950–2018.
                              The number of days with the compound air temperature and precipitation extremes
                        in spring is lower than in winter. The total number of days with indices CD and WW
                        reach 200–250 days in the northern regions of the study region. At the same time, the CW
                        and WD indices have values no higher than 100 days, with the exception of the Caucasus
                        Mountains region, where an increase of up to 250 days is observed.
                              In the summer season, the greatest number of days is typical for the cold-dry com-
                        bination (index CD) in the northern regions, where the sum of days reaches 250 days.
                        The CW index in most of the study region is in the interval of 100–200 days, an increase
                        of compound extremes is observed in the region of the Caucasus Range (up to 300 days).
                        The sum of days with the WD index for the most of the region does not exceed 150 days
                        with an increase to 250 in the highlands of the Carpathians and the Caucasus. The WW
                        index increases from southeast to northwest from 50 to 200 days over the period 1950–2018.
                              The distribution of the CD index in the autumn season is similar to that in the summer
                        season. The sum of days of the CW index does not exceed 100 days per season throughout
                        the region, with a slight increase on the Black Sea coast of the Caucasus (up to 250 days).
                        The number of days with the CW index increases in a northerly direction and reaches
                        200 days. The sum of the WW index also increases northward, but with larger values
                        relative to the CW index. In the northern regions, the number of days with warm and wet
                        conditions reaches 300 days.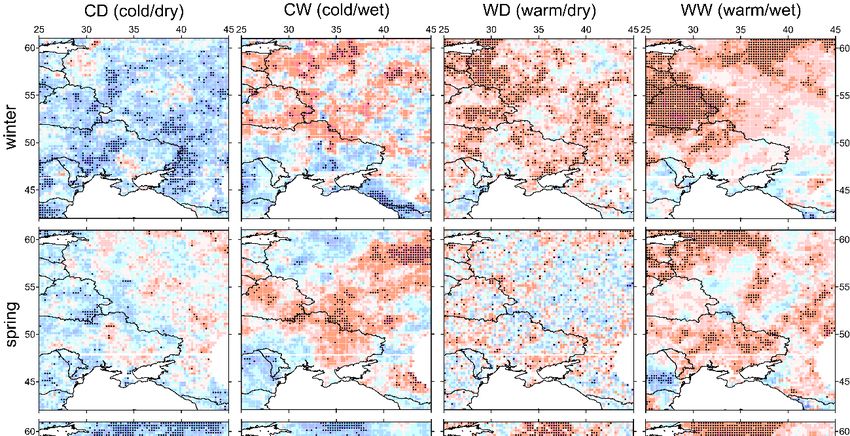
Climate 2022, 10, 133
x FOR PEER REVIEW 5 5of
of 17
16
Figure
Figure 2.
2. The
Thespatial
spatialdistribution
distributionofof
total number
total of days
number with
of days compound
with air temperature
compound and pre-
air temperature and
cipitation extremes over the period 1950–2018.
precipitation extremes over the period 1950–2018.
In
Zhouthe and
summer season,
Liu [47] the greatest
showed number ofbetween
that correlations days is typical for theand
temperature cold-dry combi-
precipitation
nation
(positive(index CD) in the
or negative) have northern
a directregions,
impact on where the sum ofofdays
the likelihood reaches climate
compound 250 days. The
events
CW index the
occurring: in most of the
stronger thestudy region the
correlation, is in the interval
higher of 100–200
the probability of adays, an increase
compound of
extreme.
compound extremes is observed in the region of the Caucasus Range
Therefore, we built correlation maps of monthly air temperature and precipitation in all (up to 300 days). The
sum of days
seasons with3).theInWD
(Figure index
winter, theforpositive
the most of the region
statistically does not
significant exceed 150
correlation is days with
typical to
an increase to 250 in the highlands of the Carpathians and the Caucasus.
the south of European Russia (excluding the North Caucasus), the southeast regions of The WW index
increases
Ukraine and fromall southeast to northwest
of the region from 50
to the north oftothe20052days over latitude.
degrees the periodWhile
1950–2018.
negative
The distribution
statistically significantofcorrelation
the CD index in thethe
between autumn season is and
air temperature similar to that in the
precipitation sum-
rates can
mer season. on
be observed Thethesum of days
western coastofofthe
theCW
Black index
Sea (indoes not exceed
Romania, 100 and
Ukraine, daysMoldova).
per season In
throughout the region,
spring, the entire regionwith a slight increase
is characterized on the Black
by a positive Sea coast
(significant) of the Caucasus
relationship between(upair
to 250 days).and
temperature Theprecipitation
number of days with the
throughout theCW index
region, increases
except for a in a northerly
narrow strip ofdirection
negative
and reaches 200
correlations on thedays. The sum
eastern coastofof
the WW
the index
Black Sea.also
Theincreases
summernorthward, but with larger
season is characterized by
a statistically
values relativesignificant
to the CWnegative
index. Incorrelation
the northern between
regions,airthe
temperature
number ofand days precipitation
with warm
throughout
and the region,
wet conditions reacheswith maximum
300 days. values in the southeast (correlation coefficient
reaches
Zhou −0.8).
andTheLiu correlation
[47] showed coefficients in the autumn
that correlations between have the lowestand
temperature values. Negative
precipitation
statistically
(positive significanthave
or negative) correlations were found
a direct impact on theon the entireofcoast
likelihood of the Black
compound climateSea, and
events
spring, the entire region is characterized by a positive (significant) relationship between
                         air temperature and precipitation throughout the region, except for a narrow strip of neg-
                         ative correlations on the eastern coast of the Black Sea. The summer season is character-
                         ized by a statistically significant negative correlation between air temperature and precip-
Climate 2022, 10, 133    itation throughout the region, with maximum values in the southeast (correlation coeffi-           6 of 16
                         cient reaches −0.8). The correlation coefficients in the autumn have the lowest values. Neg-
                         ative statistically significant correlations were found on the entire coast of the Black Sea,
                         and positive
                        positive         ones—in
                                   ones—in          the north
                                              the north  of theofregion.
                                                                    the region.   Our results
                                                                            Our results         are consistent
                                                                                         are consistent           with obtained
                                                                                                          with those    those ob-
                         tained   by Trenberth   and  Shea   [61]: a strong   negative correlation   between
                        by Trenberth and Shea [61]: a strong negative correlation between the monthly average   the monthly    av-
                         erage   temperature    and  the  precipitation    rates over  continents   in the
                        temperature and the precipitation rates over continents in the summer in both of thesummer     in  both  of
                         the  hemispheres    and  opposite   in  winter.  This  means  that areas  with  high   positive
                        hemispheres and opposite in winter. This means that areas with high positive correlations         correla-
                         tionstowards
                        tend    tend towards   cold/dry
                                        cold/dry          or warm/wet
                                                    or warm/wet            conditions,
                                                                     conditions,        and versa,
                                                                                  and vice   vice versa, negative
                                                                                                    negative         correlations
                                                                                                               correlations  lead
                         lead
                        to  thetodominance
                                  the dominance    of compound
                                              of compound            dry/warm
                                                                dry/warm         or wet/cold
                                                                              or wet/cold     extremes[32].
                                                                                            extremes     [32].InInour
                                                                                                                   ourcase,
                                                                                                                       case,high
                                                                                                                             high
                         positive   correlations  between     temperature     and  precipitation   explain   the
                        positive correlations between temperature and precipitation explain the more frequent WW  more   frequent
                         WW index
                        index    on theon the northern
                                        northern   part ofpart
                                                            theof  the region
                                                                 region  in thein the winter
                                                                                 winter season,season,  and
                                                                                                  and the     the bigger
                                                                                                           bigger   sum of sum
                                                                                                                             daysof
                         days   of CD  and  WW    indices  in  spring  and   autumn
                        of CD and WW indices in spring and autumn seasons (Figure 2).seasons   (Figure  2).

                        Figure3.3. The
                        Figure     Thespatial
                                       spatialdistribution
                                               distributionofofPearson’s
                                                                Pearson’s  correlation
                                                                         correlation    coefficients
                                                                                     coefficients forfor
                                                                                                      thethe monthly
                                                                                                          monthly      air tempera-
                                                                                                                   air temperature
                        and precipitation in 1950–2018. Statistically significant correlation coefficients (p < 0.05) are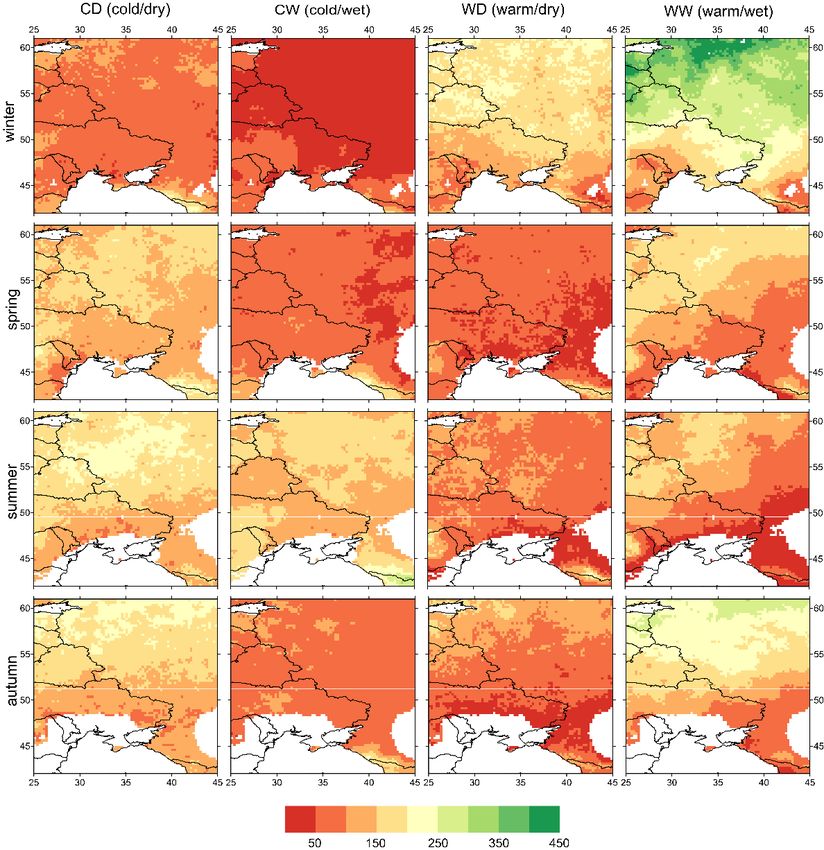
3.2. The Compound Extreme Indices Trends
                             The features that are characteristic of indices rather than seasons are highlighted
Climate 2022, 10, 133   when analyzing trends in indices of compound extremes (Figure 4). Thus, the CD index,        7 of 16
                        which includes temperature and precipitation below the 25 percentile, is characterized
                                                                                          th

                        by predominantly negative trends throughout the study region in all seasons. The area of
                        aWW
                          statistically
                              index aresignificant
                                         located indecrease    in part
                                                     the central  the number    of days
                                                                       of the region. Inwith this index isseasons
                                                                                        the transitional    located(spring
                                                                                                                    in the
                        southeast   of the region in  all seasons, and  for summer—throughout
                         and autumn), and in the summer season—throughout the region.               the region.

                        Figure
                        Figure 4.4.The
                                    Thespatial
                                        spatialdistribution of of
                                                 distribution  linear trend
                                                                  linear    coefficients
                                                                         trend            for compound
                                                                                coefficients             air temperature
                                                                                              for compound                  and pre-
                                                                                                               air temperature  and
                        cipitation extremes  over  the period  1950–2018.  Statistically significant trends (p < 0.05) are shown
                        precipitation extremes over the period 1950–2018. Statistically significant trends (p < 0.05) are shown   as
                        black dots.
                        as black dots.

                              The
                              Baseddistribution   of theoftrend
                                     on the analysis        linearcoefficients  of the
                                                                    trends, it can      CW index that
                                                                                    be concluded    is mixed.  It aisgeneral
                                                                                                        there is     necessary      to
                                                                                                                                trend
                        single  out the  region  of the  Caucasus      Range,  where   there  is a negative
                        towards an increase in the frequency of warm extremes and a decrease in the frequencystatistically   signif-
                        icant
                        of coldtrend  inThe
                                  ones.   the increase
                                               number inof air
                                                             days   with the index
                                                                 temperature          in all
                                                                                has led      seasons.
                                                                                         to an         In in
                                                                                                 increase  thewarm
                                                                                                                summer      season,
                                                                                                                       extremes     in
                        negative   values
                        other regions    of of the coefficients
                                            Europe                 of the in
                                                     [34,35,52,62–64],    linear
                                                                             othertrend  prevail.
                                                                                    countries      The
                                                                                               [32], andWD   indexthe
                                                                                                          around      is also
                                                                                                                         globechar-
                                                                                                                                  [65].
                        acterized   by a in
                        Studies differ     mixed
                                            time spatial
                                                  period, distribution     of thefor
                                                             threshold values      linear trend coefficients,
                                                                                      determining    extremes, but
                                                                                                                 and with
                                                                                                                        initiala data,
                                                                                                                                 pre-
                        dominance     of positive  values.
                        but they all show similar results.    In the  summer    season,  the western   part  of the   region    has  a
                        statistically significant increase in the number of days with compound index WD.
                        3.3. Correlation of Compound Indices and Large-Scale Patterns
                             The Pearson’s correlation coefficient was calculated between the compound extreme
                        indices and corresponding seasonal signal indices for each season. The NAO phase changes
                        lead to a significant change in the atmospheric circulation in the Atlantic–European re-
                        gion [45,66]. The correlation analysis of the compound extreme indices and the NAO index
                        in winter produced the following results (Figure 5). Negative correlations were found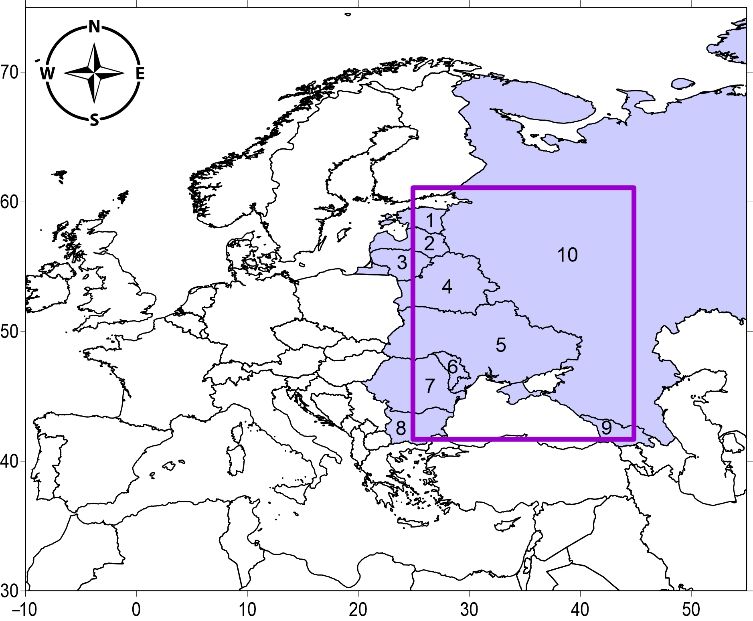
Climate 2022, 10, 133 8 of 16
between the NAO index and the “cold” CD and CW indices across the region and the 95%
statistically significant indices in Belarus, Eastern Ukraine, and the Black Earth Regions.
The warm indices (WD and WW) showed a statistically significant positive correlation (up
to +0.8) with the winter NAO index above the 50th parallel. A negative correlation was
observed between the WW and the NAO indices in the North Caucasus and the Caucasus
ridge (up to –0.8, p < 0.05). In contrast to [46], who found no statistically significant con-
nection with the winter NAO index in the Caucasus Mountains. Apparently, this is due to
Climate 2022, 10, x FOR PEER REVIEW 9 of 17
the use of other data (simulations from 10 global circulation models), a shorter data series
(1950–2006) and using the 40th and 60th percentile to highlight the extreme.
Figure
Figure 5.
5. The
The spatial
spatial distribution
distribution of
of correlation
correlation coefficients
coefficients for
for compound
compound extreme
extreme indices
indices and
and the
the
NAO. Statistically significant correlation coefficients (p < 0.05) are shown as black dots.
NAO. Statistically significant correlation coefficients (p < 0.05) are shown as black dots.
In spring,
The cold indices
East Atlantic demonstrate
pattern a negative
is the second modecorrelation with the NAO
of low frequency indexover
variability through-
the
out almost
North the The
Atlantic. entire region.centers
anomaly For the
of CD index,
the EA positivetocorrelation
are shifted the southeastcoefficients
relative towere
the
observed
centers of near
the NAOthe Caucasus, and in eastern
[41]. The positive phase ofUkraine for the CW
EA is associated index.
with Theaverage
higher compound
sur-
extreme WW index and the NAO index have a statistically significant correlation
face temperatures in Europe in all months, above average precipitation in northern Eu- in Belarus,
Bulgaria,
rope and some
and below partsin
average ofsouthern
Russia. Europe [41]. The correlation between the CD index
In summer,
and the winter EA the CD index
index is characterized
is negative throughoutby thea region
predominantly
with littlepositive relationship
statistically signifi-
withareas
cant the summer
(FigureNAO6). Theindex.
CW The
indexCW and WW
features indicespositive
a mainly have a predominantly
correlation withnegative
the EA
index above the 50th parallel, while on the Black Sea coast of the Caucasus, the correlation
is negative and statistically significant. The warm compound extreme indices (WD and
WW) have a positive correlation with the winter EA index throughout almost the entire
region. The WW index features a statistically significant correlation in Belarus, the Baltic,Climate 2022, 10, 133 9 of 16
relationship with the NAO index. For the WW index, it is statistically significant in the
north of the study region. In autumn, all indices (except WD) have a negative (with small
statistically significant areas) relationship with the NAO index throughout the region.
The distribution of the correlation coefficient between the WD index and the spring,
summer and autumn indices of the NAO is characterized by great spatial heterogeneity.
The NAO has the greatest impact on Europe, especially in winter [67–69], which is associ-
ated with changes in cyclone trajectories in the Atlantic–European region [70]. Our results
showed the strongest relationship with the NAO in the winter season.
The East Atlantic pattern is the second mode of low frequency variability over the
North Atlantic. The anomaly centers of the EA are shifted to the southeast relative to the
centers of the NAO [41]. The positive phase of EA is associated with higher average surface
temperatures in Europe in all months, above average precipitation in northern Europe and
below average in southern Europe [41]. The correlation between the CD index and the
winter EA index is negative throughout the region with little statistically significant areas
(Figure 6). The CW index features a mainly positive correlation with the EA index above
the 50th parallel, while on the Black Sea coast of the Caucasus, the correlation is negative
and statistically significant. The warm compound extreme indices (WD and WW) have a
positive correlation with the winter EA index throughout almost the entire region. The WW
index features a statistically significant correlation in Belarus, the Baltic, and the northern
part of European Russia.
The correlation between the CD index and the spring EA index is demonstrate a spatial
heterogeneity with predominance of negative correlations. The CW index has a positive
correlation with the EA index in the left-bank region of Ukraine and the northeast of the
region. Negative correlation coefficients were found in Romania and Moldova. The WW
index is characterized by the positive values of the correlation coefficient across the region
with statistically significant values on the north.
In summer, the CD index is characterized by a negative correlation with the summer
EA index throughout the region of Eastern Europe, and it is statistically significant, with
the exception of the eastern part of the region (the Ciscaucasia and the Black Earth region of
Russia). The CW index and the EA index have a negative relationship throughout the study
region with small areas of statistically significant values. The WD index demonstrates a
strong spatial heterogeneity, similar to the distribution of correlation coefficients between
the indices of compound extremes and the NAO indices for the spring, summer and autumn
seasons. However, the area with a statistically significant positive relationship in the west
of the region (right-bank Ukraine, Belarus, Romania, Latvia) should be noted, as well as
the Black Sea coast of the Caucasus. The spatial distribution of the correlation coefficients
between the WW index and the summer EA index is characterized by positive statistically
significant values (up to 0.9) for almost the entire study region, with the exception of the
eastern regions of Ukraine and Ciscaucasia.
The spatial distribution of the correlation coefficients between the indices of compound
extremes and the EA index in the autumn season is similar to the summer season, but with
smaller values of the coefficients.
The Scandinavia pattern (SCAND) is associated with anomalies in heights over Scan-
dinavia and western Russia [41]. During the positive phase of SCAND, temperatures are
below average in central Russia and western Europe, and precipitation is above average in
central and southern Europe. These positive and negative precipitation anomalies are in
good correspondence with intensification and reduced storm-track activity [43]. The cor-
relation between the cold indices of CD and CW and the winter SCAND index is quite
heterogeneous (Figure 7). There are areas with a positive statistically significant correlation
on the western coast of the Black Sea (Bulgaria, Romania, Moldova, and a part of Ukraine),
as well as in the north of the region. The warm indices (WD and WW) feature a largely
negative correlation with the winter SCAND index with statistically significant values in
the north of the region.Climate 2022, 10, 133
x FOR PEER REVIEW 1010of
of 17
16
Figure
Figure 6.
6. The
The spatial
spatial distribution
distribution of
of correlation
correlation coefficients
coefficients for
for compound
compound extreme
extreme indices
indices and
and the
the
EA. Statistically significant correlation coefficients (p < 0.05) are shown as black dots.
EA. Statistically significant correlation coefficients (p < 0.05) are shown as black dots.
The correlation
Ukraine, Belarus, between
as wellthe CD western
as the index and andtheeastern
springcoasts
EA index
of theis demonstrate
Black Sea, area char-
spa-
tial heterogeneity
acterized withcorrelation
by positive predominance of negative
coefficients correlations.
for the spring CDThe and CW theindex
springhasSCAND
a posi-
tive correlation
indices. with the
A negative EA indexsignificant
statistically in the left-bank regionbetween
correlation of Ukraine theand CWthe northeast
index of
and the
the region.
spring SCAND Negative
index correlation
was observed coefficients were found
in the southeast in Romania
of Ukraine, and Moldova.
and a positive The
correlation
was observed
WW in central Ukraine.
index is characterized by theThe WW index
positive valuesinof the spring
the seasoncoefficient
correlation has a predominantly
across the
negative
region correlations
with statisticallythroughout
significantthe region,
values onbut
the they are predominantly not significant.
north.
The
In spatial distribution
summer, the CD indexofiscorrelation
characterizedcoefficients in the correlation
by a negative summer season with between
the summer the
CD index
EA and WD indices and
throughout the summer
the region SCAND
of Eastern Europe,index
andisitcharacterized
is statisticallyby strong spatial
significant, with
heterogeneity.
the exception ofThere is a negative
the eastern part ofstatistically significant
the region (the relationship
Ciscaucasia and the with
Blackthe CWregion
Earth index
in Russia).
of the northThe of the
CWregion,
index andwhile inEA
the theindex
southern
havehalf of the region,
a negative it is positive.
relationship The rela-
throughout the
tionship
study between
region withthe WWareas
small indexofand the SCAND
statistically index in values.
significant summerThe is mostly negative,
WD index but
demon-
not significant.
strates a strong spatial heterogeneity, similar to the distribution of correlation coefficients
betweenThe the
CD indices
index inofthe autumn season
compound has and
extremes a negative
the NAO statistically
indices forsignificant
the spring,relationship
summer
with the autumn SCAND index throughout the region. The CW and
and autumn seasons. However, the area with a statistically significant positive relation- WW indices have a
similar structure of the spatial distribution of correlation coefficients:
ship in the west of the region (right-bank Ukraine, Belarus, Romania, Latvia) should negative values in the
be
noted, as well as the Black Sea coast of the Caucasus. The spatial distribution of the corre-
lation coefficients between the WW index and the summer EA index is characterized bydinavia and western Russia [41]. During the positive phase of SCAND, temperatures are
below average in central Russia and western Europe, and precipitation is above average
in central and southern Europe. These positive and negative precipitation anomalies are
in good correspondence with intensification and reduced storm-track activity [43]. The
correlation between the cold indices of CD and CW and the winter SCAND index is quite
Climate 2022, 10, 133 heterogeneous (Figure 7). There are areas with a positive statistically significant correla-11 of 16
tion on the western coast of the Black Sea (Bulgaria, Romania, Moldova, and a part of
Ukraine), as well as in the north of the region. The warm indices (WD and WW) feature a
largely
north ofnegative correlation
the region withareas
and separate the winter
with a SCAND index with significant
positive statistically statisticallyrelationship
significant
(the central
values in thepart of Ukraine).
north of the region.
Figure
Figure 7. The
The spatial
spatial distribution
distribution of
of correlation
correlation coefficients
coefficients for
for compound
compound extreme
extreme indices
indices and
and the
the
SСAND.
SCAND. Statistically
Statistically significant
significant correlation coefficients (p
correlation coefficients (p <
< 0.05)
0.05) are
are shown
shown as black dots.
as black dots.
4. Discussion
The overall increase in the frequency and intensity of extreme events associated with
the air temperature and precipitation requires that this problem should be studied in more
detail. Extensive research on the extreme trends in air temperatures and precipitation rates in
the study region has been conducted. They include the data on Russia [71,72], Georgia [73],
the western coast of the Black Sea [52,74], Ukraine [75], etc. The research works differ in
the methods used and the observation period. However, the key outcome of the majority
of works is a statistically significant increase in the air temperature and its extreme values,
as well as the heterogeneous precipitation values [76].
We conducted a detailed analysis of the frequency and trends of compound extremes,
and the connection with the circulation patterns of the territory covering most of Eastern
Europe. The positive and statistically significant trends in the region are typical of the
combinations with the temperatures above the 75th percentile, i.e., the warm extremes
(especially the WW index) in all seasons, with maximum values in the winter season. TheClimate 2022, 10, 133 12 of 16
negative trends were obtained for the cold extremes, most pronounced for the CD index.
The resulting growth trends of warm indices are associated with an increase in the average
air temperature over the past decades.
The results obtained correlate with those obtained previously by other researchers. De-
spite the use of different data, time period and thresholds to identify extremes, studies show
a clear increase in the frequency of warm indices and a decrease in cold ones. The compound
extremes in European countries and regions show that the warm combinations (warm/dry
and warm/wet) are growing, while the cold combinations are decreasing [26,34,62]. The ob-
servations and ERA5 reanalysis data demonstrate that the 95th percentile precipitation
increases against the growth of temperatures in winter all over Russia [71]. The global
research [39] based on the CRU data also showed the increase in WD and WW extremes
in Russia in the second half of the 20th century. The comparison of compound extremes
produced using the CRU data and CMIP5 project models showed correlation, which allows
for the further use of the CMIP project results for global climate modeling to assess any
possible changes in compound extremes in the future. According to the IPCC experts, the
frequency and intensity of extremes associated with air temperature and precipitation will
increase in the future [77]. The analysis performed using various models and scenarios for
the European regions [78,79] and for the whole world [65] confirms this claim.
The increase in the occurrence rates of the extremes combining high temperature and
a lack of precipitation may result in droughts similar to the weather conditions observed
in Russia and Central Europe in 2010, 2015, and 2021. Such conditions may provoke
forest fires [5] and aggravate their effects, e.g., the smog and air pollution. Positive trends
for the WW combination can be attributed to the intensification of cyclonic activity and
consequently lead to heavy rains and floods. These may include the flood in Krymsk
(Krasnodar Krai) of 2015 when 2–5 monthly rainfall fell over a short period, the flooding
of the cities on the Black Sea coast of the Caucasus and the east of the Crimean Peninsula
in 2021, and the 2021 floods in Germany. This kind of research remains vital and requires
further efforts due to the ongoing climate changes.
We used the NAO, EA, and SCAND indices as circulation patterns. According to vari-
ous authors, they impact the air temperatures and precipitation in Eastern Europe [80–83].
The analysis of the impacts of the large-scale processes in the oceans–atmosphere system
showed that the NAO index has a strong positive and statistically significant correlation
with the warm compound indices (WD and WW) in the northern part of Eastern Europe
in winter. This is consistent with the above statement about the greatest NAO influence
in the winter season. During a pronounced positive phase of the NAO, above-average air
temperatures and precipitation are detected in northern Europe in the winter season [41].
The correlation between the WW compound extremes index and the EA index is positive
in all seasons, with the highest values in summer. It should be noted that the CD index has
a strong negative correlation with the EA index in summer and autumn. The spatial distri-
bution of correlation coefficients between compound extremes and the SCAND index in
the winter season is opposite to the NAO index: a negative relationship with warm indices
(WD and WW) and a positive relationship with cold ones (CD and CW). The distribution
of the correlation coefficient between the WD index and the spring indices of large-scale
circulation is characterized by great spatial heterogeneity.
The North Atlantic oscillation and Scandinavia pattern have an impact on the north-
ern regions of Europe, while the southern ones (including Mediterranean) do not show
statistically significant results, as shown in another work [62]. The circulation types change
and storm-track activities shift during various signal phases, which impacts the occurrence
and distribution of compound extremes of air temperatures and precipitation in the Eastern
Europe region. Differences in the results of different authors, such as the effect of the winter
NAO on the occurrence of compound extremes in the Caucasus, may be due to the use of
a different study period, at which the phases of the modes are shifted into a positive or
negative phase [45,62].Climate 2022, 10, 133 13 of 16
5. Conclusions
We used the empirical approach to define the compound extremes of the air tempera-
ture and precipitation and analyze their spatial and temporal distribution over 1950–2018
in Eastern Europe. We evaluated the frequency and trends of the compound extremes in all
seasons. Based on the analysis of linear trends, it can be concluded that there is a general
trend towards an increase in the frequency of “warm” extremes (WD and WW indices) and
a decrease in the frequency of “cold” ones (CD and CW indices).
We used three signals that affect the structure of air temperature and precipitation in
the region (NAO, EA, and SCAND). An analysis to identify the influence of circulation
patterns on compound extremes showed that the NAO plays a significant role in the
formation of warm extremes in the winter season in the north of the study region, and the
situation is reversed for SCAND. The correlation between warm compound extremes and
the EA index is positive in all seasons with the highest values in summer.
The changes observed in the occurrence and frequency of compound extremes are
affecting and shall continue affecting various areas of life including healthcare, agriculture,
transportation, infrastructure, power industry, etc. Since the region is distinguished by
a variety of climatic conditions, the results obtained on the trends of joint extremes can
be both positive and negative. For example, a decrease in cold extremes in the northern
parts of the region may have a beneficial effect on some areas of the economy, such as a
northward shift in the zone suitable for cultivating certain crops, or a decrease in residential
heating costs. At the same time, the increase in warm extremes in the south of the region is
rather negative due to the increase in aridity in an already insufficiently humid region.
The work can be continued with the study of the influence of other circulation patterns,
as well as their joint influence on the distribution of compound extremes. The results obtained
can be used to develop adaptations to climate changes, compound extremes in particular.
Author Contributions: Conceptualization, E.V. and O.S.; methodology, O.S.; formal analysis, O.S.;
investigation, E.V. and O.S.; data curation, O.S.; writing—original draft preparation, E.V.; writing—
review and editing, E.V. and O.S.; visualization, E.V.; supervision, E.V. All authors have read and
agreed to the published version of the manuscript.
Funding: The study was supported by state assignment of Institute of natural and technical systems
(Project Reg. No. 121122300072-3).
Data Availability Statement: The initial time series of daily data of the average air temperature,
precipitation and circulation patterns indices are on the website Climate Explorer (European Climate
Assessment & Dataset) https://climexp.knmi.nl/start.cgi (accessed on 8 March 2022).
Acknowledgments: The authors are grateful to the anonymous reviewers for the remarks and
comments which led to improve the paper.
Conflicts of Interest: The authors declare no conflict of interest.
References
1. Beniston, M.; Stephenson, D.B.; Christensen, O.B.; Ferro, C.A.T.; Frei, C.; Goyette, S.; Halsnaes, K.; Holt, T.; Jylhä, K.; Koffi, B.;
et al. Future extreme events in European climate: An exploration of regional climate model projections. Clim. Chang. 2007, 81,
71–95. [CrossRef]
2. Seneviratne, S.I.; Nicholls, N.; Easterling, D.; Goodess, C.M.; Kanae, S.; Kossin, J.; Luo, Y.; Marengo, J.; McInnes, K.; Rahimi, M.;
et al. Changes in climate extremes and their impacts on the natural physical environment. In Managing the Risks of Extreme Events
and Disasters to Advance Climate Change Adaptation; A Special Report of Working Groups I And II of the Intergovernmental Panel
on Climate Change (IPCC); Field, C.B., Barros, V., Stocker, T.F., Eds.; Cambridge University Press: Cambridge, UK, 2012; pp.
109–230.
3. Trenberth, K.E.; Dai, A.; van der Schrier, G.; Jones, P.D.; Barichivich, J.; Briffa, K.R.; Sheffield, J. Global warming and changes in
drought. Nat. Clim. Chang. 2014, 4, 17–22. [CrossRef]
4. Zscheischler, J.; Westra, S.; van den Hurk, B.J.J.M.; Seneviratne, S.I.; Ward, P.J.; Pitman, A.; AghaKouchak, A.; Bresch, D.N.;
Leonard, M.; Wahl, T.; et al. Future climate risk from compound events. Nat. Clim. Chang. 2018, 8, 469–477. [CrossRef]Climate 2022, 10, 133 14 of 16
5. AghaKouchak, A.; Chiang, F.; Huning, L.S.; Love, C.A.; Mallakpour, I.; Mazdiyasni, O.; Moftakhari, H.; Papalexiou, S.M.; Ragno,
E.; Sadegh, M. Climate Extremes and Compound Hazards in a Warming World. Annu. Rev. Earth Planet Sci. 2020, 48, 519–548.
[CrossRef]
6. Haqiqi, I.; Grogan, D.S.; Hertel, T.W.; Schlenker, W. Quantifying the impacts of compound extremes on agriculture. Hydrol. Earth
Syst. Sci. 2021, 25, 551–564. [CrossRef]
7. Röthlisberger, M.; Martius, O. Quantifying the local effect of northern hemisphere atmospheric blocks on the persistence of
summer hot and dry spells. Geophys. Res. Lett. 2019, 46, 10101–10111. [CrossRef]
8. Zscheischler, J.; Martius, O.; Westra, S.; Bevacqua, E.; Raymond, C.; Horton, R.M.; van den Hurk, B.; AghaKouchak, A.; Jézéquel,
A.; Mahecha, M.D.; et al. A typology of compound weather and climate events. Nat. Rev. Earth Environ. 2020, 1, 333–347.
[CrossRef]
9. Fink, A.H.; Brucher, T.; Kruger, A.; Leckebusch, G.C.; Pinto, J.G.; Ulbrich, U. The 2003 European summer heatwaves and
drought—synoptic diagnosis and impacts. Weather 2004, 59, 209–216. [CrossRef]
10. Barriopedro, D.; Fischer, E.M.; Luterbacher, J.; Trigo, R.M.; García-Herrera, R. The hot summer of 2010: Redrawing the temperature
record map of Europe. Science 2011, 332, 220–224. [CrossRef]
11. Trenberth, K.E.; Fasullo, J.T. Climate extremes and climate change: The Russian heat wave and other climate extremes of 2010. J.
Geophys. Res. Atmos. 2012, 117, D17103. [CrossRef]
12. Diffenbaugh, N.S.; Swain, D.L.; Touma, D. Anthropogenic warming has increased drought risk in California. Proc. Natl. Acad. Sci.
USA 2015, 112, 3931–3936. [CrossRef]
13. Horton, R.M.; Mankin, J.S.; Lesk, C.; Coffel, E.; Raymond, C. A review of recent advances in research on extreme heat events.
Curr. Clim. Chang. Rep. 2016, 2, 242–259. [CrossRef]
14. Kopp, R.; Easterling, D.R.; Hall, T.; Hayhoe, K.; Horton, R.; Kunkel, K.; LeGrande, A. Potential surprises—Compound extremes
and tipping elements. In Climate Science Special Report: A Sustained Assessment Activity of the U.S. Global Change Research Program;
Wuebbles, D.J., Fahey, D.W., Hibbard, K.A., Dokken, D.J., Stewart, B.C., Maycock, T.K., Eds.; U.S. Global Change Research
Program: Washington, DC, USA, 2017; pp. 608–635.
15. Cooley, D.; Nychka, D.; Naveau, P. Bayesian spatial modeling of extreme precipitation return levels. J. Am. Stat. Assoc. 2007, 102,
824–840. [CrossRef]
16. Katz, R. Statistics of extremes in climate change. Clim. Chang. 2010, 100, 71–76. [CrossRef]
17. AghaKouchak, A.; Nasrollahi, N. Semi-parametric and parametric inference of extreme value models for rainfall data. Water
Resour. Manag. 2010, 24, 1229–1249. [CrossRef]
18. Zhang, X.; Alexander, L.; Hegerl, G.C.; Jones, P.; Klein Tank, A.; Peterson, T.C.; Trewin, B.; Zwiers, F.W. Indices for monitoring
changes in extremes based on daily temperature and precipitation data. WiRes-Clim. Chang. 2011, 2, 851–870. [CrossRef]
19. Alexander, L.V. Global observed long-term changes in temperature and precipitation extremes: A review of progress and
limitations in IPCC assessments and beyond. Weather Clim. Extrem. 2016, 11, 4–16. [CrossRef]
20. Hao, Z.; Singh, V.P.; Hao, F. Compound Extremes in Hydroclimatology: A Review. Water 2018, 10, 718. [CrossRef]
21. Schöelzel, C.; Friederichs, P. Multivariate non-normally distributed random variables in climate research–introduction to the
copula approach. Nonlinear Process Geophys. 2008, 15, 761–772. [CrossRef]
22. Estrella, N.; Menzel, A. Recent and future climate extremes arising from changes to the bivariate distribution of temperature and
precipitation in Bavaria, Germany. Int. J. Climatol. 2013, 33, 1687–1695. [CrossRef]
23. Gallant, A.J.; Karoly, D.J.; Gleason, K.L. Consistent trends in a modified climate extremes index in the United States, Europe, and
Australia. J. Clim. 2014, 27, 1379–1394. [CrossRef]
24. Quesada, B.; Vautard, R.; Yiou, P.; Hirschi, M.; Seneviratne, S.I. Asymmetric European summer heat predictability from wet and
dry southern winters and springs. Nat. Clim. Chang. 2012, 2, 736–741. [CrossRef]
25. Shaby, B.A.; Reich, B.J.; Cooley, D.; Kaufman, C.G. A Markova-switching model for heat waves. Ann. Appl. Stat. 2016, 10, 74–93.
[CrossRef]
26. Beniston, M. Trends in joint quantiles of temperature and precipitation in Europe since 1901 and projected for 2100. Geophys. Res.
Lett. 2009, 36, L07707. [CrossRef]
27. Beniston, M.; Goyette, S. Changes in variability and persistence of climate in Switzerland; exploring 20th century observations
and 21st century simulations. Glob. Planet Chang. 2007, 57, 1–15. [CrossRef]
28. Beniston, M.; Uhlmann, B.; Goyette, S.; Lopez-Moreno, J.I. Will snow-abundant winters still exist in the Swiss Alps in an enhanced
greenhouse climate? Int. J. Climatol. 2011, 31, 1257–1263. [CrossRef]
29. Tencer, B.; Weaver, A.; Zwiers, F. Joint Occurrence of Daily Temperature and Precipitation Extreme Events over Canada. J. Appl.
Meteor. Climatol. 2014, 53, 2148–2162. [CrossRef]
30. Martin, J.-P.; Germain, D. Large-scale teleconnection patterns and synoptic climatology of major snow-avalanche winters in the
Presidential Range (New Hampshire, USA). Int. J. Climatol. 2017, 37, 109–123. [CrossRef]
31. Hao, Z.; Hao, F.; Singh, V.P.; Xia, Y.; Shi, C.; Zhang, X. A multivariate approach for statistical assessments of compound extremes.
J. Hydrol. 2018, 565, 87–94. [CrossRef]
32. Wu, X.; Hao, Z.; Hao, F.; Zhang, X. Variations of compound precipitation and temperature extremes in China during 1961–2014.
Sci. Total Environ. 2019, 663, 731–737. [CrossRef] [PubMed]Climate 2022, 10, 133 15 of 16
33. Dash, S.; Maity, R. Revealing alarming changes in spatial coverage of joint hot and wet extremes across Indian. Sci. Rep. 2021,
11, 18031. [CrossRef]
34. Morán-Tejeda, E.; Herrera, S.; López-Moreno, J.I.; Revuelto, J.; Lehmann, A.; Beniston, M. Evolution and frequency (1970–2007) of
combined temperature–precipitation modes in the Spanish mountains and sensitivity of snow cover. Reg. Environ. Chang. 2013,
13, 873–885. [CrossRef]
35. Arsenovic, P.; Tosic, I.; Unkasevic, M. Trends in combined climate indices in Serbia from 1961 to 2010. Meteorol. Atmos. Phys. 2015,
127, 489–498. [CrossRef]
36. Malinovic-Milicevic, S.; Radovanovic, M.M.; Stanojevic, G.; Milovanovic, B. Recent changes in Serbian climate extreme indices
from 1961 to 2010. Theor. Appl. Climatol. 2016, 124, 1089–1098. [CrossRef]
37. Sedlmeier, K.; Feldmann, H.; Schädler, G. Compound summer temperature and precipitation extremes over central Europe. Theor.
Appl. Climatol. 2018, 131, 1493–1501. [CrossRef]
38. Gallant, A.J.E.; Karoly, D.J. A combined climate extremes index for the Australian region. J. Clim. 2010, 23, 6153–6165. [CrossRef]
39. Hao, Z.; AghaKouchak, A.; Phillips, T.J. Changes in concurrent monthly precipitation and temperature extremes. Environ. Res.
Lett. 2013, 8, 034014. [CrossRef]
40. Hurrell, J.W.; Deser, C. North Atlantic climate variability: The role of the North Atlantic Oscillation. J. Mar. Syst. 2010, 79, 231–244.
[CrossRef]
41. Barnston, A.G.; Livezey, R.E. Classification, seasonality and persistence of low-frequency atmospheric circulation patterns. Mon.
Weather. Rev. 1987, 115, 1083–1126. [CrossRef]
42. Moore, G.W.K.; Renfrew, I.A. Cold European winters: Interplay between the NAO and the East Atlantic mode. Atmos. Sci. Lett.
2012, 13, 1–8. [CrossRef]
43. Bueh, C.; Nakamura, H. Scandinavian pattern and its climatic impact. Q. J. R. Meteorol. Soc. 2007, 133, 2117–2131. [CrossRef]
44. Nesterov, E.S. East Atlantic oscillation of the atmospheric circulation. Russ. Meteorol. Hydrol. 2009, 34, 794–800. [CrossRef]
45. Mellado-Cano, J.; Barriopedro, D.; García-Herrera, R.; Trigo, R.M.; Hernandez, A. Examining the North Atlantic Oscillation, East
Atlantic Pattern, and Jet Variability since 1685. J. Clim. 2019, 32, 6285–6298. [CrossRef]
46. López-Moreno, J.I.; Vicente-Serrano, S.M.; Morán-Tejeda, E.; Lorenzo-Lacruz, J.; Kenawy, A.; Beniston, M. Effects of the North
Atlantic Oscillation (NAO) on combined temperature and precipitation winter modes in the Mediterranean mountains: Observed
relationships and projections for the 21st century. Glob. Planet. Chang. 2011, 77, 62–76. [CrossRef]
47. Zhou, P.; Liu, Z. Likelihood of concurrent climate extremes and variations over China. Environ. Res. Lett. 2018, 13, 094023.
[CrossRef]
48. Chernokulsky, A.; Kozlov, F.; Zolina, O.; Bulygina, O.; Mokhov, I.; Semenov, V. Observed changes in convective and stratiform
precipitation in Northern Eurasia over the last five decades. Environ. Res. Lett. 2019, 14, 045001. [CrossRef]
49. Vyshkvarkova, E.; Voskresenskaya, E.; Martin-Vide, J. Spatial distribution of the daily precipitation concentration index in
Southern Russia. Atmos. Res. 2018, 203, 36–43. [CrossRef]
50. Aleshina, M.A.; Toropov, P.A.; Semenov, V.A. Temperature and humidity regime changes on the Black sea coast in 1982-2014.
Russ. Meteorol. Hydrol. 2018, 43, 235–244. [CrossRef]
51. Grinevetsky, S.R.; Zonn, I.S.; Zhiltsov, S.S.; Kosarev, A.N.; Kostianoy, A.G. The Black Sea Encyclopedia; Springer: Berlin/Heidelberg,
Germany; 889p. [CrossRef]
52. Croitoru, A.-E.; Chiotoroiu, B.-C.; Ivanova Todorova, V.; Torică, V. Changes in precipitation extremes on the Black Sea Western
Coast. Glob. Planet. Chang. 2013, 102, 10–19. [CrossRef]
53. Corobov, R.; Sheridan, S.; Overcenco, A.; Terinte, N. Air temperature trends and extremes in Chisinau (Moldova) as evidence of
climate change. Clim. Res. 2010, 42, 247–256. [CrossRef]
54. Didovets, I.; Krysanova, V.; Hattermann, F.F.; del Rocío Rivas Lopez, M.; Snizhko, S.; Schmied, H.M. Climate change impact on
water availability of main river basins in Ukraine. J. Hydrol. Reg. Stud. 2020, 32, 100761. [CrossRef]
55. Rutgersson, A.; Jaagus, J.; Schenk, F.; Stendel, M. Observed changes and variability of atmospheric parameters in the Baltic Sea
region during the last 200 years. Clim. Res. 2014, 61, 177–190. [CrossRef]
56. Avotniece, Z.; Aniskevich, S.; Malinovskis, E. Climate Change Scenarios for Latvia; Report Summary; State Ltd. Latvian Environment,
Geology and Meteorology Centre: Riga, Latvia, 2017; p. 17.
57. Tõnisson, H.; Suursaar, Ü.; Orviku, K.; Jaagus, J.; Kont, A.; Willis, D.A.; Rivis, R. Changes in coastal processes in relation to
changes in large-scale atmospheric circulation, wave parameters and sea levels in Estonia. J. Coast. Res. 2011, 57, 701–705.
58. Bukantis, A.; Rimkus, E. Climate variability and change in Lithuania. Acta Zool. Litu. 2005, 15, 100–104. [CrossRef]
59. Danilovich, I.; Geyer, B. Estimates of current and future climate change in Belarus based on meteorological station data and the
EURO-CORDEX-11 dataset. Meteorology Hydrology and Water Management. Res. Oper. Appl. 2021, 9, 1–30. [CrossRef]
60. Haylock, M.R.; Hofstra, N.; Klein Tank, A.M.G.; Klok, E.J.; Jones, P.D.; New, M. A European daily high-resolution gridded data
set of surface temperature and precipitation for 1950–2006. J. Geoph. Res. 2008, 113, D20119. [CrossRef]
61. Trenberth, K.; Shea, D.J. Relationships between precipitation and surface temperature. Geophys. Res. Lett. 2005, 32, L14703.
[CrossRef]
62. Lemus-Canovas, M. Changes in compound monthly precipitation and temperature extremes and their relationship with telecon-
nection patterns in the Mediterranean. J. Hydr. 2022, 608, 127580. [CrossRef]You can also read