Computational Fluid Dynamics Simulation of Airow and Air Pattern in the Living Room for Reducing Coronavirus Exposure
←
→
Page content transcription
If your browser does not render page correctly, please read the page content below
Computational Fluid Dynamics Simulation of Air ow and Air Pattern in the Living Room for Reducing Coronavirus Exposure Majid Bayatian ( majid_bayatian@yahoo.com ) Islamic Azad University Tehran Medical Sciences https://orcid.org/0000-0002-7389-811X Khosro Ashra University of Tehran Faculty of Environment Zahra Amiri Islamic Azad University Tehran Medical Sciences Elahe Jafari Islamic Azad University Tehran Medical Sciences Research Article Keywords: CFD simulation, air velocity, air ow pattern, living room, COVID-19 DOI: https://doi.org/10.21203/rs.3.rs-316076/v1 License: This work is licensed under a Creative Commons Attribution 4.0 International License. Read Full License
1

2 Computational Fluid Dynamics Simulation of Airflow and Air Pattern in
3 the Living Room for Reducing Coronavirus Exposure
4
5 Majid Bayatian1, Khosro Ashrafi2*, Zahra Amiri1, Elahe Jafari1
6 1. Department of Occupational Health Engineering, Faculty of Health, Tehran Medical Sciences, Islamic Azad
7 university, Tehran, Iran
8 2. School of Environment, College of Engineering, University of Tehran, Tehran, Iran 1
9
10

11 Abstract

12 Viruses can be transmitted in indoor environments. Important factors in Indoor Air Quality (IAQ) are air
13 velocity, relative humidity, temperature, and airflow pattern and Computational fluid dynamics (CFD) can use
14 for IAQ assessment. The objective of this study is to CFD simulation in the living room to the prediction of the
15 air pattern and air velocity. A computational fluid dynamic model was applied for airflow pattern and air
16 velocity simulation. For simulation, GAMBIT, FLUENT, and CFD post software were used as preprocessing,
17 processing, and post-processing, respectively. CFD validation was carried out by comparing the computed data
18 with the experimental measurements. The final mesh number was set to 1,416,884 elementary cells and
19 SIMPLEC algorithm was used for pressure-velocity coupling. PERSTO, and QUIK schemes have been used for
20 the pressure terms, and the other variables, respectively. Simulations were carried out in ACH equals 3, 6 and 8
21 in four lateral walls. The maximum error and root mean square error from the air velocity were 14% and 0.10,
22 respectively. Terminal settling velocity and relaxation time were equal to 0.302 ×10⁻² m/s and 0.0308 ×10⁻² s
23 for 10 diameter particles, respectively. The stopping distance was 0.0089m and 0.011m for breathing and
24 talking, respectively. The maximum of mean air velocity is in scenario 4 with ACH= 8 that mean air velocity is
25 equal to 0.31 in 1.1m height, respectively. The results of this study showed that avoiding family gatherings is
26 necessary for exposure control and suitable airflow and pattern can be improving indoor air conditions.

27

28 Keyword: CFD simulation, air velocity, airflow pattern, living room, COVID-19

29

 * Corresponding Author:
 1
 - khashrafi@ut.ac.ir , Tel: +982161113155

 1
30 Introduction

31 With the rapid development of the social economy, the living standard has developed and the residential
32 environment has gained more attention (Han, Zhou et al. 2018). Indoor Air Quality (IAQ) is important to
33 occupant health, especially around the human body(Luo, Weng et al. 2019). The breathing activities generate
34 bioaerosols that may carry viruses and other substances. These bioaerosols might be causing adverse health
35 impacts, such as contagious infectious diseases(Kim, Kabir et al. 2018; Coccia 2020).

36 Coronavirus disease-2019 (COVID-19) is a severe respiratory disease that originated from the devastating
37 coronavirus family (2019-nCoV) and has become a pandemic across the globe (Bhattacharyya, Dey et al. 2020).
38 COVID-19 is a respiratory disease with an evolving and expanding list of systemic manifestations(Acter, Uddin
39 et al. 2020) and caused by a single-stranded RNA virus with a lipid envelope that has a diameter of
40 approximately 120 nm (range of 80-160 nm) (Asadi, Bouvier et al. 2020; Di Maria, Beccaloni et al. 2020;
41 Vuorinen, Aarnio et al. 2020). COVID-19 disease is with over 111,102,016 knowns infections and over
42 2,462,911 deaths reported by February 22, 2021, worldwide. In Iran, as of February 22, 2021, more than
43 1,574,012 cases of COVID- 19 had been confirmed, including over 59,483 reported deaths(WHO 2021).

44 Coronavirus particles spread between people more readily indoors than outdoors (Chirizzi, Conte et al.
45 2020). These particles spread through respiratory droplets produced when an infected person coughs, sneezes,
46 talks, or exhales (Blocken, Malizia et al. 2020; Dhand and Li 2020; Scheuch 2020). The contact and droplet
47 transmission is currently considered as the two likely main transmission pathways of the coronavirus from
48 person to person (Morawska, Tang et al. 2020; Xu, Luo et al. 2020). Another way is through direct contact by
49 hands with the polluted surfaces or objects having virus on them(Wang, Feng et al. 2020). The virus may further
50 enter the eyes, mouth or nose by hand touching(Li, Wang et al. 2020). Also, another possible way of virus
51 transmission that has recently been introduced is family parties and gathering takes a place in residential homes.

52 Using face masks and staying at least six feet away from other people, good air circulation inside buildings
53 will reduce the spread of coronavirus particles (Atangana and Atangana 2020; Klompas, Baker et al. 2020).
54 There is a strong association between transmission of COVID-19 and the air movement in indoor environments
55 which is largely influenced by ventilation system types (Contini and Costabile 2020; Correia, Rodrigues et al.
56 2020). Ventilation is recognized as the most influential engineering method for reducing airborne transmission
57 indoors. Ventilation airflow rate and room air pattern are two key factors shaping indoor air
58 distribution(Melikov, Ai et al. 2020). Ways to increase ventilation including the windows, dedicated exhaust
59 fan, portable air purifier, upgrade the Heating, Ventilation, and Air Condition (HVAC) system. Also, a
60 limitation in the number of occupants in the room can be suggested (RHODE 2021). Mechanical ventilation
61 systems are implemented in the residential home for thermal comfort and to regulate indoor air
62 distribution(Babu and Suthar 2020). During an epidemic, such as the COVID-19 pandemic, air recirculation
63 should be avoided, and the system operated on 100% outdoor air if possible(Joppolo and Romano 2017; Guo,
64 Xu et al. 2020). But, there is a limitation in the use of the outdoor air in the autumn and winter seasons. One
65 way to assess ventilation is to determine Air Changes per Hour (ACH). A higher ACH can reduce the risk of the
66 disease spreading through the air(Bhagat, Wykes et al. 2020). ACH in the living room recommended 3-6
67 (Morawska, Tang et al. 2020; Sauermann 2020) and 6-8(Suwardi, Ooi et al. 2021).

68 In assessing IAQ, the air movement inside the built space is quite important. Important factors comprise
69 velocity, relative humidity, temperature, and airflow pattern. The airflow pattern depends upon various factors
70 i.e., the position of air supply and exhaust, position and size of window/door, furniture arrangement in room,
71 availability of energy source etc. To simulate and predict the indoor airflow, numerical models were made in
72 accordance with the size of the building. Computational Fluid Dynamics (CFD) is used as an alternative
73 numerical method to study the impact of different variables on the IAQ i.e., airflow pattern and velocity fields
74 (Fareed, Iqbal et al. 2020; Ma, Aviv et al. 2021).

75 CFD has been used to obtain spatial and temporal solutions of the characteristics of indoor airflow patterns.
76 Development leads to CFD application in various areas i.e. indoor air, biological flows etc. The numerical
77 results of CFD in indoor environments were based on predicting velocity fields and air distribution in rooms. In
78 this method, the fundamental equations describing the conservation of mass, momentum, and energy are solved
79 numerically for a given flow domain (Azari, Sadighzadeh et al. 2018; Bayatian, Ashrafi et al. 2018). Now, CFD
80 using as a reliable tool for the simulation and estimation of velocity fields and airflow patterns in indoor
81 environments (Tong, Hong et al. 2019). On the other, the CFD program user should have good knowledge of
82 fluid dynamics, numerical technique, and indoor air distribution (Sosnowski, Gnatowska et al. 2019).

 2
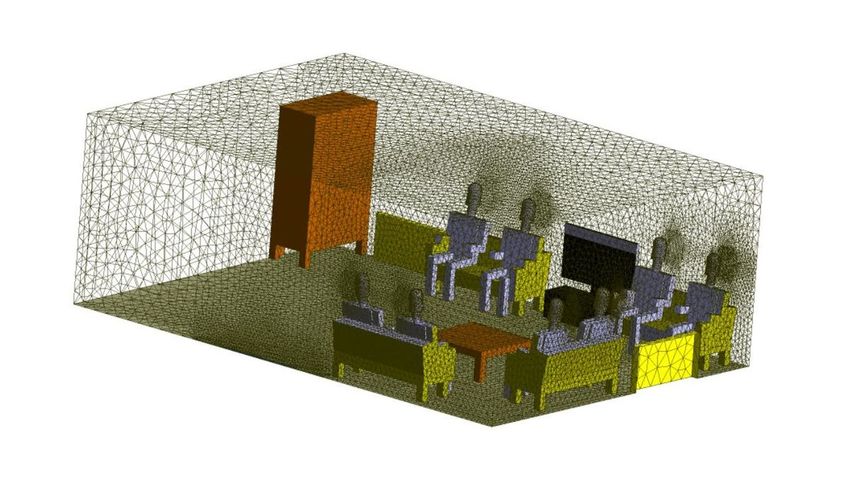
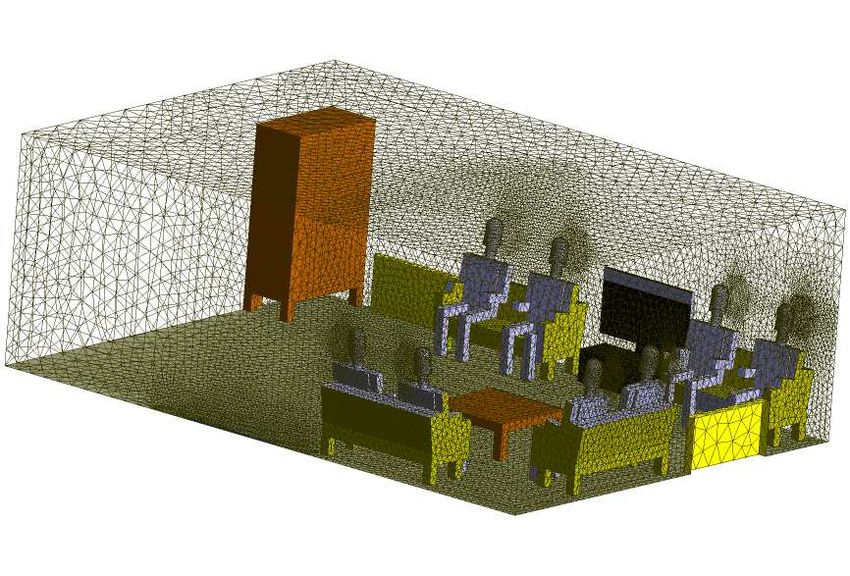
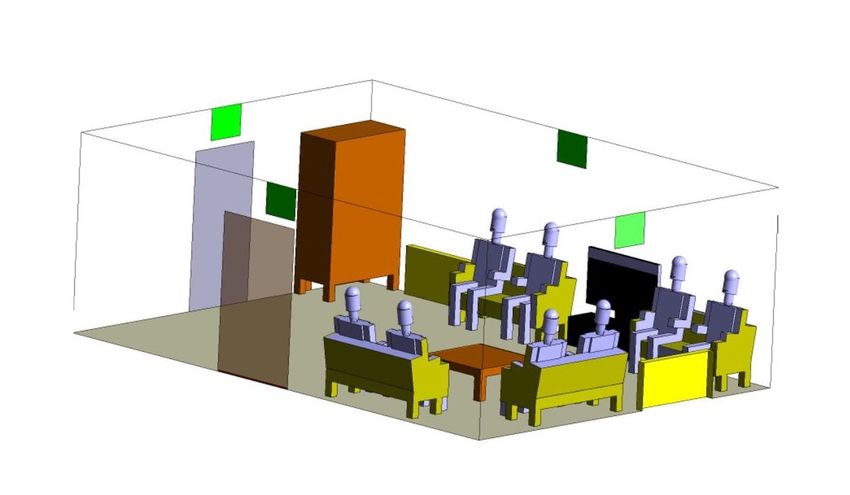
83 Most simulation studies are limited to numerical analyses. For example, Sun and Zhai (2020) carried out a
84 study on the efficacy of ventilation effectiveness in preventing COVID-19 transmission. They found that
85 minimum ventilation or fresh air requirement should vary with distancing conditions, exposure time, and
86 effectiveness of air distribution systems (Sun and Zhai 2020). European Centre for Disease Prevention and
87 Control (2020) reported the effect of HVAC systems in the context of COVID-19(Control 2020). Yang et al
88 (2014) carried out a CFD simulation study in residential indoor air quality. They found that wall-hanging air
89 conditioning systems can undertake indoor heat load and conduct good indoor thermal comfort. Eventually, they
90 reported, compared with the traditional measurement method, CFD simulation has many advantages in
91 simulating indoor environment, so it is hopeful to create a more comfortable, healthy living environment by
92 CFD in the future(Yang and Ye 2014). One of the ways of coronavirus transmitting the is to participate in
93 gathering night. On the other, windows are closed in the autumn and winter season and there isn’t natural
94 ventilation, therefore, the objective of this study is to CFD simulation in the living room to investigate the air
95 pattern and air velocity in different air supplied and ACH.

96
97 Materials and Methods
98
99 Case study

100 The case study was carried out in a living room with 7m×5m × 2.5m dimensions in the x, y and z
101 directions, respectively, and 8 occupants. In order to simulate and analyze the effect of air velocity and air
102 supply location on airflow pattern, 3D simulations have been applied. In this living room, air supplies
103 continuously from the entrances door bottom and there are two radiators as heat sources to the room.

104 Geometry generation

105 GAMBIT software has been used for geometry building and meshing (Fig. 1). Due to the complex
106 geometry of the case study, the numerical domain has been divided into 31 sub-regions blocks, and a
107 combination of unstructured/structured grid systems has been applied. Mesh generation has been performed by a
108 T-grid algorithm with tet/ hybrid elements (Fig. 2) in each block, and meshes have been adjusted at the block’s
109 boundary.

110
111 Fig. 1 Geometry of computational domain

 3
112
113 Fig. 2 Isometric view of the surface mesh of the flow domain

114 For mesh independency study, five different numbers of meshes with characteristics shown in table 1
115 have been tested. Mesh independency analysis ensured that the flow fields at the computational domain were
116 not affected by mesh dimension (Wen and Malki-Epshtein 2018). As shown in figure 3, the final number of the
117 mesh is set to 1,416,884 elementary cells. In this mesh number, the cell spacing size used is 0.02 m (next to
118 occupants and air supply) to 0.33 m (far from occupants and air supply).

119 Table 1 Mesh characteristics of five cases in mesh independency study

 cases Mesh No. Node No. Min. grid Max. grid
 spacing (m) spacing (m)
 I 515080 95981 0.030 0.50
 II 890761 169540 0.025 0.40
 III 1153472 210171 0.020 0.35
 IV 1416884 251307 0.020 0.33
 V 1564255 278773 0.020 0.30
120
121
 0.1
 0.09
 0.08
 air velocity (m/s)

 0.07
 0.06
 0.05
 0.04
 0.03
 0.02
 0.01
 0
 I II III IV V
 Cases
122
123
124 Fig. 3 The effects of the cell number on the average air velocity
125
126 Boundary conditions

127 Boundary conditions are specifications of properties of the surfaces of the computational domains and
128 are required to fully define the airflow simulation. The operating pressure and operating densities were 101,325
 3 -1
129 Pa and 1.19 kg/m , respectively, and the thermal expansion coefficient was considered 0.003 K . The inlet
130 boundary condition was a uniform velocity (2.3m/s), calculated based on the experimental measurement. Table
131 2 shows boundary conditions used in this study.

 4
132 Table 2 Summery of boundary conditions
 Boundary Type Notes
 Air inlet Inlet velocity V=2.3m/s, Location: bottom of entrance door
 Air outlet outflow
 Radiators Wall T= 345 K
 Air inlet Inlet velocity V=2 m/s, Location: exhaled of occupants
 Obstacles Wall No-slip conditions (include: furniture and TV)
 Air inlet Inlet velocity Refer to Scenario section
133
134 Governing equation

135 In the present study, the commercial package ANSYS FLUENT 16 has been used to solve all
136 governing equations, including conservation of mass (1), momentum (2), energy (4):

137 ∇. = 0 (1)

138 . ∇ = −∇ + ∇2 + ( − ) (2)

139 where P is pressure, the air density, V the velocity, the thermal expansion coefficient of air, the
140 effective dynamic viscosity, g the gravity acceleration, Tref the temperature of a reference point, t the
141 temperature. The turbulent influences are lumped into the effective viscosity as the sum of the turbulent
142 viscosity and laminar viscosity :

143 = + (3)

144 . ∇ = ∇2 (4)

145 where Cp is the specific heat at constant pressure (J/kg ◦ C) and is the effective thermal conductivity (W/m
146 ◦ C) which can be expressed as,

147 = + (5)

148 where is the laminar thermal conductivity and is the turbulent thermal conductivity which depends on the
149 local flow field.

150 Airflow pattern calculations use the Boussinesq approximation for thermal buoyancy. This
151 approximation takes air density as constant in the momentum terms and considers the buoyancy influence on air
152 movement by the difference between the local air weight and the pressure gradient. Also, in this study, standard
153 k- turbulence model has been used that the governing equations for k (6) and (7) are:

154 ( ) = ( + ) ∇2 + 2 − (6)

 2
155 ( ) = ( + ) ∇2 + 1 2 − 2 (7)

 2
156 = (8)

157 where coefficients , , , 1 2 are 0.09, 1.0, 1.3, 1.44 and 1.44, respectively, and S=(S ijSji)0.5

158 Solver settings

159 In the present work, the continuity and the incompressible Navier-Stokes equations with gravitational
160 force as well as the energy equation for the airflow pattern have been numerically resolved. The flow is in a
161 steady state without any reaction. The SIMPLEC algorithm was used for pressure-velocity coupling. Also,
162 PERSTO, and QUIK schemes have been used for the pressure terms, and the other variables, respectively.

 5
163 CFD model validation

164 The CFD results need to be well validated against relevant experiments (Middha 2010). Therefore, to
165 validate the simulation, air velocity has been measured in the computational domain. Measurements of air
166 velocity have been carried out with two thermal anemometers (Kimo VT100 model). Finally, CFD model
167 results have been compared with air velocity measurements by the root mean square error and regression
168 statistical tests (Ni, Wang et al. 2021).

169 Scenarios

170 The air change rate is the velocity at which all the air inside a room is replaced by the ventilation
171 system. It is calculated as the airflow from each ventilation system inlet relative to the total volume of the room
172 in question, and is expressed per hour.

173 = (9)

 3 2 3
174 where Q is the inlet flow rate (m /s), Ai the inlet opening area (m ), and V the room volume (m ). For the living
175 room, ACH is 3-6 (Sauermann 2020) and 6-8 (Suwardi, Ooi et al. 2021). This study has considered the four air
176 supply in walls (Fig.1) for three ACH (3, 6, and 8). Air supply dimension is 0.4m×0.5m in the x, y respectively.
177 Therefore, air velocity in the inlet opening area has been 0.37, 0.74 and 0.975 m/s in ACH equal 3, 6 and 8,
 60
178 respectively. Air exchange out the frequency in minutes (nm) can be calculated as = , where n in ACH.

179 Therefore, nm is 20, 10 and 7.5 min for ACH equals to 3, 6 and 8, respectively.

180 Analytical Solution

181 Coronavirus transferred via infected microscopic airborne particles and contaminated aerosol droplets.
182 Small particles and droplets of a broad spectrum of diameters get generated during talking and breathing.
183 Particles number maximum produced have 10 μm diameter in talking (ISHRAE 2020) and exhaled air velocity
184 during breathing and talking is 2 and 3.9 m/s, respectively (Xu, Nielsen et al. 2017). Hence, we have calculated
185 particle Reynolds number (10) relaxation time (11) stopping distance (12), and terminal settling velocity (13) for
186 particles with 10 μm diameter in breathing and talking functions:

 ρVr dp
187 Rep =
 μ
 (10)

 2

188 = (11)
 18

 2

189 = (12)
 18

 2

190 = (13)
 18

191 where dp is the particle (μm), Vr the relative velocity of the particle to the fluid, the particle density (Kg/m3),
192 the viscosity (Pa. s), Cc the Cunningham correction factor, Rep the particle Reynolds number, the relaxation
193 time, S the stopping distance (m) and VTS the terminal settling velocity of particles (m/s)(Zhang 2004).

194 Results and Discussions
195 This section presents the results obtained during the experiments and simulations, validation of
196 simulation, and finally results obtained during the simulations in 4 scenarios (12 cases). As mentioned in the
197 previous section, numerical simulation has been done for a living room in the actual condition. There isn’t
198 mechanical ventilation in this condition, and all the doors and windows have been closed; therefore, the
199 computational domain did not have natural ventilation. But air supplied continuously from the bottom entrance
200 door. In this case, the mean air velocity was 1.4×10⁻³ and 1.32×10⁻³ m/s in inhalation zone height (1.1m) for
201 isosurface and plane surface, respectively. Since, most of the exhaust particles from the human respiratory
202 system are 10 diameter particles in breathing and talking (ISHRAE 2020), calculated particle dynamics
203 parameters as analytically (Tab 3).

 6
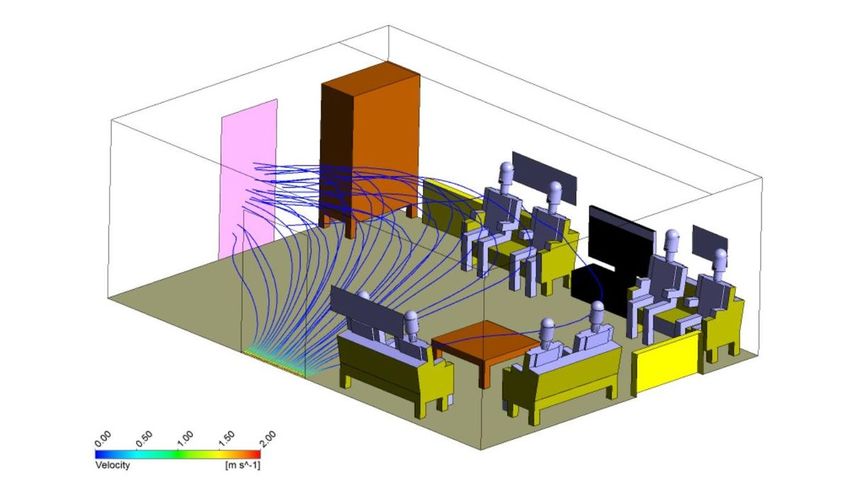
204
205 Table 3 Particle dynamics parameters for 10 diameter particle in breathing and talking
 Vi(m/s) Rep CD* FD(N) S (m)
 Breathing 2 1.3 22.96 0.98×10⁻¹⁴ 0.0089
 Talking 3.9 2.6 13.73 0.58×10⁻¹⁴ 0.011
206 *C is the Drag Coefficient (dependent on the Re ), dimensional less
 D p

207 Terminal settling velocity of the particle (VTS) was equal to 0.302 ×10⁻² m/s for 10 diameter
208 particles that are similar to Rohit et al studies (less than 2% difference) (Rohit, Rajasekaran et al. 2020). Singh
209 et al reported the terminal settling velocity is 3mm/s for 10 μm diameter particles (Singh and Kaur 2020) and
210 Wei et al indicated VTS is 0.246 m/s and 0.07 m/s for 100 µm and 50 µm particles, respectively (Wei and Li
211 2015). The relaxation time was 0.0308 ×10⁻² s for 10 μm diameter particles that are approximately similar to the
212 Wei et al studies. After this time, the particle’s velocity becomes uniform and occurs terminal settling. Singh et
213 al reported the relaxation time is 0.0003s for the 5 µm particles (Wei and Li 2015). Stopping distance is the
214 maximum distance a particle can travel with an initial velocity V i from the mouth in still air in the absence of
215 external forces. This parameter is 0.0089m and 0.011m for breathing and talking, respectively. But, Wei et al
216 reported stopping distance to the initial velocity of 10 m/s is 2.3×10⁻³m that is equal to 8.97×10⁻⁴ m for Vi=3.9
217 m/s (Wei and Li 2015). This difference between the results is due to the difference in particle diameter. Since
218 the drag force is very low, the particles can be easily dispersed in the living room. In this condition, due to lack
219 of air displacement in the living room, particles and viruses can remain suspended for a long time and therefore
220 may be inhaled by occupants.
221 Particle exhaust velocity (V(t)) at any time from the mouth depended on initial velocity, relaxation
222 time, terminal settling velocity and particle exhaust time (t) from the mouth. This velocity can be determinate
223 for breathing (14) and talking (15) as:

 (− )
224 Breathing: V(t)=0.302×10⁻²+1.99 0.0308×10⁻² (14)

 (− )
225 Talking: V(t)=0.302×10⁻²+3.89 0.0308×10⁻² (15)
226
227 Where t is time (second). By using these equations, particle exhaust velocity from the mouth can be
228 calculated at any time. When t>> τ, V(t) = VTS. Theoretically, V(t) never reaches its terminal settling velocity,
229 but in practice, V(t) reaches 63.2% of (VTS - Vi) when t = τ, and 99.3% of (VTS, - Vi) when t = 5 τ.

230 Air velocity measured and simulated in the computational domain shown in Figure 4. The maximum
231 error and root mean square error from the air velocity are 14% and 0.10, respectively. Therefore, this model has
232 good validity and different scenarios can be defined and simulated. Figure 5 shows the streamlines of air
233 velocity in the actual condition. In this case, air distribution in the living room is not suitable and air supplies
234 from the entrance door bottom and exhaust from the exterior door without air circulation.

 0.25
 y = 1.1636x - 0.002
 R² = 0.9916
 0.2
 simulation

 0.15

 0.1

 0.05

 0
 0 0.05 0.1 0.15 0.2 0.25
 Measurment
235
236
237 Fig. 4 Q-Q plot of air velocity (m/s)
238

 7
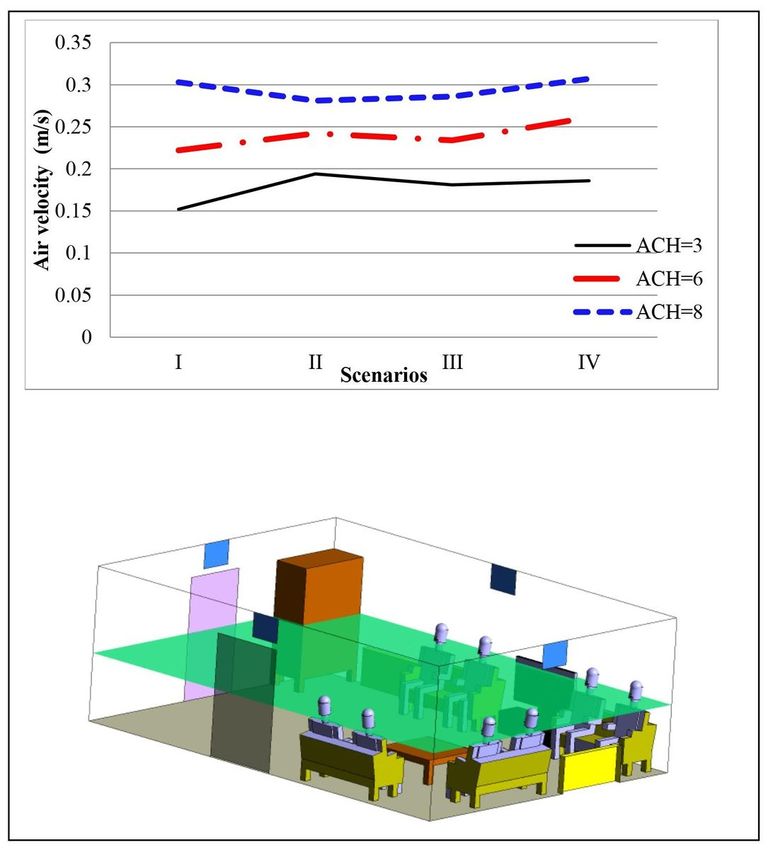
239

240
241
242 Fig. 5 Airflow pattern and streamlines of air velocity in actual condition
243
244
245
246
 0.35
247
248 0.3
249
 Air velocity (m/s)

 0.25
250
251 0.2
252 0.15
253 ACH=3
 0.1
254
 ACH=6
255 0.05
 ACH=8
256
 0
257 I II III IV
258 Scenarios
259
260
261
262
263
264
265
266
267
268
269
270
271
272
273
274
275 Fig. 6 Mean air velocity in different air changes per hour at z=1.1 m at the Isosurface
276

 8
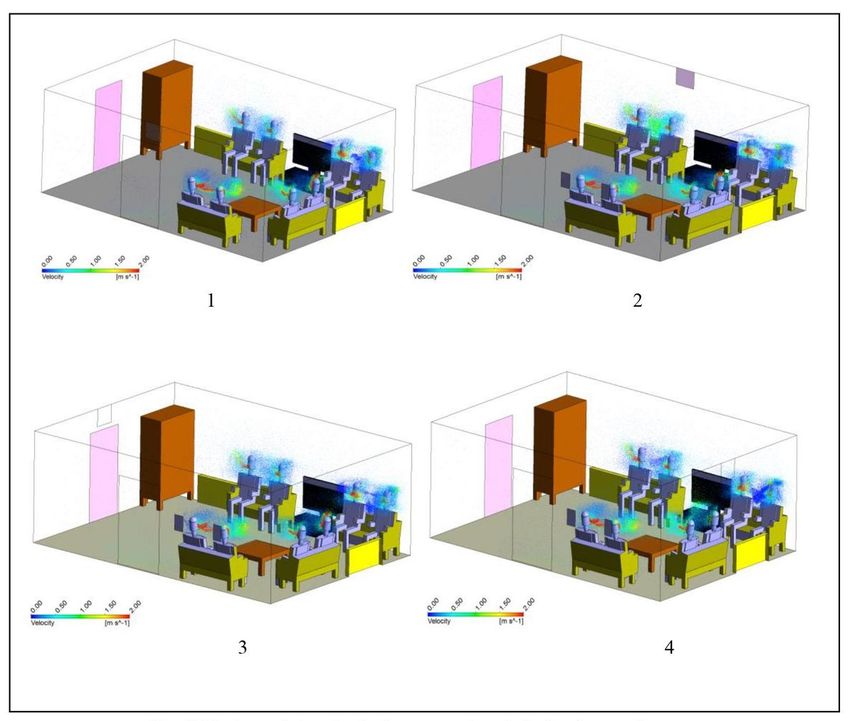
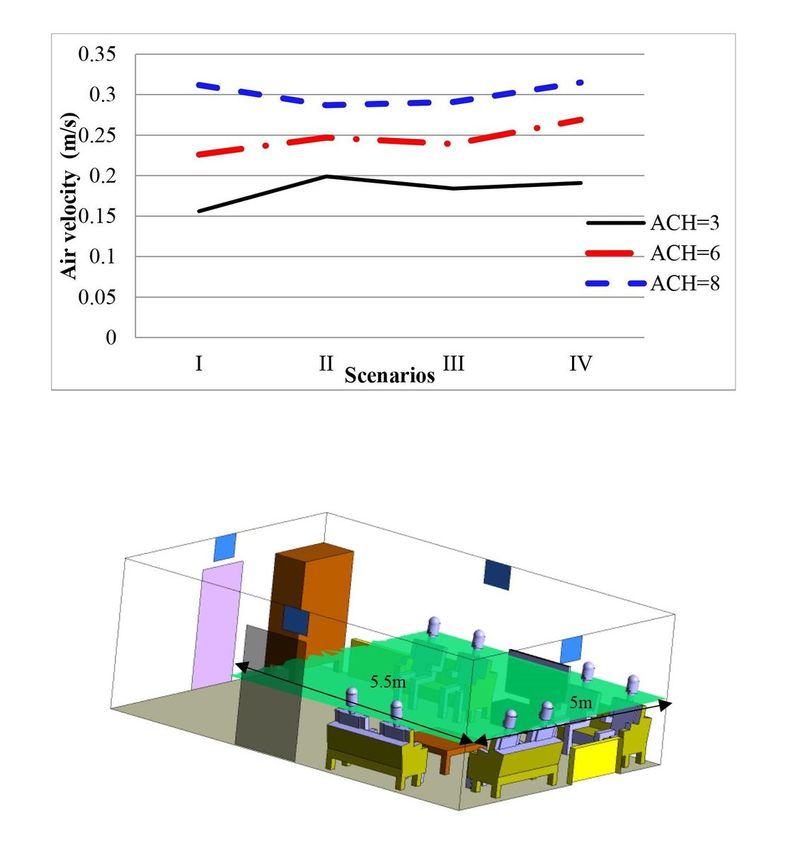
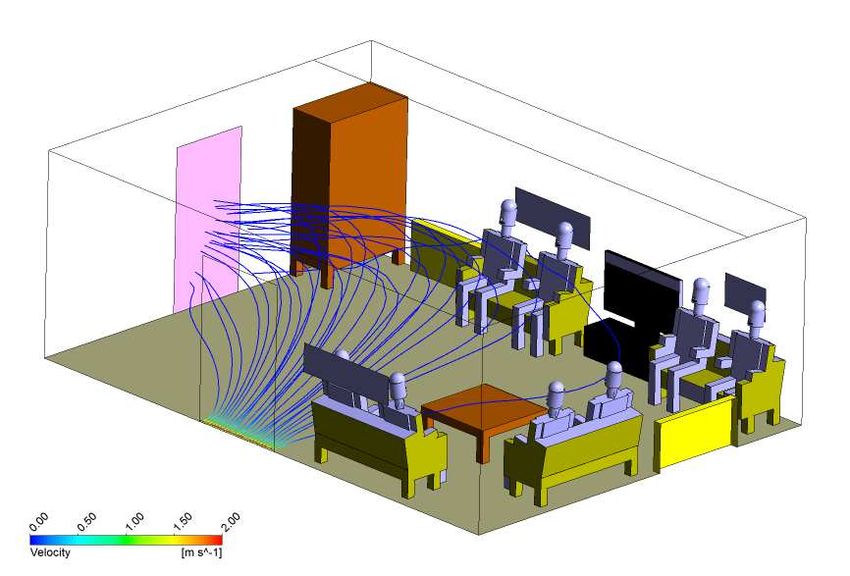
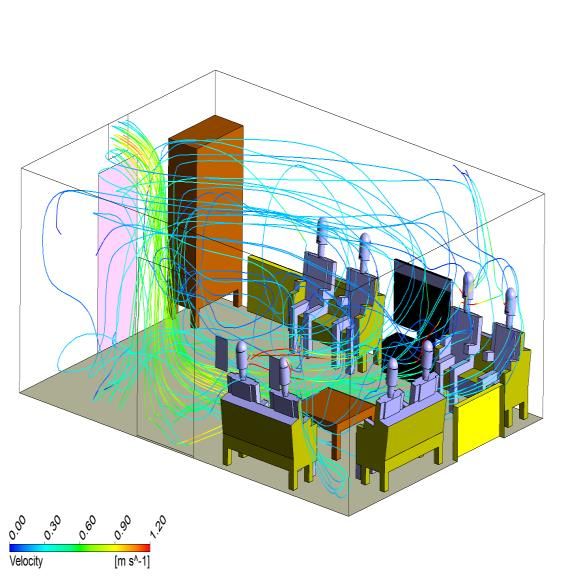
277 There is clear evidence that poor ventilation contributes to coronavirus spread (Bhagat, Wykes et al.
278 2020). Mechanical ventilation can reduce the airborne concentration of coronavirus. Figures 6-7 show the effect
279 of the supply air location (scenarios 1 to 4) and the air change rate in the living room (ACH equal to 3, 6 and 8)
280 on the mean air velocity in the 1.1 m height for Isosurface and plane surfaces. The maximum of mean air
281 velocity is in scenario 4 with ACH= 8, so that mean air velocity is 0.31 and 0.32 m/s in Isosurface and plane,
282 respectively. Gupta et al. reported that the air velocity should be in the range of 0.25–1.0 m/s that improves the
283 air movement and thus increases comfort (Gupta and Khare 2021). In this condition, particles remain suspended
284 in the living room for a longer time, increasing the likelihood that particles enter the occupant’s respiratory
285 system. But, increasing the air velocity and turbulence reduces the concentration of the particles in the living
286 room, which occurring a significant reduction in occupant’s exposure and reduces the risk of airborne
287 transmission. Therefore, it can be said, increased air velocity and turbulence causes reduce exposure and
288 infection probability.

289
290
291 0.35
292 0.3
293
 Air velocity (m/s)

294 0.25
295 0.2
296
297 0.15 ACH=3
298 ACH=6
 0.1
299
300 ACH=8
 0.05
301
302 0
303 I II III IV
 Scenarios
304
305
306
307
308
309
310
311
312
313
314
315 5.5m
316 5m
317
318
319
320
321
322
323 Fig. 7 Mean air velocity in different air changes per hour at z=1.1 m at the plane
324
325
326 Air movement is an important parameter that affects particle and virus dispersion(Gupta and Khare
327 2021). Figure 8 shows the airflow pattern streamlines in scenarios 1 to 4 with ACH= 8 (velocity maximum in
328 breathing zone). In scenarios 2 and 4, the most mixing occurred in the living room, and in scenario 4 there is the
329 mean air velocity highest in the room (figs. 6-7), therefore, there is the lowest risk of infectious diseases such as
330 coronavirus in scenario 4. Guo et al. found that effective airflow patterns are the most important infectious
331 disease control strategy by air diluting the around the infectious agent’s sources (Guo, Xu et al. 2020). Hence, it
332 is recommended that occupants seat near the air supply or locate the air supply close to the breathing zone
333 because using ventilation can reduce the risk of infectious aerosols.
334
335

 9
336
337
338
339
340
341
342
343
344
345
346
347
348 1 2
349
350
351
352
353
354
355
356
357
358
359
360
361 3 4
362
363 Fig. 8 Airflow streamlines for 4 scenarios in ACH=8
364
365
366 Figure 9 shows the vectors of air velocity in occupants exhale for 4 Scenarios. Because the exhaust air
367 velocity of the exhaled (2 m/s for breathing mode and 3.9 for talking) is higher than the mean air velocity at
368 1.1m height (approximately 0.3 m/s in ACH=8), air velocity vectors are similar approximately in all scenarios.
369 After breathing zone, air velocity the exhalation is closed to zero, thus micron particles can be settling at a short
370 distance and sub-micron and nanoparticle can be suspending in the living room for a long time.
371 Temperature and humidity can influence the COVID-19 stability. Hence, controlling the temperature
372 and humidity is beneficial for controlling the airborne transmission of the virus. But, there are limitations in
373 temperature and humidity changes in residential homes. Morris et al. found that in 21–23 ◦C temperature and
374 relative humidity of 65%, COVID-19 will not be reduced significantly (Morris, Yinda et al. 2020). Therefore,
375 controlling the temperature and humidity are impossible to exposure reduce to the coronavirus in the residential
376 home.
377

 10
378

 1 2

 3 4

379 Fig. 9 Vectors of air velocity in occupants exhale for 4 scenarios
380
381
382 Conclusions
383 Considering the potential of CFD modeling for indoor air simulating, this study focused to verify and
384 confirm the numerical simulation model in a living room of a residential home in a family gathering for
385 exposure control strategies in the coronavirus pandemic. The data obtained were then used for airflow pattern
386 and air velocity assessment in different scenarios. Coronavirus can be spread in the indoor environment, and
387 poorly ventilated places are considered to be high risk. Current advice is for buildings to be as well ventilated as
388 possible. The results showed that the air supply location and air change rate in the room could reduce exposure
389 to microorganisms such as coronavirus. However, our analysis suggests that avoiding family gatherings in
390 biological diseases outbreak. Otherwise, it is necessary to create a suitable airflow and pattern by the natural and
391 mechanical ventilation systems. It is also necessary to consider other health protocols such as maintaining social
392 distance, surface cleaning and disinfection, handwashing, and other strategies of good hygiene as well as heating
393 ventilation and air condition system.
394
395
396 Acknowledgments

397 The Authors appreciate the cooperation of Islamic Azad University of medical Sciences in Tehran

398 Authors’ Contributions

399 Majid Bayatian: Study design, Data collection, Simulation, Measurement, Validation

400 Khosro Ashrafi: Study design, Simulation

401 Zahra Amiri: Analytical Solution

 11
402 Elahe Jafari: Experimental sampling, Validation

403 All authors read and approved the final manuscript.

404 Funding

405 Not applicable
406
407 Availability of data and materials

408 The data that support the findings of this study are available on request from the corresponding author (such as
409 runs results, sampling results and etc.)

410

411 Compliance with ethical standards

412 Ethical Approval

413 Not applicable
414
415 Consent to Participate

416 Not applicable
417
418 Consent to Publish

419 Not applicable
420
421 Competing Interests

422 The authors declare that they have no competing interests

423
424
425
426
427 References:
428
429 Acter, T., N. Uddin, J. Das, A. Akhter, T. R. Choudhury and S. Kim (2020). "Evolution of severe acute
430 respiratory syndrome coronavirus 2 (SARS-CoV-2) as coronavirus disease 2019 (COVID-19) pandemic: A
431 global health emergency." Science of the Total Environment: 138996.
432 Asadi, S., N. Bouvier, A. S. Wexler and W. D. Ristenpart (2020). The coronavirus pandemic and aerosols: Does
433 COVID-19 transmit via expiratory particles?, Taylor & Francis.
434 Atangana, E. and A. Atangana (2020). "Facemasks simple but powerful weapons to protect against COVID-19
435 spread: Can they have sides effects?" Results in physics: 103425.
436 Azari, M. R., A. Sadighzadeh and M. Bayatian (2018). "Public health risk management case concerning the city
437 of Isfahan according to a hypothetical release of HF from a chemical plant." Environmental Science and
438 Pollution Research 25(25): 24704-24712.
439 Babu, P. and G. Suthar (2020). "Indoor air quality and thermal comfort in green building: a study for
440 measurement, problem and solution strategies." Indoor Environmental Quality: 139-146.
441 Bayatian, M., K. Ashrafi, M. R. Azari, M. J. Jafari and Y. Mehrabi (2018). "Risk assessment of occupational
442 exposure to benzene using numerical simulation in a complex geometry of a reforming unit of petroleum
443 refinery." Environmental Science and Pollution Research 25(12): 11364-11375.
444 Bhagat, R. K., M. D. Wykes, S. B. Dalziel and P. Linden (2020). "Effects of ventilation on the indoor spread of
445 COVID-19." Journal of Fluid Mechanics 903.
446 Bhattacharyya, S., K. Dey, A. R. Paul and R. Biswas (2020). "A novel CFD analysis to minimize the spread of
447 COVID-19 virus in hospital isolation room." Chaos, Solitons & Fractals 139: 110294.

 12
448 Blocken, B., F. Malizia, T. Van Druenen and T. Marchal (2020). "Towards aerodynamically equivalent
449 COVID19 1.5 m social distancing for walking and running." Preprint.
450 Chirizzi, D., M. Conte, M. Feltracco, A. Dinoi, E. Gregoris, E. Barbaro, G. La Bella, G. Ciccarese, G. La
451 Salandra and A. Gambaro (2020). "SARS-CoV-2 concentrations and virus-laden aerosol size distributions in
452 outdoor air in north and south of Italy." Environment International 146: 106255.
453 Coccia, M. (2020). "Factors determining the diffusion of COVID-19 and suggested strategy to prevent future
454 accelerated viral infectivity similar to COVID." Science of the Total Environment 729: 138474.
455 Contini, D. and F. Costabile (2020). Does air pollution influence COVID-19 outbreaks?, Multidisciplinary
456 Digital Publishing Institute.
457 Control, E. C. f. D. P. a. (2020). " Heating, ventilation and air-conditioning systems in the context of COVID-
458 19. 10 November 2020. Stockholm: ECDC."
459 Correia, G., L. Rodrigues, M. G. Da Silva and T. Gonçalves (2020). "Airborne route and bad use of ventilation
460 systems as non-negligible factors in SARS-CoV-2 transmission." Medical hypotheses 141: 109781.
461 Dhand, R. and J. Li (2020). "Coughs and sneezes: their role in transmission of respiratory viral infections,
462 including SARS-CoV-2." American journal of respiratory and critical care medicine 202(5): 651-659.
463 Di Maria, F., E. Beccaloni, L. Bonadonna, C. Cini, E. Confalonieri, G. La Rosa, M. R. Milana, E. Testai and F.
464 Scaini (2020). "Minimization of spreading of SARS-CoV-2 via household waste produced by subjects affected
465 by COVID-19 or in quarantine." Science of the Total Environment 743: 140803.
466 Fareed, Z., N. Iqbal, F. Shahzad, S. G. M. Shah, B. Zulfiqar, K. Shahzad, S. H. Hashmi and U. Shahzad (2020).
467 "Co-variance nexus between COVID-19 mortality, humidity, and air quality index in Wuhan, China: New
468 insights from partial and multiple wavelet coherence." Air Quality, Atmosphere & Health 13: 673-682.
469 Guo, M., P. Xu, T. Xiao, R. He, M. Dai and Y. Zhang (2020). "Review and comparison of HVAC operation
470 guidelines in different countries during the COVID-19 pandemic." Building and Environment: 107368.
471 Gupta, D. and V. R. Khare (2021). "Natural Ventilation Design: Predicted and Measured Performance of a
472 Hostel Building in Composite Climate of India." Energy and Built Environment 2(1): 82-93.
473 Han, L., W. Zhou, W. Li and Y. Qian (2018). "Urbanization strategy and environmental changes: An insight
474 with relationship between population change and fine particulate pollution." Science of the total environment
475 642: 789-799.
476 ISHRAE (2020). "covid-19 guidance document for air conditioning and ventilation."
477 Joppolo, C. M. and F. Romano (2017). HVAC system design in healthcare facilities and control of aerosol
478 contaminants: issues, tools, and experiments. Indoor Air Quality in Healthcare Facilities, Springer: 83-94.
479 Kim, K.-H., E. Kabir and S. A. Jahan (2018). "Airborne bioaerosols and their impact on human health." Journal
480 of Environmental Sciences 67: 23-35.
481 Klompas, M., M. A. Baker and C. Rhee (2020). "Airborne transmission of SARS-CoV-2: theoretical
482 considerations and available evidence." Jama.
483 Li, H., Y. Wang, M. Ji, F. Pei, Q. Zhao, Y. Zhou, Y. Hong, S. Han, J. Wang and Q. Wang (2020).
484 "Transmission routes analysis of SARS-CoV-2: A systematic review and case report." Frontiers in cell and
485 developmental biology 8: 618.
486 Luo, N., W. Weng, X. Xu, T. Hong, M. Fu and K. Sun (2019). "Assessment of occupant-behavior-based indoor
487 air quality and its impacts on human exposure risk: A case study based on the wildfires in Northern California."
488 Science of the total environment 686: 1251-1261.
489 Ma, N., D. Aviv, H. Guo and W. W. Braham (2021). "Measuring the right factors: A review of variables and
490 models for thermal comfort and indoor air quality." Renewable and Sustainable Energy Reviews 135: 110436.
491 Melikov, A. K., Z. Ai and D. Markov (2020). "Intermittent occupancy combined with ventilation: An efficient
492 strategy for the reduction of airborne transmission indoors." Science of The Total Environment 744: 140908.
493 Middha, P. (2010). "Development, use, and validation of the CFD tool FLACS for hydrogen safety studies."
494 Morawska, L., J. W. Tang, W. Bahnfleth, P. M. Bluyssen, A. Boerstra, G. Buonanno, J. Cao, S. Dancer, A.
495 Floto and F. Franchimon (2020). "How can airborne transmission of COVID-19 indoors be minimised?"
496 Environment international 142: 105832.
497 Morris, D. H., K. C. H. Yinda, A. Gamble, F. W. Rossine, Q. Huang, T. Bushmaker, R. J. Fischer, M. J.
498 Matson, N. van Doremalen and P. J. Vikesland (2020). "The effect of temperature and humidity on the stability
499 of SARS-CoV-2 and other enveloped viruses." bioRxiv.
500 Ni, M., H. Wang, X. Liu, Y. Liao, L. Fu, Q. Wu, J. Mu, X. Chen and J. Li (2021). "Design of Variable Spray
501 System for Plant Protection UAV Based on CFD Simulation and Regression Analysis." Sensors 21(2): 638.
502 RHODE, I. (2021). "COVID-19 Information, RHODE Island Department of Health, Official State of Rhode
503 Island website."
504 Rohit, A., S. Rajasekaran, I. Karunasagar and I. Karunasagar (2020). "Fate of respiratory droplets in tropical vs
505 temperate environments and implications for SARS-CoV-2 transmission." Medical hypotheses 144: 109958.
506 Sauermann (2020). "Air change rate: a vital measurement in the fight against COVID-19."
507 https://sauermanngroup.com/en-INT/insights/air-change-rate-vital-measurement-fight-against-covid-19.

 13
508 Sauermann, G. ( 2020). "Air change rate: a vital measurement in the fight against COVID-19."
509 Scheuch, G. (2020). "Breathing is enough: for the spread of influenza virus and SARS-CoV-2 by breathing
510 only." Journal of aerosol medicine and pulmonary drug delivery 33(4): 230-234.
511 Singh, N. and M. Kaur (2020). "On the airborne aspect of COVID-19 coronovirus." arXiv preprint
512 arXiv:2004.10082.
513 Sosnowski, M., R. Gnatowska, K. Grabowska, J. Krzywański and A. Jamrozik (2019). "Numerical analysis of
514 flow in building arrangement: Computational domain discretization." Applied Sciences 9(5): 941.
515 Sun, C. and Z. Zhai (2020). "The efficacy of social distance and ventilation effectiveness in preventing COVID-
516 19 transmission." Sustainable cities and society 62: 102390.
517 Suwardi, A., C. C. Ooi, D. Daniel, C. K. I. Tan, H. Li, O. Y. Z. Liang, Y. K. Tang, J. Y. Chee, A. Sadovoy and
518 S.-Y. Jiang (2021). "Research Article The Efficacy of Plant-Based Ionizers in Removing Aerosol for COVID-19
519 Mitigation."
520 Tong, X., S.-W. Hong and L. Zhao (2019). "CFD modelling of airflow pattern and thermal environment in a
521 commercial manure-belt layer house with tunnel ventilation." Biosystems engineering 178: 275-293.
522 Vuorinen, V., M. Aarnio, M. Alava, V. Alopaeus, N. Atanasova, M. Auvinen, N. Balasubramanian, H. Bordbar,
523 P. Erästö and R. Grande (2020). "Modelling aerosol transport and virus exposure with numerical simulations in
524 relation to SARS-CoV-2 transmission by inhalation indoors." Safety Science 130: 104866.
525 Wang, J., H. Feng, S. Zhang, Z. Ni, L. Ni, Y. Chen, L. Zhuo, Z. Zhong and T. Qu (2020). "SARS-CoV-2 RNA
526 detection of hospital isolation wards hygiene monitoring during the Coronavirus Disease 2019 outbreak in a
527 Chinese hospital." International Journal of Infectious Diseases 94: 103-106.
528 Wei, J. and Y. Li (2015). "Enhanced spread of expiratory droplets by turbulence in a cough jet." Building and
529 Environment 93: 86-96.
530 Wen, H. and L. Malki-Epshtein (2018). "A parametric study of the effect of roof height and morphology on air
531 pollution dispersion in street canyons." Journal of Wind Engineering and Industrial Aerodynamics 175: 328-
532 341.
533 WHO (2021). "World Health Organization(WHO) Coronavirus Disease (COVID-19) Dashboard."
534 Xu, C., X. Luo, C. Yu and S.-J. Cao (2020). The 2019-nCoV epidemic control strategies and future challenges
535 of building healthy smart cities, SAGE Publications Sage UK: London, England.
536 Xu, C., P. V. Nielsen, L. Liu, R. L. Jensen and G. Gong (2017). "Human exhalation characterization with the aid
537 of schlieren imaging technique." Building and environment 112: 190-199.
538 Yang, L. and M. Ye (2014). "CFD simulation research on residential indoor air quality." Science of the Total
539 Environment 472: 1137-1144.
540 Zhang, Y. (2004). Indoor air quality engineering, CRC press.
541

 14
Figures

Figure 1

Geometry of computational domain
Figure 2

Isometric view of the surface mesh of the ow domain
Figure 3

The effects of the cell number on the average air velocity

Figure 4

Q-Q plot of air velocity (m/s)
Figure 5

Air ow pattern and streamlines of air velocity in actual condition
Figure 6

Mean air velocity in different air changes per hour at z=1.1 m at the Isosurface
Figure 7

Mean air velocity in different air changes per hour at z=1.1 m at the plane
Figure 8

Air ow streamlines for 4 scenarios in ACH=8
Figure 9

Vectors of air velocity in occupants exhale for 4 scenarios
You can also read