CONSISTENCY & GROWTH - Jim Beyer - Managing Director & CEO 13September2021 ASX:RRL - Open Briefing

Page created by Kelly Stevenson
 
CONTINUE READING
CONSISTENCY & GROWTH - Jim Beyer - Managing Director & CEO 13September2021 ASX:RRL - Open Briefing
CONSISTENCY & GROWTH

Jim Beyer – Managing Director & CEO
13 September 2021      ASX:RRL
CONSISTENCY & GROWTH - Jim Beyer - Managing Director & CEO 13September2021 ASX:RRL - Open Briefing
2   CAUTIONARY STATEMENT
    This presentation contains only a brief overview of Regis Resources Limited and its associated       In each case, appropriate Competent Person’s consents were obtained for the release of that
    entities (“Regis or RRL") and their respective activities and operations. The contents of this       information in the Relevant ASX Announcements and those consents remain in place for
    presentation, including matters relating to the geology of Regis’ projects, may rely on various      subsequent releases by the Company of the same information in the same form and context,
    assumptions and subjective interpretations which it is not possible to detail in this presentation   until the consent is withdrawn or replaced by a subsequent report and accompanying consent.
    and which have not been subject to any independent verification.
                                                                                                         The Company confirms that it is not aware of any new information or data that materially
    This presentation contains a number of forward-looking statements that are subject to risk           affects the information included in the Relevant ASX Announcements and in each case the
    factors associated with gold exploration, mining and production businesses. It is believed that      Production Targets, forecast financial information and estimates of Mineral Resources or Ore
    the forward looking statements in this presentation are reasonable based on information              Reserves, that all material assumptions and technical parameters underpinning that
    available as at the date of this presentation but known and unknown risks and uncertainties,         information in the Relevant ASX Announcements, continue to apply and have not materially
    and factors outside of Regis’ control, may cause the actual results, performance and                 changed. The Company confirms that the form and context in which the Competent Person’s
    achievements of Regis to differ materially from those expressed or implied in this presentation.     findings are presented have not been materially modified from the original ASX
    These risk factors include, but are not limited to, changes in commodity prices, foreign             announcement.
    exchange fluctuations and general economic conditions, increased costs and demand for
    production inputs, the speculative nature of exploration and project development, including          Past performance and pro-forma financial information given in this document, including in
    the risks of obtaining necessary licenses and permits and diminishing quantities or grades of        relation to upgrades to resources and reserves, is given for illustrative purposes only and
    reserves, political and social risks, changes to the regulatory framework within which the           should not be relied upon as (and is not) an indication of future performance, nor of Regis'
    Company operates or may in the future operate, environmental conditions including extreme            views on the Company's future financial performance or condition. Investors should note that
    weather conditions, recruitment and retention of personnel, industrial relations issues and          past performance of Regis, including the historical trading prices of its shares, cannot be relied
    litigation. Readers are cautioned not to place undue reliance on forward looking statements.         upon as an indicator of (and provides no guidance as to) Regis’ future performance, including
    No representation or warranty, express or implied is made as to the accuracy, currency or            the future trading price of its shares. The historical information included in this presentation is,
    completeness of the information in this presentation, nor the future performance of Regis.           or is based on, information that has previously been released to the market.
    Except as required by applicable law or regulations, Regis does not undertake to publicly
    update or review any forward-looking statements, whether as a result of new information or           As noted above, an investment in Regis shares is subject to known and unknown risks, some of
    future events. Current and potential investors and shareholders should seek independent              which are beyond the control of Regis. Regis does not guarantee any particular rate of return
    advice before making any investment decision in regard to Regis or its activities.                   or the performance of the Company, nor does it guarantee the repayment of capital from Regis
                                                                                                         or any particular tax treatment.
    The information in this presentation that relates to production targets and associated forecast
    financial information is extracted from the ASX announcement released 29 July 2021 entitled          The distribution of this presentation (including an electronic copy) outside of Australia
    “Quarterly Report to 30 June 2021”. Mineral Resources and Ore Reserves is extracted from the         (including the United States) may be restricted by law and any such restrictions should be
    Mineral Resource and Ore Reserve Statement released to the ASX on 21 April 2021 & 15 June            observed. Any non-compliance with these restrictions may contravene applicable securities
    2021 (the Relevant ASX Announcements).                                                               laws.

                                                                                                         ASX announcements are available on the Company’s website at www.regisresources.com.au
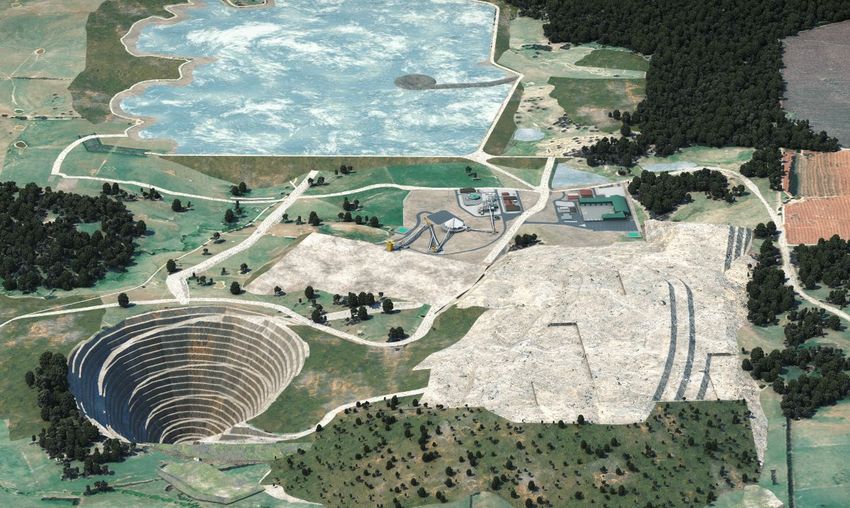
CONSISTENCY & GROWTH - Jim Beyer - Managing Director & CEO 13September2021 ASX:RRL - Open Briefing
3
             CONSISTENCY & GROWTH
                        Elevating Sustainability Reporting

                       Strong Financial Position                                                                                  MOOLART WELL
                                                                                                                                    2.5Mtpa

                       Low Cost Producer

                        Consistent and Reliable                                                                                       GARDEN WELL
                                                                                                    ROSEMONT 2.0Moz                   in 5Mtpa
                                                                                                                                         Reserves
                        Performance                                                                  2.5Mtpa

                        A$532m in dividends paid
                        and/or declared since 20131                                                                                                                                              McPHILLAMYS PROJECT
                                                                                                                                                                                                   2.0 Moz Ore Reserve
                       Strong Value Growth Profile                                                                                                                                                 Potential ~200 kozpa Au

         ASX Code                                            RRL
         Market capitalisation2                              A$1.6B             US$1.2B
                                                                                                                                                                 TROPICANA
         Total    Resources3                                 10.4Moz                                                                                               9Mtpa
         Total Reserves3                                     4.8Moz
    (1) Including 3cps declared 31 August 2021. (2) As at 10 September 2021. AUD:USD - 1.00:0.74 (3) ASX release – Mineral Resource and Ore Reserves Statement – 21 April 2021 & 15 June 2021.
CONSISTENCY & GROWTH - Jim Beyer - Managing Director & CEO 13September2021 ASX:RRL - Open Briefing
4         TRANSPARENT ESG REPORTING
           Delivering improved safety results                             Aligning to UN Sustainable Development Goals and the
                                                                          Task Force on Climate-related Financial Disclosures
                                                                                                          Safety &
    6.0                                                                   Environmental                    Health
                                                                          Stewardship
                                                                                                                     Supply
    5.0                  Lost Time Injury Frequency Rate                                                             Chain

    4.0
                                                                                                                         Shared Values
    3.0                                                                   Risk                                             with Host
                                                                          Management                                     Communities
    2.0
                                                                                                                     Employment +
    1.0                                                             1.3                                               Workforce
                                                                                                                     Management
                                                                                 Corporate
    0.0                                                                          Conduct
      Mar-20    Jun-20       Sep-20   Dec-20   Mar-21      Jun-21
                                                                                                Indigenous
                                                                                              Opportunities +
                                                                                             Respect for Culture

                                               33%
                                         Female Board members
          23%
          Female employees
    (above WA Mining Industry average)
CONSISTENCY & GROWTH - Jim Beyer - Managing Director & CEO 13September2021 ASX:RRL - Open Briefing
5        FY21 FINANCIAL HIGHLIGHTS

                  NPAT of A$146m                                                                                                                                                               Cash flow from
                                                                                                      EBITDA of A$403m      1
              NPAT Margin of 18%                                                                                                                                                             operating activities
                                                                                                          EBITDA Margin 49%
            EPS of 26 cents per share                                                                                                                                                             A$276m

                      Cash & Bullion                                                               Full Year Dividends
                        A$269m2                                                                        7c per share                                                                     Acquisition of 30% of
                                                                                                    3.3% basic yield                                                                   Tropicana Gold Project
                   Net Debt of A$31.3m3                                                          4.7% grossed up yield4

    1.   EBITDA is an adjusted measure of earnings before interest, taxes, depreciation and amortisation. EBITDA is non-IFRS financial information and is not subject to audit. The measure is included to assist investors to better understand the
         performance of the business.
    2.   Includes bullion on hand valued at A$2,337 per ounce
    3.   Based on cash and bullion on hand of A$268.7 million at 30 June 2021 and long-term debt of A$300 million
    4.   Grossed up for 100% franking. Annualised dividend yield of 7cps at a closing share price of $2.15 on 10 September 2021
CONSISTENCY & GROWTH - Jim Beyer - Managing Director & CEO 13September2021 ASX:RRL - Open Briefing
6        FY2021 FULL YEAR FINANCIAL RESULTS
                                                                              Unit                         FY2021                         FY2020
    Ounces Produced                                                             oz                        372,870                        352,042
    Ounces Sold                                                                 oz                        365,830                        353,182
    Average Realised Price                                                   A$/oz                            2,229                          2,200     373Koz Production
    Revenue1                                                                  A$m                             819.2                          756.7
                                                                                                                                                          + 5.9 % Growth
    Royalties                                                                 A$m                             (38.8)                         (37.4)
    Cost of Sales                                                             A$m                           (543.9)                        (414.7)
                                                                                                                                                       A$819m Revenue
    Gross Profit                                                              A$m                             236.5                          304.6
                                                                                                                                                          + 8.3 % Growth
    Other Income/(Expenses)                                                   A$m                               (0.4)                          (0.2)
    Administration and Other Costs                                            A$m                             (20.8)                         (16.1)
    Finance Costs                                                             A$m                               (2.3)                          (2.0)
                                                                                                                                                       A$403m EBITDA2
    Exploration expenditure written off                                       A$m                               (0.6)                          (1.7)      + 2.3 % Growth
    Profit Before Tax                                                         A$m                             212.4                          284.6
    Income Tax Expense                                                        A$m                             (66.2)                         (85.1)
    Net Profit After Tax                                                      A$m                             146.2                          199.5
    All-in-Sustaining-Costs                                                  A$/oz                            1,372                          1,246
    1.   In FY2020, sales revenue is net of A$21.2m in capitalised revenue generated from pre-production assets
    2.   EBITDA is an adjusted measure of earnings before interest, taxes, depreciation and amortisation. EBITDA is non-IFRS financial information
         and is not subject to audit. The measure is included to assist investors to better understand the performance of the business
CONSISTENCY & GROWTH - Jim Beyer - Managing Director & CEO 13September2021 ASX:RRL - Open Briefing
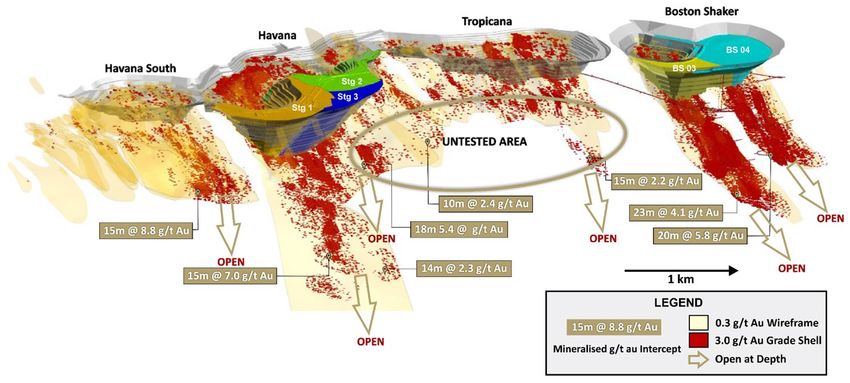
7        OVER HALF A BILLION DOLLARS IN DIVIDENDS SINCE 2013
         Strong business performance sees Regis again declare a dividend
                                                                                                                                                                      Dividends Declared
                                                                                                                                               18                                                           600
          Final dividend of 3 cps (A$22.6m) fully franked payout
                                                                                                                                               16
          Total dividends for FY21 of 7 cps (A$43.1m) fully franked                                                                                                                                         500
                     29.5% of FY21 NPAT and 10.7% of EBITDA1                                                                                   14

                     3.3% basic dividend yield 2                                                                                               12                              8      8       8             400

                                                                                                                             Cents per Share
                     4.7% grossed up (for 100% franking) dividend                                                                                                        8

                                                                                                                                                                                                                  $ Millions
                                                                                                                                               10
                     yield                                                                                                                                                                                  300
                                                                                                                                               8               9
          Regis has paid and/or declared 104cps - A$532 million in
          dividends from 2013 to 2021
                                                                                                                                               6                                                            200
                                                                                                                                                                                                      3
          Dividend Reinvestment Plan in place
                                                                                                                                               4                               8      8       8
                                                                                                                                                                         7                                  100
                                                                                                                                                      6
                                                                                                                                               2               4                                      4
    Level of future dividends will continue to be assessed in the
    context of gold price, operational performance and planned                                                                                 0                                                            0
    capital expenditure                                                                                                                             2015      2016     2017   2018   2019   2020    2021
                                                                                                                                                    Interim          Final     Cumulative Dividends (from 2013)
    1.   EBITDA is an adjusted measure of earnings before interest, taxes, depreciation and amortisation. EBITDA is
         non-IFRS financial information and is not subject to audit. The measure is included to assist investors to better
         understand the performance of the business
    2.   Annualised dividend yield of 7cps at a closing share price of $2.15 on 27 August 2021
CONSISTENCY & GROWTH - Jim Beyer - Managing Director & CEO 13September2021 ASX:RRL - Open Briefing
8   CASHFLOW WATERFALL (A$)
    Strong cashflow from operations allows for significant capital investment, exploration programs and dividends
                                                                            Cash & Bullion on Hand - 30 June 2021
                 $700m

                 $600m                            $378m

                 $500m

                                                                 ($138m)
                 $400m
                                                                                ($45m)                     $353m
                                                                                         ($42m)   ($10m)
                 $300m                                                                                                               $44m   $269m
                                                                                                                   ($77m)
                                  $209m
                 $200m                                                                                                      ($51m)

                 $100m

                                                      -                 -         -        -        -
                         -

            1.   Includes bullion on hand valued at A$2,337 per ounce
CONSISTENCY & GROWTH - Jim Beyer - Managing Director & CEO 13September2021 ASX:RRL - Open Briefing
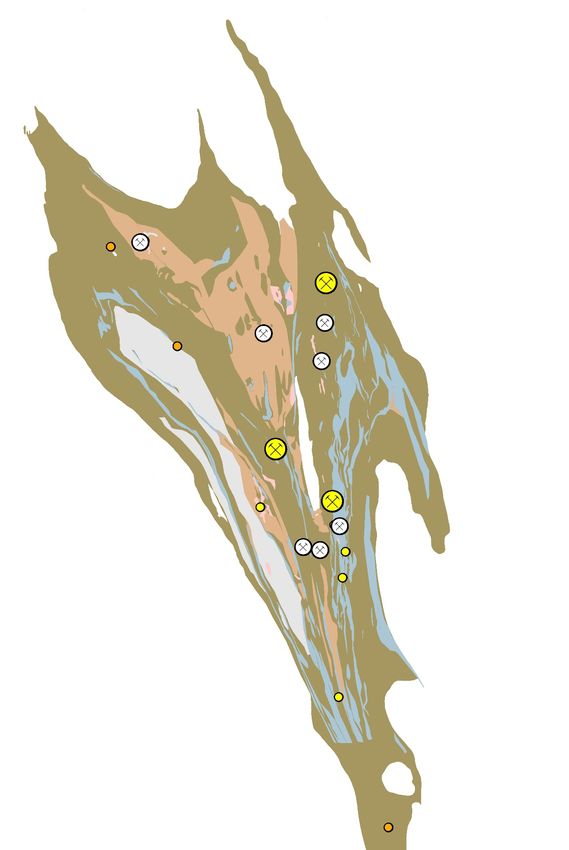
9                        KEY ELEMENTS OF VALUE GROWTH
                                                                                    Exploration & Optimisation
                                                                                    Life Extension Growth
                                                                      McPhillamys
    Increasing Business Value

                                                                      Step Change Growth

                                                        Tropicana (30%)
                                                        Step Change Growth

                                Additional Underground Mines
                                Incremental Growth

                                Moolart Well
                                Garden Well
                                Rosemont
                                Consistent & Reliable

                                                                                                      Time
CONSISTENCY & GROWTH - Jim Beyer - Managing Director & CEO 13September2021 ASX:RRL - Open Briefing
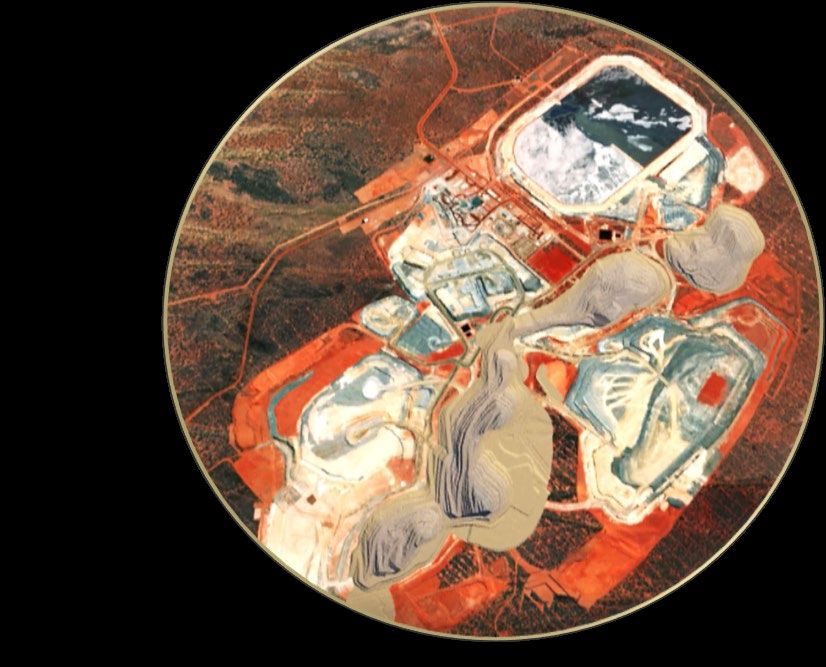
10        DUKETON OPERATION OVERVIEW
                  FY22 Guidance              Duketon
          Production (oz)                340,000 – 380,000
          AISC (US$/oz)1                    990 – 1,040
          AISC (A$/oz)                      1,340 - 1,410
          Growth Capital (A$M)                 85 - 90                             MOOLART WELL
          Exploration (A$M)                      35              DUKETON PROJECT     2.5Mtpa

                   5.4Moz in Resources and 2.0Moz in Reserves

                   Three operating centres in Garden Well,      ROSEMONT
                   Moolart Well and Rosemont                     2.5Mtpa           GARDEN WELL
                                                                                      5Mtpa

                   Consistent and reliable gold production

                   History of reserve replacement

     1.    AUD:USD - 1.00:0.74
11     INCREMENTAL GROWTH FROM UNDERGROUND
       Now with two underground mines
       Value created with high grade UG ore displacing lower grade OP ore

       FEASIBILITY MATERIAL MINED
     1.8Mt @ 3.2 g/t Au for 190koz Au
                                                                MORE UG PROJECTS IN THE EVALUATION PIPELINE
12         TROPICANA OPERATION OVERVIEW
           Joint Venture between AngloGold Ashanti (70%) & Regis (30%)
                  FY22 Guidance              Tropicana (30%)
          Production (oz)                    120,000 – 135,000
          AISC (US$/oz)1                         845 – 910
          AISC (A$/oz)                         1,140 - 1,230
          Growth Capital (A$M)                    70 - 75
          Exploration (A$M)                          8

                  2.3Moz in Resources and 0.8Moz in Reserves (30%)

                 Low cost, high margin operation currently in an
                 investment phase

                 Strong history of reserve replacement with all
                 deposits open at depth and clear pathway to extend
                 mine life
                                                                      Life-of-mine

                                                                      10+
                                                                         years
                 450koz – 500kozpa production returns as increasing
                 high grade ore is delivered from Havana OP and
                 Boston Shaker UG
     1.   AUD:USD - 1.00:0.74
13
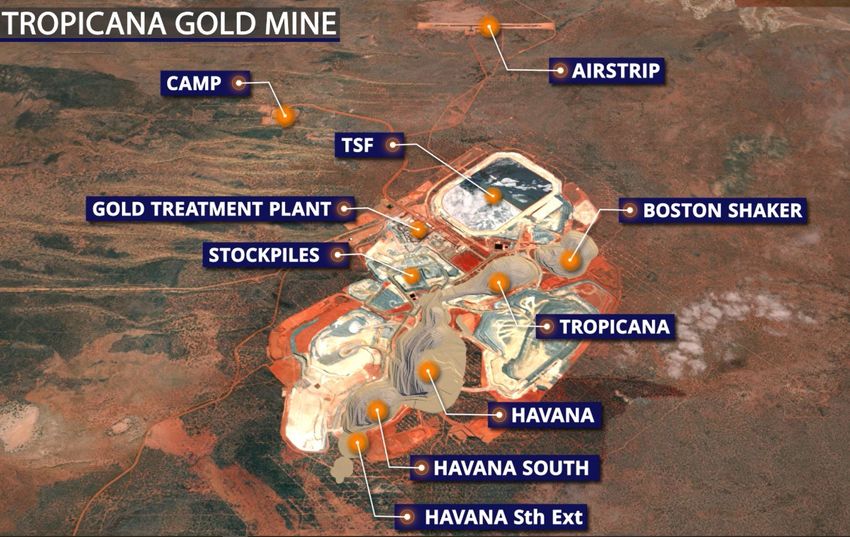
     TROPICANA – MULTIPLE GROWTH OPPORTUNITIES

     Processing grown to 9Mtpa with further
     optimisation available

     Havana OP and multiple UG mines
     supporting a 10+ year operational future

     Boston Shaker UG
      • full production rate of 1.1Mtpa
      • increased grade mill feed
     Additional UG mining opportunities at
     Tropicana Gold Mine
     Havana UG will form part of a PFS study
     in 2022
     Approximately 2Mtpa from UG in 2027        Life-of-mine

     onwards if studies are successful          10+
                                                   years
14    MCPHILLAMYS – APPROVALS IN FINAL STAGE

                                                                          MINERAL RESOURCE
                                                                          2.29 Moz Au

                                                                          ORE RESERVE
                                                                          2.02 Moz Au

                                                                          PRODUCTION
                                                                          Up to ~200kozpa Au

                                                                          SATELLITE PROJECT
                                                           Life-of-mine   Discovery Ridge
                                                            10+           390koz Au Resource
                                                              years

     One of Australia’s largest undeveloped open pittable gold resources
15   REGIONAL EXPLORATION

                                                       Dominant land positions
                                                       and underexplored
                                                       satellite deposits
                                                                                                Angel Eyes
        Matts Bore         Central
                                        MOOLART WELL   Targeting new +1Moz                      Springbok
                            Zone
                                                       discoveries                TROPICANA
              Betelgeuse
                                                                                        Rusty Nail
         Risden Well
100km                                  Campervan
                     ROSEMONT                                                                                  100km
                                                                                     Madras
                                        GARDEN WELL
                                                                                    New Zebra

                            Western
                           Sediments

          Exploration                  Swincers
                                                                                                 Exploration
            Budget                                                                              Budget A$27m
            A$33m                                                                                A$8m (30%)

        Duketon Greenstone Belt                                          Albany Fraser Belt
REVIEW OF FY2021
16

             GROWTH
                            Acquisition of 30% interest in Tropicana Gold Project completed
                            Acquisition of Ben Hur gold deposit completed
                            35% increase in Group Mineral Resources and 33% increase in Group Ore Reserves
                            Ramp-up of Rosemont Underground Mine
                            Commenced development of Garden Well Underground Mine

               BUSINESS PERFORMANCE
                            Net profit after tax of A$146 million with a NPAT margin of 18%
                            Dividends for FY2021 of 7 cents per share fully franked for a 4.7% grossed1 up yield
                            EBITDA of A$403 million with strong EBITDA margin of 49%
                            Net Debt of A$31.3 million 2 as at 30 June 2021

       1.   Grossed up for 100% franking. Annualised dividend yield of 7cps at a closing share price of $2.15 on 10 September 2021
       2.   Includes cash and gold on hand of A$268.7 million with gold on hand valued at A$2,337 per ounce as at 30 June 2021 and long term debt of $300 million
17         FY22 GUIDANCE – PRODUCTION SET FOR A STEP CHANGE
              A step change in production is expected in FY22 with a significant increase in total group production driven
                                                 by Regis’ 30% interest in Tropicana.
                                                                                                                                                                             600
                         Operation                              Duketon                Tropicana (30%)                     Group
                                                                                                                                                                             500

                                                                                                                                                          Production (koz)
                    Production (koz)                           340 – 380                    120 – 135                   460 – 515                                            400

                     AISC (US$/oz) 1                          990 – 1,040                   845 – 910                  955 – 1,010                                           300

                        AISC (A$/oz)                         1,340 - 1,410               1,140 - 1,230               1,290 - 1,365                                           200
                Growth Capital (A$M)2                             85 - 90                      70 - 75                  155 - 165
                                                                                                                                                                             100
                    Exploration and
                                                                      35                           8                          723
                   McPhillamys (A$M)                                                                                                                                          -
                                                                                                                                                                                   2017   2018      2019 2020     2021   2022
                                                                                                                                                                                                 Guidance range
     As noted previously, the September quarter is expected to be soft due to
     major scheduled mill shutdowns, open pit re-scheduling requirements and
     Rosemont underground rebasing into its steady state production rates.

     1.   AUD:USD 1.00:0.74
     2.   Growth Capital includes open pit and underground pre-production mining costs, pre-strip costs, camp expansion costs and other growth related project
          and property, plant and equipment costs
     3.   Group includes guidance for expenditure associated with McPhillamys of A$29 million for FY22
Additional Financial Information
19
     FY2021 – Profit & Loss
                                                    30 June 2021      30 June 2020
                                                      A$’000                A$’000
          Revenue                                           819,162            756,657
          Cost of goods sold                              (582,659)          (452,011)
          Gross profit                                      236,503            304,646
          Other income                                        (402)             (1,365)

          Investor and corporate costs                      (4,687)            (3,408)
          Personnel costs                                  (10,674)           (10,062)
          Share-based payment expense                       (3,934)              (144)
          Occupancy costs                                     (767)              (245)
          Other corporate administrative expenses             (770)            (1,052)
          Exploration and evaluation written off              (610)            (1,686)
          Finance costs                                     (2,265)            (2,024)
          Profit before income tax                         212,394            284,660

          Income tax expense                               (66,196)           (85,143)
          Net profit                                       146,198            199,517

          Earnings Per Share (cents per share)               26.37               39.26
20
     FY2021 – Cash Flow Statement
                                                                    30 June 2021   30 June 2020
                                                                          A$’000         A$’000
        Cash flows from operating activities
        Receipts from gold sales                                       790,619        755,791
        Payments to suppliers and employees                          (435,767)      (348,923)
        Income tax paid                                               (77,125)       (63,792)
        Other receipts/(payments)                                       (1,441)           (63)
        Net cash from operating activities                             276,286        343,013
        Cash flows from investing activities
        Acquisition of plant and equipment (net)                       (21,139)      (51,114)
        Payments for exploration and evaluation                        (43,899)      (37,118)
        Payments for acquisition of assets (net of cash acquired)     (885,001)
        Payments for acquisition of exploration assets                  (1,036)      (21,281)
        Payments for mine properties under development                  (8,050)      (57,307)
        Payments for mine properties                                  (129,598)      (77,524)
        Other receipts/(payments)                                            38             -
        Net cash used in investing activities                       (1,088,685)     (244,344)
        Cash flows from financing activities
        Proceeds from issue of shares                                 650,026             279
        Payment of transaction costs                                   (9,594)            (14)
        Payment of lease liabilities                                  (20,397)       (13,894)
        Dividends paid                                                (51,089)       (81,309)
        Proceeds of borrowing                                         293,652                -
        Net cash generated/(used) in financing activities             862,598        (94,938)
        Net increase/(decrease) in cash and cash equivalents            50,199          3,731
        Cash and cash equivalents at 1 July                           192,428        188,697
        Cash and cash equivalents at 30 June                           242,627       192,428
FY2021 – Balance Sheet                          30 June 2021    30 June 2020
21                                                      A$’000          A$’000
            Current assets
            Cash and cash equivalents                     242,627       192,428
            Inventories                                   161,475        74,430
            Other current assets                           19,413        10,847
            Total current assets                          423,515       277,705
            Non-current assets
            Inventories                                    185,643       63,503
            Property, plant and equipment                  335,618      261,676
            Exploration and evaluation expenditure         491,702      230,260
            Mine properties under development               18,655        2,188
            Mine properties                                794,640      275,939
            Right-of-use assets                             60,704       38,034
            Other                                            2,688        2,572
            Total non-current assets                     1,889,650      874,172
            Total assets                                 2,313,165    1,151,877
            Current liabilities
            Trade and other payables                      151,348        74,181
            Income tax payable                                325         7,471
            Lease liabilities                              24,481        15,856
            Provisions                                      5,975         3,994
            Total current liabilities                     182,129       101,502
            Non-current liabilities
            Deferred tax liabilities                       113,624      117,408
            Provisions & lease liabilities                 139,286       97,886
            Long term borrowings                           293,821            -
            Total non-current liabilities                  546,731      215,294
            Total liabilities                              728,860      316,796
            Net Assets                                   1,584,305      835,081
            Total Equity                                 1,584,305      835,081
22   Continued Reduction in Hedge Book

          Regis’ hedge position reduced to 320koz at 30 June 2021 from ~399koz at 30 June 2020

          During the year Regis, transitioned from spot deferred hedging to flat forwards which simplifies its
          hedging structure

          From 1 July 2021, Regis has accelerated its hedge deliveries and will deliver 25,000 ounces per
          quarter into the hedge book in FY22 at a fixed price of A$1,571 per ounce

                                          Table 1: Hedge Delivery Profile

                                        Financial Year         Hedge Deliveries
                                           FY 2022                100,000oz
                                           FY 2023                100,000oz
                                           FY 2024                120,000oz
23   FY2021 PHYSICALS

                                                  FY FY2021                     FY2020

                                       DNO      DSO    TROPICANA       TOTAL     TOTAL    Variance
           Physicals
                                                         @30%

           Ore mined (Mbcm)            1.50     2.50           0.05      4.05      4.16       -3%

           Waste mined (Mbcm)         11.51    15.60           1.16     28.27     26.37       +7%

           Stripping ratio (w:o)        7.7      6.2           25.3       7.0       6.3      +11%

           Ore mined (Mtonnes)         2.86     7.03           0.17     10.06      9.98       +1%

           Ore milled (Mtonnes)        3.15     6.34           0.43      9.92      9.37       +6%

           Head grade (g/t)            0.92     1.44           1.39      1.27      1.25       +2%

           Recovery (%)               90.7%    92.1%          89.9%    91.6%     93.5%        -2%

           Gold production (ounces)   84,566 270,987       17,317     372,870   352,042       +6%
24     SOLID PERFORMANCE ON KEY FINANCIAL METRICS (A$)
       FY21 a transformational year with Tropicana acquisition
                                                                                                                                                                Net Profit After Tax and Margin
                               Production, Realised Gold Price & AISC
                  400                                         361         363            373     $2,500                                          250                                                                                          35%
                                                                                  352
                  350                             324                                                                                                                                                                  200                    30%
                          310         305
                                                                                                 $2,000                                          200
                  300                                                                                                                                                                       174
                                                                                                                                                                                                         163                                  25%
                  250                                                                                                                                                            138                                                 146
                                                                                                 $1,500                                          150

                                                                                                                               $Millions
                                                                                                                                                                                                                                              20%

                                                                                                          AISC/oz
                                                                                                                                                                       112
     Koz

                  200
                                                                                                 $1,000                                          100      87                                                                                  15%
                  150
                                                                                                                                                                                                                                              10%
                  100
                                                                                                 $500                                            50
                   50                                                                                                                                                                                                                         5%

                   -                                                                             $0                                               0                                                                                           0%
                         2015     2016        2017          2018       2019       2020   2021                                                            2015         2016      2017        2018         2019          2020      2021

                        Gold Production                 Realised Gold Price Per Oz          AISC Per Oz                                                                         NPAT           NPAT Margin

                                            EBITDA and Margin                                                                                                       Earnings & Dividend per Share
                  450                                                                     403    100%                                            45
                                                                                  394                                                                                                                                   39.3
                  400                                                                                                                            40                                         34.6
                                                                                                 80%                                                                                                     32.2

                                                                                                          EBITDA/Revenue (%)
                  350                                         313         307                                                                    35

                                                                                                                               Cents per Share
                                                                                                                                                 30                             27.6                                                  26.4
                  300                             253
                                      234
     $ Millions

                                                                                                 60%                                             25                  22.4
                  250
                         181                                                                                                                     20    17.4                                       16.0          16.0          16.0
                  200                                                             52%                                                                                                15.0
                                            47%         47%         52%                  49%     40%                                                                    13.0
                  150                                                       47%                                                                  15
                                39%
                  100                                                                                                                            10           6.0                                                                            7.0
                                                                                                 20%
                   50                                                                                                                             5
                    0                                                                            0%                                               0
                         2015     2016        2017         2018        2019       2020   2021                                                           2015          2016       2017        2018          2019           2020             2021

                                             EBITDA                 EBITDA Margin (%)                                                                                          EPS      Dividend per share
25
26
Further information:
Jim Beyer | Managing Director & CEO
+ 61 8 9442 2200
You can also read