CONSUMER STIMULUS, UNEMPLOYMENT BENEFIT SPENDING & SHOPPING BEHAVIOR - COVID-19 Emerging Point of View - IRi
←
→
Page content transcription
If your browser does not render page correctly, please read the page content below
COVID-19 Emerging Point of View

CONSUMER STIMULUS,
UNEMPLOYMENT BENEFIT
SPENDING & SHOPPING BEHAVIOR
August 11, 2020

Executive Summary                      IMPACT OF SECOND STIMULUS CHECK
Congress is still debating a next      • 27% of those who received the first stimulus payment spent it on
                                         groceries and everyday household essentials. Consumers
round of stimulus, but President         report they will spend a second round of stimulus in the same way.
Trump signed executive orders on       • Categories most likely to benefit from stimulus dollars include
August 8 for $400 weekly                 meat and produce.
unemployment benefits, a payroll tax   • Mass, Grocery, Club and E-Commerce will benefit most from
cut, an eviction moratorium and          additional stimulus dollars.
student loan relief. The executive
order does not include a second
stimulus check of $1,200; although,    IMPACT OF REDUCED UNEMPLOYMENT BENEFITS
there is bipartisan support for this   • Shoppers anticipate fewer purchases of meat, fresh foods and
boost to the economy. In this report     snacks if unemployment benefits are reduced.
we explore results of IRI’s Consumer   • If unemployment benefits are reduced, shoppers report they will
Survey of primary shoppers,              spend less at most channels; only the Dollar channel nets out with
                                         no change in spending.
collected July 31 through August 2,
which show how consumer shopping
behavior and purchases will be         CONSUMER SENTIMENT AND SHOPPER BEHAVIOR
impacted.                              • Nearly 40% of respondents report feeling stressed; 49% of those
Please visit IRIworldwide.com to         unemployed are stressed.
review the report “The Impact of a     • 38% of consumers wish retailers could solve out-of-stock issues;
Second Round of Stimulus on the          more than a quarter want retailers to support local food banks.
CPG Demand Curve” for more             • Parents anticipate spending less on back-to-school purchases.
information.

                                                                                          © 2020 Information Resources Inc. (IRI). Confidential and Proprietary.   2
Household Received
       Nearly 9 in 10 HHs Received the First Stimulus                                                                                                     Prior Stimulus /
       Payment; ~1 in 4 Spent It on Groceries and                                                                                                          Relief Money
       Household Essentials, Which Is Also Expected
       for the Next Stimulus Check
                                                                                                               Use of Prior Payment
       Stimulus Money Usage                                                                                    Plans for Future Payment                          85%
              Add to my savings or investment                                                                                   35%
                         accounts                                                                                                           42%

              Rent, mortgage, taxes, or utilities                                                                                         41%
                                                                                                                                          41%
     Buy more groceries and other everyday                                                                       27%
             household essentials                                                                                27%

            Other home improvement projects                                       10%
                                                                                             16%
                                                                                                                                                            Among those
                                                                                                                                                           unemployed…
     Healthcare bills or buy healthcare items                                   9%

                                                                                                                                                              55%
                                                                                        13%
      Treat myself or my family to something                                 7%
         extra that I wouldn’t normally buy                                    9%
                                                                           6%
                                                                                                                                                         plan to use stimulus
          Furniture, appliances, or electronics                             7%                                                                               for housing

                                                                                                                                                              35%
                                                Clothing                 5%
                                                                           7%

                                           Other ways                                       16%
                                                                                           15%                                                             for groceries /
[q1] Did you or others in your HH receive money earlier this year as part of the gov’t. stimulus/economic relief plan? BASE: Total Respondents:
N=1417 [q2] How did you use the money you received earlier this year from the government stimulus/economic relief plan? [q3] If you received another
                                                                                                                                                        household essentials
similar amount of money from the gov’t. in the next 2 months, how would you be most likely to use it? BASE: Received Prior Stimulus Payment: N = 1167

                                                                                                                                                                        Source: IRI Survey of Primary Grocery Shoppers 7/31-8/2
                                                                                                                                                             © 2020 Information Resources Inc. (IRI). Confidential and Proprietary.   3
Top CPG Beneficiaries of the Next Stimulus Will                                                                                                          Those unemployed
       Be Meat, Produce; More Financially Strapped Will                                                                                                          are more likely to
       Also Rely on Stimulus for Everyday Essentials                                                                                                              use stimulus for

       Spend Impact on Groceries, Healthcare, Other HH Essentials
       Among the 85% Who Received Prior Stimulus Money
                                                                                                                                                                           13%
                                                                                                                                                                                OTC

                                                                                                                                                                           13%
           Buy more meat (chicken, turkey, beef, pork, etc.)                                        16%                Use of Prior
                                                                                                      21%              Payment
                             Buy more fresh fruits and vegetables                                   15%
                                                                                                      20%              Plans for Future                                           Rx
                                                                                            5%                         Payment
                  Go to restaurants or get take-out more often                               7%                                                                  The Downtrodden
                                                                                             6%
                  Buy more over-the-counter healthcare items                                 7%                                                                   segment will rely
                        Buy more beauty or personal care items                              5%                                                                       most on the
                                                                                             7%
                                                                                           3%
                                                                                                                                                                  stimulus for food
                                                  Fill more prescriptions                   5%                                                                     and healthcare
        Treat myself / my family to more premium products                                  3%
                                                                                            5%

                                                          Buy more snacks                   6%                                                                   Start-Ups are more
                                                                                            5%
   Buy more pre-packaged convenient meals rather than                                      4%
                                                                                                                                                                 likely than average
                  cooking from scratch                                                     4%                                                                    to use the stimulus
                                                                                                                                         70%
     No impact on my choices for these types of products
                                                                                                                                      62%
                                                                                                                                                                     for all these
[q2a] Did the money you received earlier this year from the government stimulus/economic relief plan impact your choices for groceries, healthcare, and
other household essentials? [q4] If you received another similar amount of money from the government in the next 2 months, how would it impact your
                                                                                                                                                                   everyday needs
choices for groceries, healthcare, and other household essentials? BASE: Received Prior Stimulus Payment: N = 1167

                                                                                                                                  Source: IRI Survey of Primary Grocery Shoppers 7/31-8/2 / EconoLink – See Appendix for EconoLink Definitions
                                                                                                                                                                           © 2020 Information Resources Inc. (IRI). Confidential and Proprietary.   4
Future Stimulus Payment Will Benefit Mass, Grocery,
Club, and E-Commerce Channels the Most
Mass and Grocery Had Biggest Gains Among Financially Strapped Downtrodden and Start-Ups                                                                                                      Spend More
Online-Only Retailers Saw Growth from Start-Ups                                                                                                                                              Spend Less
                 Spending Impact by Channel for Additional Stimulus Payment – NET DIFFERENCE
   +11%          +11%                   +8%                            +7%                             +3%                              -1%                             -1%                             -5%

   15%            14%                   14%
                                                                        11%
                                                                                                         8%
                                                                                                                                         4%                              3%                              3%
    4%             3%                                                    4%                              5%                              5%                              4%
                                         6%                                                                                                                                                              8%
  Mass                          Online-Only
 Merchant       Grocery          Retailer                              Club                          Dollar                           Drug                    Pet Specialty Convenience

                                   [q5] If you received another similar amount of money from the government in the next 2 months, how would it impact where you shop for groceries, healthcare, and other household essentials?
                          Note, retailer examples provided to respondent to describe channel. BASE Received Prior Stimulus Payment N = 1167. ‘About the same’ and ‘Do not shop this type of retailer’ answers not shown

                                                                                                                                               Source: IRI Survey of Primary Grocery Shoppers 7/31-8/2
                                                                                                                                    © 2020 Information Resources Inc. (IRI). Confidential and Proprietary.        5
Without Additional Unemployment Benefits,
       Fresh Foods and Snacks Will Be Most Impacted                                                                                           9%
       Impact on Shopping for Essentials if Extra $600 Weekly                                                                              of households
       Unemployment Benefit Is Reduced                                                                                                      are currently
                   Buy less meat (chicken, turkey, beef, pork, etc.)                                                                 35%      receiving
                                    Buy fewer fresh fruits and vegetables                                                        29%       unemployment
                                                                   Buy fewer snacks                                            27%            payments
                                                 Buy fewer premium products                                                 24%
                              Buy fewer beauty or personal care items                                                      23%

                                                                                                                                            88%
                     Buy fewer over-the-counter healthcare items                                                        20%
                  Switch more of my purchases to store brands vs.
                    Switch more of my purchases to  Store Brands…
                                                  national brands                                                      19%
                        Buy fewer
                   Buy fewer       pre-packaged
                              pre-packaged      convenient
                                            convenient     meals,
                                                       meals, and…                                                    18%
                                           cook more from scratch
                                        Rely more on food pantries                                                   17%
                                                                                                                                              of those
                          Go to restaurants or get take-out less often
                                                                                                                                            households
                                                                                                                     17%
                                                                                                                                           lost their jobs
                                                           Fill fewer prescriptions                              12%
            No impact
                                                                                                                                               due to
                   Noonimpact
                         my choices
                              on myfor these for
                                    choices   types of products
                                                 these types of…                                                                     34%
[q6] Do you or someone else in your household currently receive unemployment payments? BASE: Total Respondents: N=1417
                                                                                                                                             COVID-19
q7] If the extra $600 of unemployment payments were reduced next week, how would it impact your choices for groceries, healthcare,
and other household essentials? BASE:= Receiving Unemployment Payments: N = 127

                                                                                                                                                         Source: IRI Survey of Primary Grocery Shoppers 7/31-8/2
                                                                                                                                              © 2020 Information Resources Inc. (IRI). Confidential and Proprietary.   6
Shoppers Report They’ll Spend Less at Most Channels if Unemployment Benefits
Are Reduced; Only Dollar Channel Nets Out With No Change in Spending
Spending Impact by Channel if Extra $600 Weekly Unemployment Benefit Is Reduced                                                                                                                                        Spend More
                                                                                                                                                                                                                       Spend Less
                                                                                                   Net Difference
   -1%                        -13%                            -22%                           -23%                            -27%                           -31%                            -32%                             -35%

   15%
                                4%                              5%                             5%                              7%                             2%                               7%                              5%
   16%                         17%
                                                               27%                            28%
                                                                                                                              34%                            33%
                                                                                                                                                                                              39%                             40%

                                                                                                                         Mass                                                        Online-Only
  Dollar              Pet Specialty                           Club                   Convenience                        Merchant                            Drug                      Retailer                           Grocery

           [q8] If the extra $600 of unemployment payments were reduced next week, how would it impact where you shop for groceries, healthcare, and other household essentials? Note, retailer examples provided to respondent to describe channel.
                                                                                                               BASE:= Receiving Unemployment Payments: N = 127 ‘About the same’ and ‘Do not shop this type of retailer’ answers not shown

                                                                                                                                                                     Source: IRI Survey of Primary Grocery Shoppers 7/31-8/2
                                                                                                                                                          © 2020 Information Resources Inc. (IRI). Confidential and Proprietary.       7
Consumers Report Elevated Levels of
 Stress, Especially Among the Unemployed
 Half of Those Unemployed Are Feeling Stressed
                 Negative State of Mind
     Stressed                                                                                38%
   Exhausted                                                          30%
   Frustrated                                                         30%
      Worried                                                        29%
Overwhelmed                                         23%
Disappointed                              16%
    Confused                    8%
Out of Control             6%

                 Positive State of Mind
     Grateful                                                                           34%
   In Control                                           23%
     Content                                  19%
   Optimistic                                18%
    Focused                                 17%
   Confident                                17%
   Energized                     9%
     Inspired                   8%              [A1] How have you been feeling during the past few days?
                                                                    BASE: Total Respondents: N = 1417

                                                                                                                Source: IRI Survey of Primary Grocery Shoppers 7/31-8/2
                                                                                                     © 2020 Information Resources Inc. (IRI). Confidential and Proprietary.   8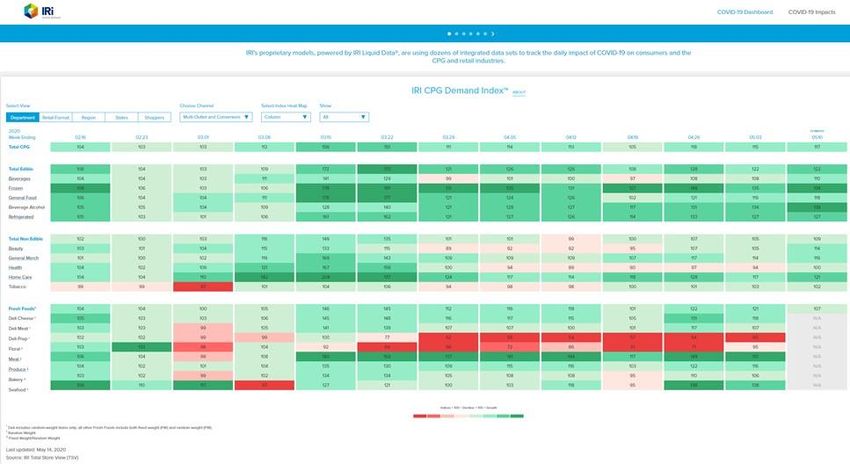
Top Priority for Retailers Looking to Support
Shoppers Is Reducing Out-of-Stocks
Help Desired From Retailers or Manufacturers

    Increase product production on HH /                                                                   38%
 cleaning supplies to avoid out-of-stocks
   Increase product production on food /                                                       31%
        beverages to avoid out-of-stocks
           Support communities through                                                 26%
                        donations of food
        Show me ways to stretch / more                                            23%
         economically use their products
           Show me new / different ways                                     19%
                    to use their products
   Provide meal ideas for their products                                  18%
              Make their products more                                    18%
                environmentally friendly
                 Provide a better online                               16%
                  shopping experience
           Provide fun ways for me and                        10%
           my kids to use their products
    Inform me on food safety measures                       9%
      and how to prevent contamination
                                       [A3] What are some things that retailers or manufacturers could do to help you?
                                                                                   BASE: Total Respondents: N = 1417

                                                                                                                              Source: IRI Survey of Primary Grocery Shoppers 7/31-8/2
                                                                                                                   © 2020 Information Resources Inc. (IRI). Confidential and Proprietary.   9
Half of Parents Expect Their Child(ren) Aged
6-12 to Be Remote-Learning in the Fall;
Another 15% Expect Hybrid; Teens Are
Slightly More Likely to Attend School
Back-to-School Plans

                    Online Only                                                                         42%
                     / At Home                            50%

                 At the School                                                                          24%
                                                          19%

       Some Days Online,
     Some Days at School                                  15%                                           19%
One of My Children Will Go                                 1%
 to School, Another Online                                                                               2%
                                                          15%                                           13%
           Don’t Know Yet

                                                 Kids Age 6-12                              Teens Age 13-17
        Based on what you know today about school plans in your area, what are you most likely to do for school this fall for your child:

                Source: IRI Survey fielded 7/24-26 among National Consumer Panel representing Total US Primary Grocery Shoppers
                                                                   © 2020 Information Resources Inc. (IRI). Confidential and Proprietary.   10
Spending for Back-to-School Is Expected to Expected Spending
Be Lower Than Last Fall, with Increases on to Prepare for
School Compared
Sanitizing and Activity Materials, Offset by Lower to Last Year
Expenses on Clothing and Sports Gear
Changes to Back-to-School Shopping Compared to Last Year
Buy fewer clothes for school
39%
Buy child
because fewerwill
clothes
not beforatschool
schoolbecause…
as often 39% Will likely
Buy more sanitizing products for spend less this
Buy more
schoolsanitizing products
(wipes, hand for school…
sanitizer, etc.) 31% year than I did
Buying more educational workbooks or other last year
Buyingtools
educational moreforeducational
my child toworkbooks
use at home or… 27%
Buying more craft supplies for my
Buying more
childcraft
to dosupplies for myat
craft projects child
I received a list of needed school supplies last
to…
home 19%
37%
I received
year, but I didn't a list
get a list thisofyear
needed
from school…
school 17% Will likely spend
Need to buy more new devices about the same
Need to buythismore new
year devices
(i.e., laptopthis year…
/ tablet) 15% this year than I
Buy new furniture for my child to use for did last year
Buy new furniture forat
schooling myhome
child(i.e.,
to use for…
desk) 13%
Buy less sports gear 12% 24%
Will likely spend
I bought new devices (i.e., laptop/tablet) last more this year
I bought
year, and new devices
don't need (i.e.devices
to buy new laptop/tablet)…
for fall 12% than I did last year
Similar to last year 24%
Similar results across
Will your shopping related to school be different this fall compared to last year? (Multiple change answers accepted) income groups
Thinking about your shopping plans related to school, how much do you plan to spend to prepare your child/children for school this fall compared to last year?
Source: IRI Survey fielded 7/24-26 among National Consumer Panel representing Total US Primary Grocery Shoppers
© 2020 Information Resources Inc. (IRI). Confidential and Proprietary. 11Americans Turn to TV / Movies to Bring Joy Into
Their Day or De-Stress, Reinforcing This as a
Key Vehicle to Communicate with Consumers
Activities During Past Week to Bring Joy or De-Stress
Watching TV / movies 63%
Getting outside (for a walk, hike, etc.) 44%
Reading books / magazines 33%
Spending time online or on social media apps 31%
Connecting with
Connecting with friends
friends // family
family on
on the
the phone…
phone 30%
or video chat
Gardening / yardwork 27%
Baking or cooking from scratch 25%
Getting together with friends
Getting together with friends // family
family who
don't live withwho…
me 20%
Enjoying beer / wine / liquor / cocktails 20%
Enjoying more treats 16%
Craft projects 14%
Fun family activities (game night, etc.) 14%
Meditation 10%
[A2] What are some things you’ve been doing during the past week to bring some joy into your day or de-stress?
BASE: Total Respondents: N = 1417 Responses 10%+ are shown
Source: IRI Survey of Primary Grocery Shoppers 7/31-8/2
© 2020 Information Resources Inc. (IRI). Confidential and Proprietary. 12Insights and Strategic
Guidance for Better Decisions
IRI’s Online Resources Include Real-Time
Updates and Weekly Reports That Track
the Impact of the Virus on CPG and Retail
The IRI COVID-19 lmpact
Includes COVID-19 impact analyses, dashboards
and the latest thought leadership on supply chain,
consumer behavior and channel shifts for the U.S.
AND international markets.
IRI CPG Economic Indicators, Including
the IRI CPG Demand Index™, IRI CPG
Supply Index™ and IRI CPG Inflation
Tracker™
Accessible through the insights portal
to track the daily impact of COVID-19.
This includes top-selling and out-of-stock
categories across the country and
consumer sentiment on social media.
© 2020 Information Resources Inc. (IRI). Confidential and Proprietary. 13NOW INCLUDES
IRI CPG Demand Index™
U.S., UK, FRANCE, ITALY,
GERMANY & NETHERLANDS
The IRI CPG Demand Index™ provides a
standard metric for tracking changes in spending
on consumer packaged goods. It measures
weekly changes in consumer purchases, by
dollar sales, against the year-ago period across
departments, including fixed and random weight
products, grocery aisles and retail formats. The
IRI CPG Demand Index™ is available for eight
U.S. regions, all U.S. states, UK, France, Italy,
Germany and the Netherlands.
CLICK HERE FOR MORE!
© 2020 Information Resources Inc. (IRI). Confidential and Proprietary. 14The Latest COVID-19 Reports and Insights from IRI (click to see full report)
IRI COVID-19 IMPACT THE CHANGING SHAPE
ASSESSMENT REPORTS OF THE CPG DEMAND CURVE RECESSION PROOF YOUR BUSINESS
© 2020 Information Resources Inc. (IRI). Confidential and Proprietary. 15IRI Global Headquarters
CONTACT US 150 North Clinton Street
Chicago, IL 60661-1416
FOR MORE IRI@IRIworldwide.com
+1 312.726.1221
INFORMATION Follow IRI on Twitter: @IRIworldwide
© 2020 Information Resources Inc. (IRI).
© 2020 Information Resources Inc. (IRI). Confidential
Confidential and
and Proprietary.
Proprietary. 16 16Appendix
© 2020 Information Resources Inc. (IRI). Confidential and Proprietary. 17EconoLink Provides View of Americans’ Response to COVID-19 Through a
Human Economic Lens That Goes Beyond Income; Not All Respond Alike
SAVVY SHOPPERS DOWNTRODDEN
Their financial situations are improving vs. YAG, but Their financial situations are markedly worse vs. YAG,
they still look for value – although that doesn’t always and their go-to response is depravation; they try to cut
mean the lowest price. They love to find coupons and back on everything. Purchases highly influenced by
good deals on groceries. price, brand, and/or prior experience/trust.
Savvy Down-
SKEWS: Younger Baby Boomers, Retirees | Mean Shoppers trodden SKEWS: Older Millennials/Younger Boomers | Blue
HHI $75,600 Collar | Hispanic | Lower Income
8% 9%
CAREFREE Carefree
Their financial situations are in a stable place; no 18% CAUTIOUS & WORRIED
real financial concerns. They’re willing to splurge on Their financial situations are markedly worse vs.
premium products, and brand preference is a greater YAG, and they do not hold out a lot of hope for things
Cautious &
driver than price for their buying decisions. to get better.
Worried
SKEWS: Older Boomers & Retirees | Male | Live 32% SKEWS: Baby Boomers | Live Alone
Alone | Upper Income
Optimistics
OPTIMISTICS 21% START-UPS
Their financial situations are better vs. YAG, and they Their financial situations are largely the same as
are optimistic about their financial future. Price is on Start-Ups YAG, but they’re still struggling. They, too, are
their radar, but so are product experiences and brand 12% focused on cutting back, but with positive
trust. expectations for future improvement in their financial
situations.
SKEWS: Gen Z, Millennials and Gen X | 4+ Member
HHs | African American | Mean HHI $72,000 SKEWS: Gen Z/Millennials | African American,
Asian | Blue Collar | Lower Income
IRI EconoLink, IRI Survey fielded 3/20-3/22, 2020, among IRI Consumer Network™ Panel representing Total U.S. Primary Grocery Shoppers
© 2020 Information Resources Inc. (IRI). Confidential and Proprietary. 18You can also read