Cover Presentation on Far East Hospitality Trust - January 2021
←
→
Page content transcription
If your browser does not render page correctly, please read the page content below
Cover

        Presentation on Far East
        Hospitality Trust
        January 2021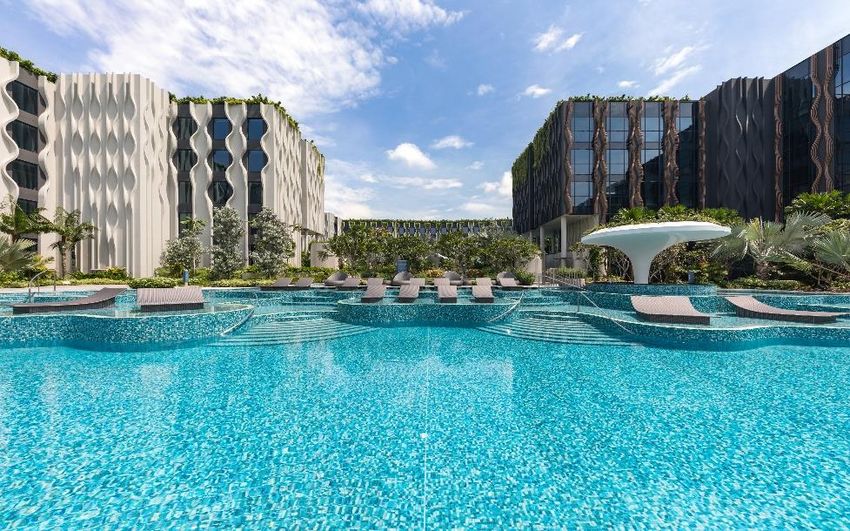
Important Notice
 Information contained in this presentation is intended solely for your personal reference and is strictly confidential. The information and opinions in this presentation are subject to change without notice,
 its accuracy is not guaranteed and it may not contain all material information concerning Far East Hospitality Trust (the “Trust”), a stapled group comprising Far East Hospitality Real Estate Investment
 Trust and Far East Hospitality Business Trust. Neither FEO Hospitality Asset Management Pte. Ltd. (the “Manager”), FEO Hospitality Trust Management Pte. Ltd. (the “Trustee-Manager”, and together
 with the Manager, the “Managers”), the Trust nor any of their respective affiliates, advisors and representatives make any representation regarding, and assumes no responsibility or liability whatsoever
 (in negligence or otherwise) for, the accuracy or completeness of, or any errors or omissions in, any information contained herein nor for any loss howsoever arising from any use of these materials. By
 attending or viewing all or part of this presentation, you are agreeing to maintain confidentiality regarding the information disclosed in this presentation and to be bound by the restrictions set out below.
 Any failure to comply with these restrictions may constitute a violation of applicable securities laws.

 The information contained in these materials has not been independently verified. No representation or warranty, expressed or implied, is made as to, and no reliance should be placed on, the fairness,
 accuracy, completeness or correctness of, the information or opinions contained herein. None of the Trust, the Managers, DBS Trustee Limited (as trustee of Far East Hospitality Real Estate
 Investment Trust), Far East Organization, controlling persons or affiliates, nor any of their respective directors, officers, partners, employees, agents, advisers or representatives shall have any liability
 whatsoever (in negligence or otherwise) for any loss howsoever arising, whether directly or indirectly, from any use, reliance or distribution of this presentation or its contents or otherwise arising in
 connection with this presentation. It is not the intention to provide, and you may not rely on these materials as providing a complete or comprehensive analysis of the Trust's financial or trading position
 or prospects. The information and opinions contained in these materials are provided as at the date of this presentation and are subject to change without notice. Nothing contained herein or therein is,
 or shall be relied upon as, a promise or representation, whether as to the past or the future and no reliance, in whole or in part, should be placed on the fairness, accuracy, completeness or correctness
 of the information contained herein. Further, nothing in this document should be construed as constituting legal, business, tax or financial advice. None of the Joint Bookrunners or their subsidiaries or
 affiliates has independently verified, approved or endorsed the material herein.

 Nothing in this presentation constitutes an offer of securities for sale in Singapore, United States or any other jurisdiction where it is unlawful to do so.

 The information in this presentation may not be forwarded or distributed to any other person and may not be reproduced in any manner whatsoever. Any forwarding, distribution or reproduction of this
 information in whole or in part is unauthorised. Failure to comply with this directive may result in a violation of the Securities Act or the applicable laws of other jurisdictions.

 This presentation contains forward-looking statements that may be identified by their use of words like “plans,” “expects,” “will,” “anticipates,” “believes,” “intends,” “depends,” “projects,” “estimates” or
 other words of similar meaning and that involve assumptions, risks and uncertainties. All statements that address expectations or projections about the future and all statements other than statements
 of historical facts included in this presentation, including, but not limited to, statements about the strategy for growth, product development, market position, expenditures, and financial results, are
 forward-looking statements. Such forward-looking statements are based on certain assumptions and expectations of future events regarding the Trust's present and future business strategies and the
 environment in which the Trust will operate, and must be read together with those assumptions. The Managers do not guarantee that these assumptions and expectations are accurate or will be
 realized. Actual future performance, outcomes and results may differ materially from those expressed in forward-looking statements as a result of a number of risks, uncertainties and assumptions.
 Although the Managers believe that such forward-looking statements are based on reasonable assumptions, it can give no assurance that such expectations will be met. Representative examples of
 these risks, uncertainties and assumptions include (without limitation) general industry and economic conditions, interest rate trends, cost of capital and capital availability, competition from other
 companies, shifts in customer demands, customers and partners, changes in operating expenses including employee wages, benefits and training, governmental and public policy changes and the
 continued availability of financing in the amounts and the terms necessary to support future business. Predictions, projections or forecasts of the economy or economic trends of the markets are not
 necessarily indicative of the future or likely performance of the Trust. Past performance is not necessarily indicative of future performance. The forecast financial performance of the Trust is not
 guaranteed. You are cautioned not to place undue reliance on these forward-looking statements, which are based on the Managers’ current view of future events. The Managers do not assume any
 responsibility to amend, modify or revise any forward-looking statements, on the basis of any subsequent developments, information or events, or otherwise.

 This presentation is for information purposes only and does not constitute or form part of an offer, solicitation or invitation of any offer, to buy or subscribe for any securities, nor should it or any part of it
 form the basis of, or be relied in any connection with, any contract or commitment whatsoever. Any decision to invest in any securities issued by the Trust or its affiliates should be made solely on the
 basis of information contained in the prospectus to be registered with the Monetary Authority of Singapore (the “MAS”) after seeking appropriate professional advice, and you should not rely on any
 information other than that contained in the prospectus to be registered with the MAS.

 These materials may not be taken or transmitted into the United States, Canada or Japan and are not for distribution, directly or indirectly, in or into the United States, Canada or Japan.

 These materials are not an offer of securities for sale into the United States, Canada or Japan. The securities have not been and will not be registered under the Securities Act and, subject to certain
 exceptions, may not be offered or sold within the United States. The securities are being offered and sold outside of the United States in reliance on Regulation S under the United States Securities Act
 of 1933, as amended. There will be no public offer of securities in the United States and the Managers do not intend to register any part of the proposed offering in the United States.

 This presentation has not been and will not be registered as a prospectus with the MAS under the Securities and Futures Act, Chapter 289 of Singapore and accordingly, this document may not be
 distributed, either directly or indirectly, to the public or any member of the public in Singapore.
                                                                                                                                                                                                                         2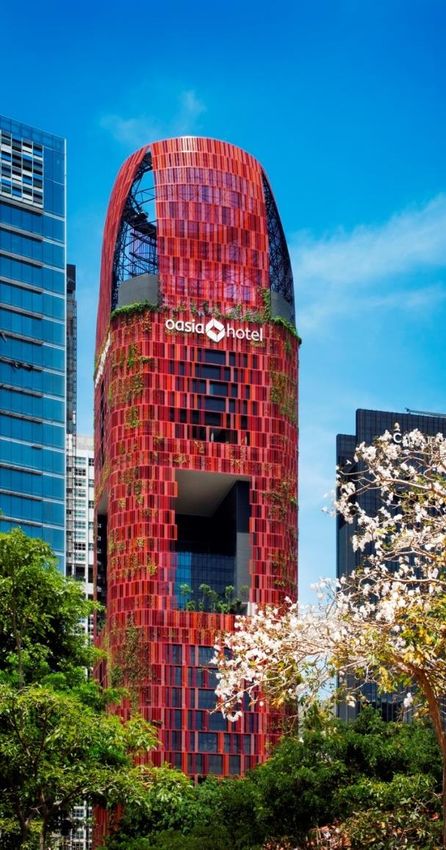
Contents

 ▪ Overview of Far East Hospitality Trust

 ▪ Financial Highlights

 ▪ Portfolio Performance

 ▪ Sustainable Growth Strategy

 ▪ Industry Outlook & Prospects

                                            3
Overview of Far East Hospitality Trust

Overview of Far East H-Trust

                                                                                      Public                              Far East
  Issuer                Far East Hospitality Trust
                                                                                          39%                                   61%

  Sponsor               Far East Organization group of companies
                                                                                                        Far East
                                                                                                        H-Trust
                                                                                                                                 Business
  REIT Manager          FEO Hospitality Asset Management Pte. Ltd.        REIT                                                     Trust2

                                                                            REIT             Far East          Far East       Trustee-
                        13 properties valued at approximately              Manager            H-REIT            H-BT          Manager
                        S$2.65 billion1
  Portfolio
                        9 hotel properties (“Hotels”) and 4 serviced
                        residences (“SR” or “Serviced Residences”)                                                    REIT
                                                                                      Hotel          SR
                                                                                                                   Commercial
                                                                                     Portfolio     Portfolio
  Hotel and SR                                                                                                      Premises
                        Far East Hospitality Management (S) Pte Ltd
  Operator

  Retail & Office                                                                       Master Lessees
  Space Property        Jones Lang LaSalle Property Consultants Pte Ltd
  Manager

                        Sponsor companies, part of the Far East                        Hotel & Serviced        Retail & Office
  Master Lessees                                                                         Residence             Space Property
                        Organization group of companies
                                                                                          Operator                Manager

  (1) As at 31 December 2019
  (2) Dormant at Listing Date and master lessee of last resort
                                                                                                                                            5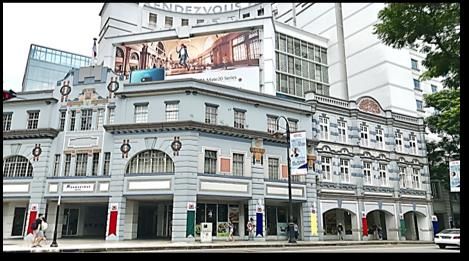
Overview of the Properties
    Oasia Hotel Novena                    Orchard Rendezvous                    Rendezvous Hotel                The Elizabeth Hotel                 The Quincy Hotel          Village Hotel Albert Court
1                                   2                                  3                                  4                                    5                          6
       (428 rooms)                         Hotel (388 rooms)                  Singapore (298 rooms)                (256 rooms)                        (108 rooms)                    (210 rooms)

                                                                                                                                                                                 Village Hotel Bugis
                                                                                                                                                                          7          (393 rooms)
                                         1                                                                                •      13 Properties,
                                 Novena Medical Hub
                                                  Civic and Cultural
                                                                                                                                 totalling 3,143 hotel
             2         4
                                                        District                                                                 rooms and apartment
                           5
                                                       6
                                                                                                                                 units, valued at
                                                              7
                                    10                                                                                           ~S$2.65 bn¹
                                                  3
                                  13                                                                                      •      11 are in the central                    8
                                                                                                                                                                                Village Hotel Changi
                                                                                                                                                                                     (380 rooms)
                                         11   9                                                                                  part of Singapore –
                                                                                             Hotels                              Orchard, Novena,
                                                                                             Serviced Residences                 Bugis, and in/around
                                                                                             Key Areas of Interest
                                                               Marina Bay                    Medical Facility                    the CBD
                                                              Cruise Centre                  MICE Facility

              13 Village Residence Robertson                       Village Residence                       Village Residence                                                   Oasia Hotel Downtown
                                                            12                                    11                                        10 Regency House (90 units)   9
                               Quay (72 units)                     Hougang (78 units)                   Clarke Quay (128 units)                                                     (314 rooms)

                                                                                                                                                                                                           6
      Note: The independent valuations of the properties were carried out by Savills and Knight Frank, figures are as at 31 December 2019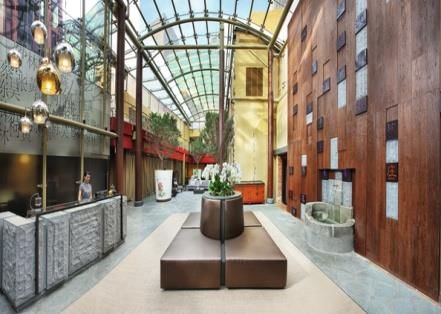
Master Lease Structure and Contribution

                Master Lease Structure                                        Breakdown of Revenue (FY2019)

                       ▪ 20 years with the option to renew for an
 Tenure
                         additional 20 years
                                                                                       19%      Rental Revenue for
                                                                                                Commercial premises
                       ▪ Fixed Rent = Total of S$67 million per
                         annum (S$57 million for Hotels, S$10
                         million for Serviced Residences)
 Composition of                                                                        23%
 Master Lease                                                                                   Variable Rent for Hotels
                       ▪ Variable Rent = (33% x        GOR1)    +   (30%3
 Rental                                                                                         & Serviced Residences
                         x GOP2) - Fixed Rent

                       ▪ Downside protection with upside potential

 Furniture,
 fixtures and                                                                                   Fixed Rent for Hotels &
                       ▪ 2.5% of GOR                                                            Serviced Residences
 equipment
 reserve
                                                                                       58%

                       ▪ Sponsor companies, part of the Far East
 Master Lessees
                         Organization group of companies

 (1)   GOR refers to the Gross Operating Revenue of the Property.
 (2)   GOP refers to the Gross Operating Profit of the Property.
 (3)   Average for the whole portfolio; actual percentage for each property
       ranges from 23% to 37% for Hotels, and 38% to 41% for Serviced
       Residences.
                                                                                                                           7
Financial Highlights

Executive Summary for 3Q 2020 – Performance vs LY

                                                      3Q 2020                     3Q 2019                  Variance
                                                       S$’000                     S$’000                       %

   Gross Revenue                                       20,621                      30,875                    (33.2)

            Hotels                                     14,250                      21,543                    (33.8)

            Serviced Residences (“SR”)                 2,929                       3,787                     (22.7)

            Commercial Premises                        3,442                       5,545                     (37.9)

   Net Property Income                                 17,851                      28,058                    (36.4)

   ▪   Gross Revenue for 3Q 2020 was S$20.6 million, 33.2% lower year-on-year, mainly due to a decline in master lease
       rental for the hotels and serviced residences arising from the impact of the COVID-19 outbreak. While the master
       lease rental for the hotel segment was at the fixed rent level, the SR segment continued to perform above the fixed
       rent.

   ▪   Revenue from the Commercial Premises was 37.9% lower year-on-year due to rental rebates given during the
       quarter.

   ▪   Accordingly, Net Property Income was 36.4% lower year-on-year.

                                                                                                                             9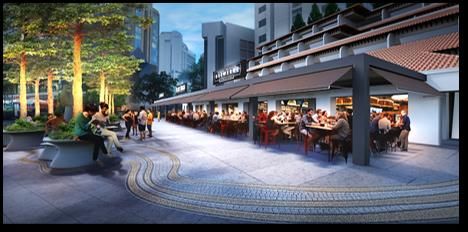
Executive Summary for YTD Sep 2020 – Performance vs LY

                                                   YTD Sep 2020                 YTD Sep 2019                 Variance
                                                       S$’000                       S$’000                      %

   Gross Revenue                                        64,891                      86,600                    (25.1)

            Hotels                                     42,750                       59,905                    (28.6)

            Serviced Residences                         9,118                       10,199                    (10.6)

            Commercial Premises                        13,023                       16,496                    (21.1)

   Net Property Income                                 56,455                       78,244                    (27.8)

            Finance Expenses                           (18,533)                    (22,463)                    17.5

            REIT Manager’s fees                        (7,167)                      (9,177)                    21.9

   Income Available for Distribution                   37,706                       55,362                    (31.9)

   ▪   Gross Revenue for YTD Sep 2020 was S$64.9 million, 25.1% lower year-on-year, mainly due to a decline in master
       lease rental for the hotels arising from the impact of the COVID-19 outbreak. The performance of Commercial
       Premises weakened due to rental rebates given. Net Property Income was 27.8% lower year-on-year.

   ▪   Finance Expenses were 17.5% lower, mainly due to net repayment of short-term loans and lower interest rates.
       Income Available for Distribution was S$37.7 million. The fixed rent received was more than sufficient to cover the
       interest costs incurred.

   ▪   The REIT Manager’s fees were lower by 21.9% due to the revision of formula used to calculate such fees.               10
Balance Sheet Summary
As at 30 Sep 2020 As at 31 Dec 2019
S$’ million S$’ million
Total Assets 2,699.4 2,699.5
Comprising:
Investment Properties 2,647.2 2,645.7
Joint Venture 4.7 8.0
Cash and Cash Equivalents 6.9 5.8
Trade and other receivables1 40.6 40.0
Total Liabilities 1,031.5 1,018.3
Net Assets 1,667.9 1,681.2
NAV per Stapled Security (S$) 0.85 0.86
(1) This includes a shareholders’ loan and accrued interest due from Fontaine Investment Pte Ltd of S$30.5 million.
11Capital Management
As at 30 Sep 2020 Debt Maturity Profile (figures in S$million)
225 225
Total Debt S$1,001.2m 210
161 157
Available revolving facility S$276.7m
Aggregate Leverage 39.5%
23
Unencumbered asset 2020 2021 2022 2023 2024 2025
100%
as % total asset
Interest Rate Profile
Proportion of fixed rate 59.6%
Floating
S$404.0m
Weighted average debt Fixed
2.5 years 40.4%
maturity S$597.2m
59.6%
Average cost of debt 2.4%
Interest Coverage Ratio1 2.6x • The REIT Manager is working with its lenders to assess refinancing
options for the term loans due in 2021.
1Interest coverage ratio is calculated by dividing the trailing 12 months earnings before interest, tax, depreciation and amortisation (excluding effects of any fair value changes of derivatives
and investment properties, and foreign exchange translation), by the trailing 12 months interest expense and borrowing-related fees per the formula prescribed by paragraph 1.2(f), Appendix 6
of the Code on Collective Investment Schemes. 12Portfolio Performance
Portfolio Performance 3Q 2020 – Hotels
                Average Occupancy                      Average Daily Rate (ADR)                   Revenue Per Available Room
  %                                             $                                             $           (RevPAR)
                       +5.0pp   97.3
                92.3                       200.0                                        200
100.0
                                                          164
                                                                                                      152
 80.0                                      160.0                    -58.1%              160
                                                                                                                 -55.8%
 60.0                                      120.0                                        120

                                                                             69                                        67
 40.0                                       80.0                                         80

 20.0                                       40.0                                         40

  0.0                                        0.0                                          0
            3Q 2019        3Q 2020                    3Q 2019         3Q 2020                     3Q 2019        3Q 2020

        ▪   Occupancy improved 5.0pp year-on-year to 97.3% as the hotels were able to secure contracts from companies that
            required their workers to stay in Singapore because of the Malaysian Control Order (“MCO”) as well as from the
            Government for isolation purposes.

        ▪   The average daily rate (“ADR”) was 58.1% lower year-on-year at $69, reflecting the lower ADRs associated with MCO-
            related accounts and Government contracts.

        ▪   Consequently, revenue per available room (“RevPAR”) declined by 55.8% year-on-year to $67.

                                                                                                                                 14
Portfolio Performance YTD Sep 2020 – Hotels
Average Occupancy Average Daily Rate (ADR) Revenue Per Available Room
% $ $ (RevPAR)
100.0 89.9 200
-5.7pp 84.2 200
159
80.0 160 -44.0% 160 143
-47.5%
60.0 120 120
89
75
40.0 80 80
20.0 40 40
0.0 0 0
YTD Sep 2019 YTD Sep 2020 YTD Sep 2019 YTD Sep 2020 YTD Sep 2019 YTD Sep 2020
• Average occupancy of the hotels suffered in the initial phase of the COVID-19 pandemic but picked up in subsequent
months as the hotels secured business from companies because of the MCO and from the Government for isolation
purposes. Average occupancy of 84.2% for YTD Sep 2020 was 5.7pp below the same period last year.
• ADR decreased 44.0% to $89 as travel restrictions curtailed higher rated business for the hotels.
• Accordingly, RevPAR declined by 47.5% to $75.
15Portfolio Performance 3Q 2020 – Serviced Residences
Average Occupancy Average Daily Rate (ADR) Revenue Per Available Unit
(RevPAU)
% $ $
100.0 88.2 -1.1pp 87.1 222
240 240
-19.0%
196
80.0 200 180 200 -20.1%
157
160 160
60.0
120 120
40.0
80 80
20.0
40 40
0.0 0 0
3Q 2019 3Q 2020 3Q 2019 3Q 2020 3Q 2019 3Q 2020
• The serviced residences (“SRs”) demonstrated greater resilience despite the challenging market circumstances and lack
of inbound travel. The support from long-stay corporate sources helped to mitigate the negative impact of the pandemic
and kept the SRs performing above fixed rent.
• The average occupancy for SRs declined slightly to 87.1% (-1.1pp year-on-year). ADR fell by 19.0% to $180 due to the
curtailment of higher-rated short-stay business. As a result, revenue per available unit (‘RevPAU’) was 20.1% lower at
$157.
16Portfolio Performance YTD Sep 2020 – Serviced Residences
Average Occupancy Average Daily Rate (ADR) Revenue Per Available Unit
(RevPAU)
% $ $
100.0
83.5 0.7pp 84.2 240 217 240
-11.1%
193 -10.3%
80.0 200 200 181
163
160 160
60.0
120 120
40.0
80 80
20.0
40 40
0.0 0 0
YTD Sep 2019 YTD Sep 2020 YTD Sep 2019 YTD Sep 2020 YTD Sep 2019 YTD Sep 2020
• The average occupancy for the SRs for YTD Sep 2020 improved 0.7pp year-on-year to 84.2% due to a good base of
corporate accounts.
• The ADR fell 11.1% year-on-year to $193 due to some pre-terminations and inflow of business at more competitive rates.
Consequently, RevPAU registered a 10.3% year-on-year decline to $163.
17Breakdown of Gross Revenue – Total Portfolio
YTD Sep YTD Sep
2019 Serviced 2020
Serviced
Residences Residences
11.8% 14.0%
69.2% 65.9%
19.0% 20.1%
Hotels
Commercial Hotels Commercial
18Market Segmentation YTD Sep 2020 – Hotels
Hotels (by Revenue) Hotels (by Region)
3.3%
1.7%
Leisure/ 11.2%
Independent
5.4% SE Asia
36.6%
S Asia
N Asia
49.8%
Oceania
12.9%
Others
Corporate
63.4% Europe
N America
15.7%
• The Corporate segment contributed 63.4% to the overall hotel revenue. This was mainly from the Government
contracts and MCO-related businesses. Border closures continued to limit Leisure travel bookings.
• The proportion of revenue contribution from South East Asia increased significantly as the proportions from other
regions such as North Asia decreased, brought about by increased travel restrictions.
19Market Segmentation YTD Sep 2020 – Serviced Residences
Serviced Residences (by Revenue) Serviced Residences (by Industry)
Leisure/
Independent Banking &
18.6% Finance,
18.7%
Others,
32.1%
Electronics &
Manufacturing,
14.5%
Logistics, Oil & Gas, FMCG,
2.3% 7.7% 7.8%
Corporate Services,
81.4% 16.9%
• Revenue contribution by the Corporate segment was 81.4% for YTD Sep 2020, supported by pre-existing long leases
and lease extensions by corporate accounts. Contribution by the Leisure segment was lower at 18.6% due to general
restrictions on cross-border travel.
• The Banking & Finance and Electronics & Manufacturing industries represented the biggest industry contributors to
revenue for YTD Sep 2020.
20Sustainable Growth Strategy
Sustainable Growth Strategy

                                     •       Implementing refurbishment
 •   Optimizing the performance of
                                             programmes to refresh and
     hospitality assets
                                             upgrade the properties
 •   Growing contribution from
                                     •       Optimizing plant and
     commercial spaces
                                             equipment for greater energy
                                             efficiency and cost savings

                                         •   Ongoing review of costs to
 •   Acquiring completed                     enhance stapled
     Sponsor ROFR properties                 securityholders’ returns

 •   Seeking suitable 3rd party          •   Enacting strong corporate
     acquisitions                            governance policies and
                                             procedures

                                                                            22
Optimizing Organic Performance
Covid-19 Guest Handling Procedures
• All hotels have been certified under the SG Clean Scheme
• Flexible reservation and cancellation policies
• Increased frequency of deep cleaning with hospital-grade solutions
• Temperature screening, SafeEntry check-ins and social distancing for all guests
Cost Containment at the Properties
• Hiring freeze across all departments, reduction of overtime and freeze on casual labour
• Reduction in outsourced public area cleaning by moving such functions in-house
• Temporary discontinuation of ancillary third-party contracts
• 35% reduction in total hotel expenditure
23Executing Asset Enhancement Initiatives
a) Renovation of The Elizabeth Hotel
• Renovation of the lobby, reception, lift lobbies, function rooms and all-day dining
outlet
• Renovation of 156 Superior & Deluxe rooms and 100 Premier rooms
b) Upgrading outdoor refreshment area at Orchard Rendezvous Hotel
• New canopy system
• Upgrading the floor and wall finishes
• Enhancement of landscaped area at the forecourt
c) Repainting of Rendezvous Hotel Singapore
• New colours with highlights for decorative corbels
24Aligning Interests with Stapled Securityholders
Change Illustration on FY2019 fee
Base fee is reduced from 0.3% to 0.28% per annum of the Reduction would have been
value of the deposited property of Far East H-REIT. approximately S$0.54 million or 6.7%
Performance fee is reduced from 4.0% of the net property
income to 4.0% of the net property income or 4.0% of the Reduction would have been
annual distributable amount for that financial year, whichever is approximately S$1.2 million or 28.8%
lower.
▪ For illustrative purposes, the overall Management Fees for FY2019 would have been lower by S$1.74 million or 14.2%
based on the above changes.
▪ This reduction took effect from 1 January 2020.
25Aligning Interests with Stapled Securityholders
Singapore Governance and Transparency Index 2020 Governance Index for Trusts 2020
▪ In August 2020, FEHT was ranked 4 out of 45 REITs and Business Trusts, on the Singapore Governance and Transparency
Index (“SGTI”), improving on its 6th position from 2019.
▪ In October 2020, FEHT was ranked 7 out of 45 REITs and Business Trusts, on the Governance Index for Trusts (“GIFT”),
maintaining its top 10 positioning from 2019. FEHT received the 3rd highest Governance Risk score.
26Growing the Portfolio – Acquisition of Oasia Hotel Downtown (2018)
▪ 314-room upscale hotel located at
100 Peck Seah Street, in the Tanjong
Pagar area of Singapore’s CBD
▪ Purchase price of S$210.0 million1 or
S$668,789 per key
▪ Valued at S$245.0 million as at 31
Infinity Pool December 2019
▪ 65 year-lease commencing from
completion date of 2 April 20182
▪ Vendor and master lessee is Far East
SOHO Pte. Ltd.
Oasia Hotel Downtown Deluxe room
1 The
Vendor and the REIT Trustee had entered into an Earn-out Agreement, in which the REIT Trustee will issue S$15.0 million worth of Stapled Securities to the Vendor if, by 31 December 2023 (or up to 31
December 2025 if there are any Extension Events as defined in the Earn-out Agreement), the net property income (“NPI”) of the Property is at least S$9.9 million per annum for two full consecutive years.
2 The Vendor owns a leasehold interest of 99 years commencing from 13 April 2011. As the leasehold tenure in the Property to be acquired by the REIT Trustee is in respect of a shorter leasehold period than the 27
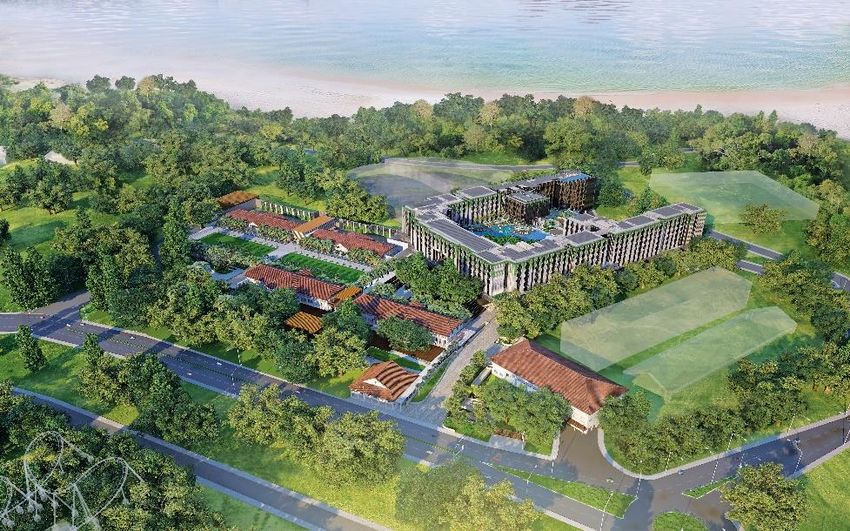
length of the leasehold title held by the Vendor, upon expiry of the leasehold tenure held by the REIT Trustee, the title to the Property will revert back to the Vendor.Growing the Portfolio – Hotel Development on Sentosa with Sponsor
▪ In September 2014, Far East H-REIT took up a 30% stake in a joint venture with Far East Organization
Centre Pte. Ltd. (a member of Far East Organization)
▪ Integrated development comprising 3 hotels and 839 rooms – Village Hotel Sentosa, The Outpost Hotel and
The Barracks Hotel
▪ 60-year leasehold interest from 7 March 2014
▪ Far East H-REIT’s agreed proportion of investment is approx S$133.1 million (of a total estimated cost of
S$443.8 million)
▪ Far East H-REIT is entitled to purchase remaining 70% of the development should a sale be contemplated by
the Sponsor
28Growing the Portfolio – Potential Pipeline Projects from the Sponsor
Village Hotel, The Outpost Hotel and The
1 Oasia West Residences 2 AMOY Hotel 3 The Clan1 4 Barracks Hotel1
Number of Units: 140 Number of Units: 37 Number of Units: 324 Number of Rooms: 839
Est. No of
Name of Pipeline Property Rooms / Units
Serviced Residences
1 Oasia West Residences 140
Hotels 2 AMOY Hotel 37
Central Region 3 The Clan 324
4 Village Hotel Sentosa,
The Outpost Hotel and 839
The Barracks Hotel
1 Total 1,340
3 2
1340
4
4483
3143
Existing Portfolio Pipeline Properties Enlarged Portfolio
(1) This picture is an artist’s impression of the property and may differ from the actual view of the property 29Industry Outlook & Prospects
International Travel Restrictions Starting To Be Relaxed

 27 Apr 20                                                              72%                                                                       28%

 18 May 20                                                                 75%                                                                     25%

 15 Jun 20                                                        65%                                                                       35%

  19 Jul 20                                             53%                                                                         47%

  1 Sep 20                                      43%                                                                           57%

  1 Nov 20                        27%                                                                            73%

              0%            10%              20%              30%               40%          50%           60%               70%          80%           90%   100%

                                                               Complete closure of borders     Partially or fully reopened

   ▪     In Dec 20, the World Tourism Organization (“WTO”) reported that a decline in the number of countries with complete
         closure of border; 27% of all countries had a complete closure in Dec 20 compared to 72% in Apr 20.
   ▪     Key characteristics of destinations that have eased travel restrictions are 1) high scores in health & hygiene indicators and
         2) low infection rates.

       Sources : WTO Covid-19 related travel restrictions: A Global Review for Tourism                                                                               31
Singapore Introducing Special Travel Arrangements
Country Arrangement Description
Long-term business travel (at least 90 days)
Periodic Commuting Valid work pass required
Malaysia
Arrangement Travel between land border crossings
7-day Stay-Home-Notice
Brunei, Japan,
Indonesia, Malaysia, Reciprocal Green Lane Short-term essential travel (to be sponsored by Government agency or
Germany company)
Submit and follow controlled 14-day itinerary
China (6 regions), Self-isolation until negative test result obtained
Fast Lane
South Korea
Australia, Brunei,
China (effective 6 Air Travel Pass (Uni-
Nov), New Zealand, lateral)
Vietnam Short-term visitors (including leisure)
Self-isolation until negative test result obtained
Air Travel Bubble (Bi-
Hong Kong
lateral)
▪ Since Jun 20, the Ministry of Foreign Affairs in Singapore has established special travel arrangements with 9 countries.
Travelers would have to undergo pre-departure and post-arrival Covid-19 PCR tests and be subject to self-isolation until
a negative test result is obtained.
32Vaccines Being Rolled Out Globally
▪ Following Pfizer-BioNTech’s
announcement that their vaccine
achieved >90% efficacy in
preventing Covid-19, other
vaccine candidates from
Moderna, AstraZeneca and
Sinovac have gotten regulatory
approvals for use in various
countries.
▪ As of 5 Jan 21, about 15m
doses of vaccinations have been
administered globally. Most
countries have yet to implement
a wide scale roll out of the
vaccine with most inoculatingOutlook & Prospects
▪ Global travel restrictions resulting from the pandemic continue to impact demand
• The Singapore hospitality industry will continue to be impacted by travel restrictions and concerns
over the spread of COVID-19. Near-term business will continue to be supported by Government
contracts and MCO-related accounts.
• The serviced residences in the portfolio, with a higher proportion of corporate long leases, will be
more resilient than the hotels during this crisis.
• The successful development of a vaccine or an effective rapid test for Covid-19 are catalysts that
could facilitate the recovery in international travel.
▪ Mitigating factors for Far East H-Trust
• Far East H-Trust continues to benefit from stable master leases signed with well-capitalized
companies of the Sponsor. The high fixed rent component of the master leases provides downside
protection for the gross revenue of the Trust.
• A review of the formula used to calculate management fees was undertaken at end-2019 and
resulted in lower REIT Manager’s fees effective Jan 2020.
34Outlook & Prospects
▪ Longer term plans for a recovery in place
• The Singapore Tourism Board (“STB”) started accepting applications for Meetings, Incentives,
Conventions and Exhibitions (“MICE”) events of up to 250 attendees with safe distancing
measures from 1 Oct 2020.
• The STB has also announced a partnership with Expedia to jointly promote Singapore as a
destination of choice in 10 overseas markets. Apart from offering travel-related promotions, online
ads and creative campaigns would also be rolled out to keep Singapore at the top of international
travelers' minds.
• Longer-term transformation plans of the tourism landscape like the Sentosa-Brani Masterplan and
the Mandai Makeover remain in place to strengthen Singapore’s tourism appeal.
• Singapore’s position as a hub for corporate travel continues to be strengthened by new
investment commitments of $13bn secured in 2020 by the Economic Development Board (“EDB”)
as well as the establishment of new regional headquarters of major technology firms like Tencent
and ByteDance.
35Thank You
For more information please visit
http://www.fehtrust.comFar East H-Trust Asset Portfolio Overview
Hotels
Orchard Rendezvous Total /
Village Hotel Village Hotel The Elizabeth Village Hotel Oasia The Oasia Hotel
Rendezvous Hotel Weighted
Albert Court Changi Hotel Bugis Hotel Novena Quincy Hotel Downtown
Hotel Singapore Average
Mid-tier / Mid-tier /
Market Segment Mid-tier Mid-tier Mid-tier Mid-tier Upscale Upscale Upscale NA
Upscale Upscale
1 Netheravon 24 Mount 22 Mount Elizabeth 9 Bras Basah
180 Albert Street, 390 Victoria Street, 8 Sinaran Drive, 1 Tanglin Road, 100 Peck Seah St,
Address Road, Elizabeth, S’pore Road, S’pore Road, S’pore
S’pore189971 S’pore 188061 S’pore 307470 S’pore 247905 S’pore 079333
S’pore 508502 228518 228517 189559
Date of Completion 3 Oct 1994 30 Jan 19902 3 May 1993 19 Oct 1988 2 June 2011 20 June 19872 27 Nov 2008 5 June 20002 30 Dec 2015
# of Rooms 210 380 256 393 428 388 108 298 314 2,775
Lease Tenure1 68 years 58 years 68 years 59 years 85 years 43 years 68 years 64 years 63 years NA
GFA/Strata Area (sq m) 11,426 22,826 11,723 21,676 22,457 34,072 4,810 19,720 11,863
Retail NLA (sq m) 1,003 805 583 1,166 NA 3,778 NA 2,799 NA 10,134
Office NLA (sq m) NA NA NA NA NA 2,515 NA NA NA 2,515
First Choice Far East Golden Transurban Golden Far East
Golden Landmark Far East Orchard Serene Land Pte
Master Lessee / Vendor Properties Organization Development Properties Development SOHO
Pte. Ltd. Limited Ltd
Pte Ltd Centre Pte. Ltd. Private Limited Pte. Ltd. Private Limited Pte Ltd
Valuation (S$ ‘mil)1 127.8 205.8 163.7 232.7 330.0 431.2 82.0 284.1 245.0 2,102.3
1 As at 31 December 2019
2 Date of acquisition by Sponsor, as property was not developed by Sponsor
37Far East H-Trust Asset Portfolio Overview
Serviced Residences
Village Residence Village Residence Village Residence Regency Total /
Clarke Quay Hougang Robertson Quay House Weighted Average
Market Segment Mid-tier Mid-tier Mid-tier Upscale NA
20 Havelock Road, 1 Hougang Street 91, 30 Robertson Quay, 121 Penang House,
Address
S’pore 059765 S’pore 538692 S’pore 238251 S’pore 238464
Date of Completion 19 Feb 1998 30 Dec 1999 12 July 1996 24 Oct 2000
# of Rooms 128 78 72 90 368
Lease Tenure1 73 years 74 years 71 years 74 years NA
GFA/Strata Area (sq m) 17,858 14,257 10,570 10,723 53,408
Retail NLA (sq m) 2,213 NA 1,179 539 3,931
Office: 1,474
Office NLA (sq m) NA NA 2,291 4,588
Serviced Office: 823
Master Lessee / Vendor OPH Riverside Pte Ltd Serene Land Pte Ltd Riverland Pte Ltd Oxley Hill Properties Pte Ltd
Valuation (S$ ‘mil) 1 205.9 62.0 105.3 170.2 543.4
1 As at 31 December 2019
38You can also read