Covered Bond Quarterly: Q2 2021 - Scope Group
←
→
Page content transcription
If your browser does not render page correctly, please read the page content below
Covered Bond Quarterly: Q2 2021
Moderate house price growth expected; shedding a tear for missed
harmonisation deadline; ESG theme evolving but sustainability factors not
decisive in determining credit quality (otherwise unimpaired by Covid-19)

Covered Bond Ratings, Scope Ratings GmbH, 1 July 2021

info@scoperatings.com │ www.scoperatings.com             │ Bloomberg: RESP SCOP
Covered Bond Quarterly: Q2 2021
Executive summary
The credit quality of covered bonds remains unimpaired by the Covid crisis; there were no
rating changes on covered bonds in the last quarter. Provided variants do not take centre
stage, we see no credit-relevant topics for analysing covered bonds that could materially
dampen the bright spots on the horizon.
Low interest rates and creeping inflation – both supporting stability of collateral prices and
managable levels of unemployment – are not expected to weaken the credit quality of
collateral pools. As the credit quality of covered bonds is already at the highest levels, the
silver lining stemming from reduced infection and increased vacination rates coupled with
a brighter economic outlook and strong GDP catch-up in most of Europe can not provide
any further uplift.
House prices are expected to grow moderately, fuelled by low interest rates and economic
recovery, but at a lower pace. However, in some countries the trend of moderating/declining
house price growth observed prior to the pandemic may resume. Boosting growth during
the pandemic will have aroused regulators and calls for further macroprudential measures
to stem growth may be called for.
Maintenance of central bank purchase programmes offers issuers more attractive spreads
in the primary markets, which remain subdued: new issuance is well below expectations.
Investors continue to grind their teeth from a lack of supply but also benefit from spread
stability. Spreads continue to tighten – at a much slower pace than before, however.
What investors are more focused on is the relative positioning of covered bonds against EU
bonds. With the second helping of the Next Generation EU (NGEU) bonds, supply for rates
investors has started increasing. At the current pace, it is likely that NGEU bonds will see
larger issuance volumes than the total covered bond segment in 2021.
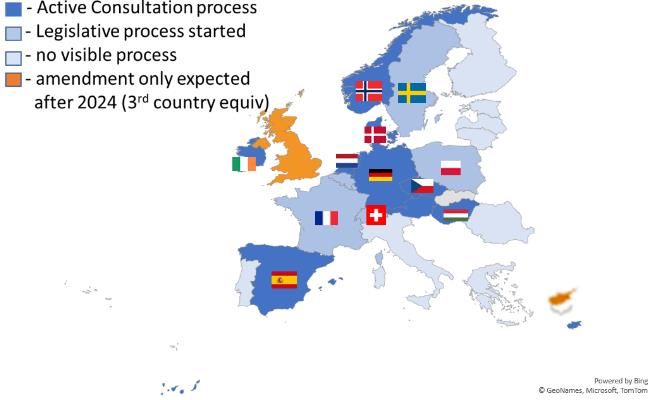
From a European covered bond harmonisation perspective, we will be shedding some tears
on July 8. While there will be no market or regulatory impact yet, most have used the Covid
“excuse” not to translate the proposals into national laws.
We applaud those Musterschüler that managed an ‘orderly’ directive translation (including
some CEE countries such as Hungary and the Czech Republic). Traditional covered bond
countries only saw regulators consulting bilaterally with issuers (France, Belgium) or
remain totally opaque on the transition status (Italy). Spain has just broken cover with a
drafted law transposing the directive published on 25 June.
With the publication of the EU Green Bond Standard, another ESG flavour was added to the
ever growing number of ESG labels. Investors clearly appreciate the choice but decry the
lack of standardisation. ESG aficionados need to love divergence, but this is increasingly
becoming a concern. European supervisory authorities have reacted and implemented the
Sustainable Finance Disclosure Regulation in March.
Following our recent webinar on ESG in covered bonds, we provide an overview of where
ESG factors can play a role in Scope’s covered bond rating analysis – and why they are
currently not decisive for determining credit quality.
2Covered Bond Quarterly: Q2 2021
Contents
Executive summary .............................................................................................................................................. 2
Market Developments in Q2/21 ............................................................................................................................ 4
European covered bond harmonisation – not yet there .................................................................................... 4
European House Prices: Rally over? .................................................................................................................. 5
Covered bonds – a long-standing ESG history .................................................................................................. 6
EU Taxonomy, a blessing or a curse ................................................................................................................... 6
Scope’s covered bond’s ESG risk assessment.................................................................................................. 7
ESG and credit risk: Causation or correlation.................................................................................................... 7
Rating overview in detail ...................................................................................................................................... 8
Scope rating monitoring notes ............................................................................................................................ 9
Q2: Related bank and covered bond research ................................................................................................... 9
Disclaimer ............................................................................................................................................................ 10
Scope Covered Bond Ratings
Karlo Fuchs, Mathias Pleißner Reber Acar
Managing Director Director Associate Director
Head of Covered Bonds Covered Bonds Covered Bonds
k.fuchs@scoperatings.com m.pleissner@scoperatings.com r.acar@scoperatings.com
3Covered Bond Quarterly: Q2 2021
Market Developments in Q2/21
Investors have been starved of new covered bond Figure 2: Spreads of Italian OBGs vs BTPs
issuance. The combination of the eighth TLTRO tender
Italian cb vs Gov Italy Italy Sov
in June (in which banks took EUR 110bn vs
EUR 330.5bn in its seventh iteration in March 2021) 300
plus maintenance of the ECB’s covered bond (and
other) central bank purchase programmes means that 200
public covered bond issuance remains subdued.
100
In the first half of 2021, the public covered bond market
bps
0
shrunk by approximately EUR 40bn as redemptions of
about EUR 90bn were replenished with just EUR 50bn
-100
of new supply (of which roughly EUR 20bn was
siphoned off by the ECB via CBPP3). -200
In principle, growing house prices and larger mortgages -300
mean higher refinancing volumes, but banks are not
currently encumbering their balance sheets by issuing
covered bonds. Rather, they deploy deposits (or use Time
retained covered bonds used for TLTRO funding) to Source: Markit, Scope Ratings
finance them.
As the ECB is currently ruling out a tapering of its loose European covered bond
monetary policy, we do not expect the dire situation for harmonisation – not yet there
covered bond investors to change any time soon.
Similarly, looking at the development of covered bond The first half of 2021 finally saw a number of European
and related agency and bank spreads, it seems that the countries pass required legislative acts. For those few
summer lull has already started – about a year ago. Musterschüler (among them Germany, Denmark,
Ireland but also Hungary and the Czech Republic) the
Figure 1: Secondary market spreads covered bond directive was transposed and will be
EUR Covered EUR Agencies Banks Senior pref
activated on 8 July.
200 Figure 3: Covered bond harmonisation – not yet
180 there
160
140
120
100
bps
80
60
40
20
0
-20
Time
Source: Markit, Scope Ratings
Source: National regulators, Scope Ratings
Covered bond spreads only have moved sideways Further, some countries have finally shown their cards:
eventually grinding some 10bp lower year on year.
The long-awaited consolidation of the three similar but
Even in Italy, where Covid hit first and hardest, has seen diverging Austrian covered bonds types was finally
little spread movement and the spread differential dealt with (see Austria’s covered bonds: transposing
between Italian covered bonds and its sovereign EU directive brings credit-positive consolidation). Going
equivalent remained firmly negative. forward all Austrian issuers will be able to issue the
same covered bond type under the same legal
framework.
By contrast, harmonisation and European diversity
could also result in a diverging development.
4Covered Bond Quarterly: Q2 2021
As small as Luxembourg is, it will have the highest The main factors that has boosted house prices in the
number of covered bond types going forward. last decade has been affordability. Low interest rates
and benign economies in Europe supported a stronger
With a dwindling number of specialised active covered demand for real estate in general. These two factors did
bond issuers (down to one in 2021 from a high of six in not change during the pandemic. First, potential house
2012), Luxembourg legislators have opened up the buyers (high-income adults) were less impacted from
menu. They will open up covered bond issuance to the short-term impacts of the pandemic. Second,
universal banks (with a novel 20% encumbrance limit). government subsidies offset immediate impacts on
And the existing menu of five covered bond types – corporate bankruptcy.
lettres de gage backed by public sector loans;
mortgages, movables (aircraft, ships/boats and railway What has changed however is building activity.
rolling stock); co-operative lending and renewable Residential construction output in Europe contracted by
energy collateral – will see the addition of another two 8.6% in 2020. In the second quarter of last year, the
– harmonisation compliant – “obligations garanties number of new building permits in Europe fell by 18.1%
européennes European covered bonds. year-on-year. This has partly recovered, but as of end-
2020 the number of permits was still 7.4% lower than in
We wonder whether further blurring the Luxembourg the previous year. As a consequence, this delayed the
version of covered bonds will revive the market or rather already tight supply of new housing in most European
nail it as a nice theoretical option which is only randomly countries and put further pressure on prices.
and arbitrarily used. To their benefit, the Luxembourg
legislators have been open on how to translate the With building activity catching up in 2021/2022, house
directive. price growth will lose momentum but a decline in prices
is unlikely for most European countries. Interest rates
On 25 June, Spanish lawmakers published a draft law will remain low and European households have
that is generally in line with the European Commission’s accumulated record-high savings during the pandemic.
Covered Bond Directive. With this, Spanish covered
bonds will share most of the European positive Still, house prices locally have reached levels at which
standards with other EU covered bond issuers, but at most households will have trouble to get a bank loan
the same time lose their high OC levels which was one without a material down-payment. This is most
of the unique selling points of Spanish covered bonds. expressed in European metropoles where price growth
has significantly decoupled from the country averages
This is in stark contrast to their French peers. While it is during the last decade. According to latest ECB
well known that discussions started some time ago, we analysis, residential property in metropoles however
wonder why the regulator remain so opaque. experienced lower growth compared to the average
market. This has not been observed since 2006 and
To our understanding, changes to the French set-up
might be a sign of some cooling down in European
deal only with subtleties – at least from a rating
metropolitan areas.
perspective. As such changes should be neutral for
issuers. Difficulties obtaining a mortgage may become
reinforced by macroprudential measures restricting new
European house prices: loans. All over Europe, regulators are huddling together
to force down property demand. This could translate
rally over? into new measures limiting credit growth and leverage.
Growth in house prices across Europe peaked in 2020 Between 2014 and 2018, regulators had been relatively
at levels above 6%. On average, house prices went up active in calming markets by introducing
by 6.2%. At the same time, real GDP went down by macroprudential measures. In some cases, this has
6.1%. While most economists are clear about a strong been successful. However, since then regulators have
GDP rebound in 2021/2022, views on house prices are remained relatively silent. Only in Norway and Sweden
divided. were measures to restrict credit growth and leverage
introduced during the pandemic, but some eased
Figure 4: European house prices existing measures as regulators feared a temporary
annual growth (RHS) payment shock among mortgage borrowers. That did
avg. European house prices (LHS) not prove to be the case, however.
150 7.0%
More stringent measures are expected to limit the ability
125 3.5% of average households to receive mortgage financing
any time soon. This in turn will reduce demand and as
100 0.0% a consequence soften house price growth.
75 -3.5% On 29 June, Finland’s financial supervisory authority
(Finanssilvalvonta Finansinspektionen) re-introduced
cap on housing loans for residential mortgage loans
Source: Eurostat, Scope Ratings financing second or holiday homes, effective from
5Covered Bond Quarterly: Q2 2021
1 October. Thanks to strong amortisation, average For most of the remaining countries, we expect house
LTVs in Finland are moderate by comparison to price growth roughly in line with inflation and mostly in
European peers (especially the Nordics), Limiting the positive territory if the economic outlook brightens
maximum LTV to 85% marks the first step to further together with a strong GDP catch up in most European
tightening. countries.
On average, we do not think that European house
prices will decline in the medium term as the market
Covered bonds – a long-
remains fuelled by the low interest-rate environment, standing history
inflation has started to creep in and the economy
remains benign. And not all areas are heating up. When the covered bond was created more than 250
years ago by Frederick The Great, it overflowed with
In some countries, however, the trend of
‘Governance’. The ‘G’ was the guiding principle from
moderating/declining house price growth already seen
the first day when “Pfandbriefe” were born in Prussia
before the pandemic may resume. The UK, Sweden,
back in 1769.
Ireland and Spain have under-performed the European
average. Based on a royal decree, Frederick set up
“Landschaften”. These legally secured the ownership of
Figure 5: Selected house price trends
property and allowed the owner to grant debentures
Ireland Spain Sweden UK EU over it. If the obligations under the debt were not met,
120 regulation allowed for public foreclosure of the real
estate.
115
The First “Social” covered bonds were issued in
110 Denmark back in 1795. The Great Fire of Copenhagen
burnt a quarter of the city to the ground. After the fire, a
105 great need arose for an organised credit market
because a large number of new buildings had to be built
100
2018 2019 2020 in a short space of time. Danish covered bonds were
thus born with a strong social element.
Source: Eurostat, Scope Ratings
“Sustainable” or “Green” covered bonds took longer to
For Ireland and the UK, prices have mainly been driven emerge. Münchener Hypothekenbank issuing a
by uncertainties around Brexit. This started to affect covered bond in 2014 with collateral based on
house prices from 2018 onwards. To what extent this sustainable ecological, social and governance criteria.
continues affecting house prices will depend on how In 2015, Berlin Hyp issued the first covered bond to be
well the UK can recover from the pandemic and how labeled green with issuing proceeds used to refinance
trade restrictions and duties, in particular with the EU, green buildings.
impacts the local economy.
In 2020 social or green labelled benchmark covered
In Sweden, house prices did not experience a material bond issuance accounted for 13% of overall issuance.
revaluation around the time of the GFC so they are 2021 has shown lower sustainable activities to-date but
relatively inflated in a European context. Concerns the trend is clear and remains strong.
around a potential housing bubble have been
addressed by a series of macroprudential measures EU Taxonomy, a blessing or
since then. Those have made buying real estate less
attractive and kept house prices relatively stable a curse?
between 2017 and 2020. However, the coronavirus-
driven house price run did not spare Sweden with a The governance of covered bonds is bespoke for each
nationwide house price index surge of 10.1% in 2020 legal system. While the EU Covered Bond Directive
and 11.5% in greater Stockholm. This is roughly double was a great move to standardise certain relevant
the European average. Together with expected new governance principles, there is still room for national
macroprudential measure to be introduced, this growth discretion. The same issue applies to the EU taxonomy
is likely to be corrected in the short term with below for environmental principles. Its reference to Energy
average growth or even a moderate decline. Performance Certificates (EPCs) defies direct
comparison as national EPC scores differ. Further the
Spanish house prices started to recover after the global share of eligible buildings in the highest categories
financial crisis, but this was halted in the third quarter of (EPC A and B) is very small.
2019. In some Spanish regions, this reflects an already
overheated market prompting price corrections. This However, the taxonomy allows for an alternative:
correction may have been only interrupted by the buildings financed/refinanced by a green bond must be
pandemic-driven house price rally and may continue. within the top 15% of national or regional building stock.
6Covered Bond Quarterly: Q2 2021
But even this is not a ‘one size fits all’. For instance, the fundamental support analysis reflects factors such as
Danes may have challenges in generating sufficient the stringency of internal and external governance. Our
green collateral because of the balance principle resolution analysis reflects the governance impact of
applicable to Danish mortgage banks. They cannot regulatory oversight and an active stakeholder
simply select a sub portfolio of eligible green loans to community.
synthetically back a dedicated green covered bond.
And they cannot easily use proceeds of a green bond Governance factors such as a potential imbalance
to invest in loans funding sustainable assets. between complexity and risk vs. transparency as well
as management support can further constrain the
This is because a Danish mortgage loan is directly maximum uplift. Beside qualitative factors, ESG can
linked to its covered bond (match funding). To issue a also impact our cover-pool support analysis from a
benchmark covered bond, it may require bundling loans more quantitative angle.
with the same maturity and interest reset profile that are
all subject to refinancing. This is challenging and may ESG and credit risk: causation
only be possible for the large players as long as eligible
green loans reflect only a fraction of the overall market. or correlation?
Market players are looking for solutions, but this will not Neither market participants nor scientists have focused
improve transparency in a European (green) covered on the past on finding evidence around the relation
bond market claiming to be harmonised. between credit risk and sustainability. Not only because
sustainability has only recently emerged as such a vital
Scope’s covered bond ESG topic but because energy efficiency data was not stored
risk assessment or even requested for newly originated mortgage loans.
Moreover, only a few countries benefit from a
centralised data repository that might allow a broader
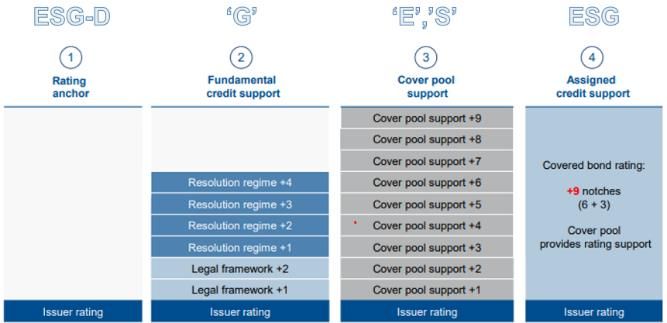
We consider ESG principles throughout our full rating
picture to be formed and most importantly to yield
process for covered bonds, starting with the anchor
significant results in regard to ESG and credit risk.
point – the issuer rating – and complemented by all
building blocks determining the covered bond rating. We looked into several studies that all highlighted a
relation between ESG Scores or energy efficiency of
Figure 6: ESG in Scope’s covered bond ratings
buildings and the likelihood to default. The most
promising studies were published by Nationwide
(Energy efficiency vs. default probability 03/2021) and
Ca' Foscari University of Venice (Buildings’ Energy
Efficiency and the Probability of Mortgage Default: The
Dutch Case 05/2020). Both are based on relatively
large samples of mortgages that were tested against
energy efficiency measures.
The studies provided significant results and support
what the market is craving– correlation between
Source: Scope Ratings
sustainability and credit risk. However, from our point of
Long-term business sustainability is an important factor view whether the relationship is really causation or just
in the credit analysis of a bank. In our analysis, we correlation remains unanswered.
provide transparency on how the issuer is addressing
ESG factors but also how they are positioned to benefit For instance, ‘the Dutch case’ can show that low energy
from or potentially fail to address the digital transition efficiency buildings explain much of the default
(combined in the ESG-D assessment). likelihood of loans to low-income households. On the
other hand, there is no impact/correlation if income is
As with the proposed green asset ratio and impact of high. The question arises whether low-income
climate risk, we expect the preparedness and inclusion households really can afford high energy efficient
of this factor in a bank’s strategy and underwriting to buildings. Other income or factors are likely not taken
become an integral part of the regulatory focus. into consideration based on the dataset available.
The ESG-D assessment can therefore result in positive If more efficient collateral impacts default probability, it
or negative adjustments to a bank’s rating anchor and should be irrespective of household income. The
is integral to the assessment of the issuer’s business in hypothesis requires further study to support the
the context of a changing operating environment. When assumption (or hope) that ESG is a positive driver of
establishing the additional covered bond uplift, default and may consequently even convince regulators
governance considerations (such as strength of to make it a driver of regulatory capital as well.
supervision as well as the prudent management of the
risk and protection structure of a covered bond Our own studies based on data available on Norwegian
programme) may lead to additional adjustments of both covered bonds did not show any significant
fundamental and cover-pool support analysis. Our dependency between PD, LGD and energy efficiency.
7Covered Bond Quarterly: Q2 2021
At the same time, the dual recourse of covered bonds
While green funding has also allows issuers to support the highest ratings on the
convinced basis of cover pool support. Notably, covered bonds in
Austria and Norway achieve AAA ratings with the help
ESG-compliant bonds attract more investors and may of this rating driver.
lead to investor diversity. This will, first of all, become
High bank ratings coupled with supportive legal and
highly relevant if market liquidity tightens and the
resolution frameworks (see Figure 8) provide 84% of
central bank starts signing off from absorbing most of
covered bond programmes rated by Scope with
the newly issued covered bonds.
sufficient support to reach the highest ratings. Most of
ESG issuance can also reduce average refinancing these ratings are very resilient to issuer downgrades.
costs. Even though covered bonds only provide Cover-pool support is only a secondary rating driver,
minuscule ‘greenium’ of 2-3bp compared to non ESG but the strength of the cover pool can provide additional
compliant covered bonds, this gap may increase if rates rating stability.
and spreads widen again.
Figure 8: Covered bond rating composition
Analytically, issuers with a more diversified funding
profile and access to a broad group of investors may be
less exposed to refinancing risk, which could be
addressed by lower stresses on our refinancing
spreads.
Q2 2021: credit quality of
covered bonds remains stable
Stable bank ratings continue to be supportive of the
stability of Scope’s covered bond ratings, all of which
are rated AAA with stable outlooks. The most resilient Source: Scope Ratings
covered bond ratings remain those in Finland, France,
Netherlands, Sweden, and Denmark. This primarily
reflects the fact that this is where average bank ratings
Rating overview in detail
within Scope’s coverage are highest. Consequently, the
covered bonds rated in those countries have the As of Q2 2021, Scope rates 38 programmes from
highest resilience to changes of the issuer rating (see 25 issuers in 11 countries. We provide a
Figure 7 below). The highest covered bond ratings in comprehensive overview including: i) key rating
those countries are achieved by taking into account metrices and ii) references to commentaries on the
fundamental credit support. issuer and its covered bonds in an easy-to-use Excel
format that can be downloaded here.
Only 16% of Scope rated covered bond programmes
are reliant on additional cover pool uplift to achieve the
highest rating. The buffer against issuer downgrades is
lower for such programmes, but strong cover-pool
support can in most cases can still mitigate a
downgrade of the issuer rating.
Figure 7: Covered bond rating stability
Source: Scope Ratings
8Covered Bond Quarterly: Q2 2021
disposable income in the past decade, a slowdown in
Scope rating actions and growth is justified. We see little risk of an abrupt price
monitoring notes correction, though, reflecting reduced market risk for
mortgage lenders, moderate household indebtedness,
28 May 2021 – Scope affirms AAA rating on SSB a functioning rental sector, and a regulator actively
Boligkreditt’s Norwegian mortgage-covered bonds promoting sustainable lending standards. Click here to
– Outlook Stable download the full research report.
On 28 May, Scope affirmed the AAA rating with a Stable Will safety of financial assets prevail over debt risk
Outlook on the Norwegian covered bonds (obligasjoner in Denmark? Danish households are the wealthiest in
med fortrinnsrett) issued by SSB Boligkreditt AS, the Europe. But they are also the most indebted. This
fully owned mortgage subsidiary of Sandnes significantly exposes their wealth to interest and house-
Sparebank. The A- issuer rating combined with price revaluation risk and makes them susceptible to
fundamental credit and cover pool support results in the income shocks. Financial assets serve as a safety net
highest achievable ratings for the bonds. The cover against risks stemming from mortgage debt, but risk
pool consists of fully domestic, owner-occupied appetite is gaining momentum. This may call for
residential assets and benefits from a low LTV. regulatory action. Click here to download the full
research report.
Click here to access the rating affirmation and here to
download the performance update with key programme Charging negative rates on retail deposits is not
information. without risk for banks: Corporate customers have
been on the receiving end of negative deposit rates for
Q2: Related bank and covered years, but some European banks have recently started
to charge individuals; a practice that carries a different
bond research set of commercial, reputational and legal risks. Click
here to access the full research report.
Webinar: Prospects and outlook for ESG covered
bonds. Click here for the recording of the session. Norwegian banks: adoption of EU Creditor
Hierarchy Directive facilitates MREL issuance:
European house prices: time for regulators to hit Upcoming adoption of the EU Creditor Hierarchy
the brakes? Growth in house prices across Europe Directive will allow Norwegian banks to issue senior
was stronger in 2020 than it has been at any time in the non-preferred debt on a statutory basis for the first time.
last decade. The economic outlook and pressure on The country’s banking supervisor has consistently said
housing affordability and profitability point to a there is a basis for most banks in Norway to be subject
moderation in growth. That said, with ultra-low interest to an MREL requirement. Click here to download the full
rates, housing shortages in metropolitan areas and research report.
high-income mid agers being spared income losses,
growth could even accelerate. This may be the right French banks: supervisory pilot test reveals
time for regulators to become proactive and introduce moderate exposure to climate risks: French banks
stricter macroprudential measures, else banks and display moderate exposure to climate risks, according
borrowers might be caught on the wrong foot when the to a pilot exercise performed by the ACPR, the French
tide turns. Click here to download the full research financial supervisory authority, between July 2020 and
report. April 2021. This is the first assessment of financial risks
stemming from climate change performed by the
Austria’s covered bonds: transposing EU directive French authorities. Click here to download the full
brings credit-positive consolidation: Austria’s research report.
covered bonds are among the oldest in Europe, yet the
country’s legislation is also among the most Italian banks: significant room to optimise capital
fragmented: three different covered-bond regimes exist structures: Smaller Italian banks have not optimised
in parallel. The 8 July 2021 deadline to transpose the their capital structures. Eight out of 10 banks sampled
European Covered Bond Directive will consolidate had room to do so at the end of 2020 through issuance
existing legislation, both modernising it and bringing it of capital securities. The acceleration in the pace of
into line with that of other EU members. Click here to balance sheet de-risking at medium-sized banks in
download the full research report. 2019 and 2020, alongside the compression of yields in
credit markets may make these deals more attractive to
Austrian house prices: little risk of an abrupt price Italian banks. Click here to download the full research
correction, at least for now: The pandemic has report.
fuelled Austrian house price growth. With price
increases running at more than twice the growth of
9Covered Bond Quarterly: Q2 2021
Scope Ratings GmbH
Headquarters Berlin Frankfurt am Main Paris
Lennéstraße 5 Neue Mainzer Straße 66-68 23 Boulevard des Capucines
D-10785 Berlin D-60311 Frankfurt am Main F-75002 Paris
Phone +49 30 27891 0 Phone +49 69 66 77 389 0 Phone +33 1 8288 5557
Oslo Madrid Milan
Karenslyst allé 53 Edificio Torre Europa Via Nino Bixio, 31
N-0279 Oslo Paseo de la Castellana 95 20129 Milano MI
E-28046 Madrid
Phone +47 21 62 31 42 Phone +39 02 30315 814
Phone +34 914 186 973
Scope Ratings UK Limited
London
111 Buckingham Palace Road
London SW1W 0SR
Phone +44 (0)20 7340 6347
info@scoperatings.com
www.scoperatings.com
Disclaimer
© 2021 Scope SE & Co. KGaA and all its subsidiaries including Scope Ratings GmbH, Scope Ratings UK Limited,
Scope Analysis GmbH, Scope Investor Services GmbH, and Scope ESG Analysis GmbH (collectively, Scope). All
rights reserved. The information and data supporting Scope’s ratings, rating reports, rating opinions and related
research and credit opinions originate from sources Scope considers to be reliable and accurate. Scope does not,
however, independently verify the reliability and accuracy of the information and data. Scope’s ratings, rating reports,
rating opinions, or related research and credit opinions are provided ‘as is’ without any representation or warranty
of any kind. In no circumstance shall Scope or its directors, officers, employees and other representatives be liable
to any party for any direct, indirect, incidental or other damages, expenses of any kind, or losses arising from any
use of Scope’s ratings, rating reports, rating opinions, related research or credit opinions. Ratings and other related
credit opinions issued by Scope are, and have to be viewed by any party as, opinions on relative credit risk and not
a statement of fact or recommendation to purchase, hold or sell securities. Past performance does not necessarily
predict future results. Any report issued by Scope is not a prospectus or similar document related to a debt security
or issuing entity. Scope issues credit ratings and related research and opinions with the understanding and
expectation that parties using them will assess independently the suitability of each security for investment or
transaction purposes. Scope’s credit ratings address relative credit risk, they do not address other risks such as
market, liquidity, legal, or volatility. The information and data included herein is protected by copyright and other
laws. To reproduce, transmit, transfer, disseminate, translate, resell, or store for subsequent use for any such
purpose the information and data contained herein, contact Scope Ratings GmbH at Lennéstraße 5 D-10785 Berlin.
10You can also read