Supply Chains in the Clothing Industry - A House of Cards?! - A report on the opportunities and risks in the supply chains of textile and apparel ...
←
→
Page content transcription
If your browser does not render page correctly, please read the page content below
Supply Chains in the Clothing Industry –
A House of Cards?!
A report on the opportunities and risks in the supply chains of textile and apparel companies

Sustainable Investment Focus
June 2014
Bank J. Safra Sarasin Ltd
J. Safra Sarasin Sustainable Investment Research

Elisabethenstrasse 62
P.O. Box
CH - 4002 Basel
Switzerland
Phone + 41 (0)58 317 44 44
Fax + 41 (0)58 317 44 00
www.jsafrasarasin.com
sustainableinvestments@jsafrasarasin.com           © Copyright Bank J. Safra Sarasin Ltd. All rights reserved.

2
Supply Chains in the Clothing Industry –
A House of Cards?!
This report discusses the opportunities and risks facing textile and apparel companies in their procurement activi-
ties. In addition to the economic importance and organisational complexity of supply chains, the report also high-
lights trends and problem areas in the procurement process. Finally, it looks at the question of whether – and to
what extent – sustainable procurement policies and potentially controversial aspects of the supply chain can have
a positive or negative impact on enterprise value. Although environmental aspects are becoming increasingly im-
portant, the focus still tends to be on the social dimension at present.
Introduction ly brings the benefits of lower production costs, but also
It was on 24 April 2013 that the eight-storey Rana Plaza a series of risks, in the form of obligations. Consumers
building collapsed in the vicinity of the Bangladeshi capi- and the general public ultimately view these retail com-
tal, Dhaka. This disaster resulted in 1,138 deaths and panies as being responsible for the products, irrespective
more than 2,000 injured. Three out of the eight storeys of who actually made them, and where.
had been constructed illegally. Despite reports of struc- A few years ago a good cost/benefit ratio was perfectly
tural cracks appearing, the management of the five textile adequate for the successful procurement of textiles and
companies housed in the building at the time took no ac- clothing, but now a whole range of other factors have to
tion at all, whereas other businesses in the same prem- be taken into consideration both on the sales and pro-
ises had already downed tools. This tragic accident led to curement market front: speed of innovation, volatility of
protests and riots by textile workers, who have virtually demand, more effective product differentiation (e.g. by
no trade union support in Bangladesh. region) and - last but not least – the higher social and en-
A few months before that, another fire in the Tazreen tex- vironmental standards in production expected by custom-
tile factory in a suburb of Dhaka claimed more than 100 ers.
lives and injured over 200 people. In September 2012 Given this backdrop, the business models of many com-
more than 250 people perished in fires in Pakistan. Dur- panies are similar to a house of cards that threatens to
ing the past eight years, it is estimated that more than wobble or even collapse entirely when there are major
1,500 people have died and 3,000 people injured in fires tremors.
or collapsed buildings in textile factories.
Such tragedies in the recent years (including Foxconn in In light of these developments, this report takes a closer
the electronics industry and “Horsemeat scandal” in the look at the following aspects:
food sector) are a tragic reminder of the current challeng-
es associated with modern supply chains. Significance and complexity of supply chains
In view of increasing globalisation and permanent cost Main problems in the supply chain of clothing
and price pressure, the boundaries of a company’s own companies
business activity are becoming increasingly blurred. Positioning and strategies of sportswear & ap-
Whereas in the past a company was only responsible for parel companies
activities “within its own four walls”, this is no longer the Impacts of controversial aspects of the supply
case, in light of the growing trend for outsourcing produc- chain on the enterprise value
tion to low-wage developing countries. Sportswear com-
panies such as Nike and Adidas, for example, have grad-
ually shifted their focus from the manufacture of sports
goods to simply designing and marketing them, having
outsourced production almost entirely to contract manu-
facturers. However, this type of business strategy not on-
3Significance and complexity of supply chains Joint industry efforts by purchasers (such as Better Work,
The supply chain is essentially a network of interconnect- Business Social Compliance Initiative or the Fair Labor
ed supply companies. As part of a general trend towards Association) in order to carry out collective audits are im-
specialisation, which is in turn the result of the increasing portant examples of positive initiatives in this area.
complexity of products as well as permanent cost and
price pressure, many companies have decided to out- Main problems in the
source production processes. In many cases manufactur- supply chain of clothing companies
ing is outsourced to countries with lower production The crux of the supplier problem is that the cost factor is
costs, in other words developing countries for the most always a key selection criterion. As soon as costs rise in
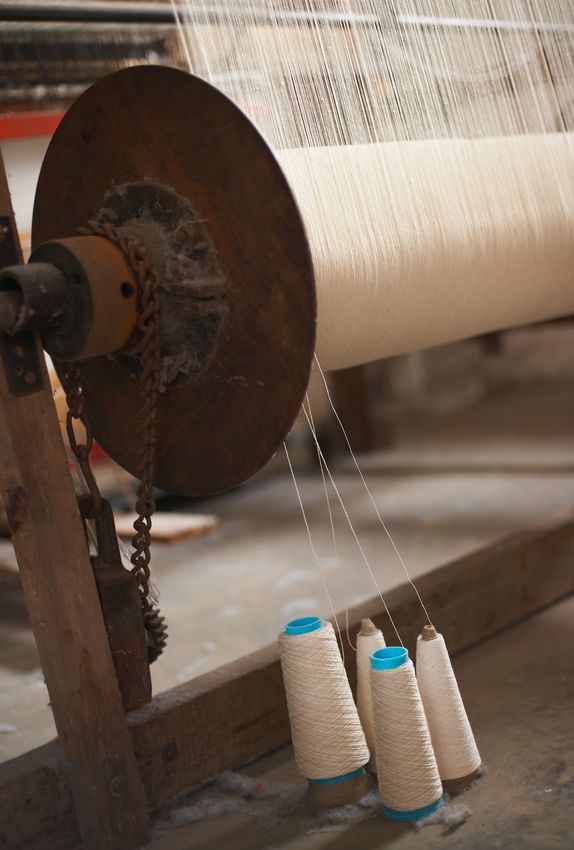
part. Figure 1 shows how complex supply chains can be. the supplier’s country, shareholder pressure forces the
The simplified example of a company producing sports clothing company to optimise its supply chain. This leads
goods highlights the many different layers of the supply to continuous competition in the country where supply is
chain. In order to manufacture a T-shirt, for example, the based, as highlighted in the study “A Race to the Bottom
cotton crop first needs to be planted and picked, and in Labour Standards?” (Davies/Vadlamannati, November
then the raw cotton sorted, washed woven and dyed. Only 2011). As a rule, governments in the countries where the
then does it move on to the labour-intensive stage of goods are produced are not interested in improving condi-
garment manufacture, before finally being delivered to the tions for employees, as it would bump up costs for em-
wholesaler or retailer. ployers as well and might encourage outsourcing compa-
nies to take their business elsewhere. Here it should be
Figure 1: Schematic illustration noted, for example, that the textile industry in Bangla-
of the value chain of a textile company desh makes a substantial contribution of 10-15% to na-
Example of Activities tional GDP and employs around 4 million people, mainly
Company Logistics, Marketing women. The companies themselves are keen to make
sure there are no accidents, as it could seriously harm
Tier 1 Supplier Apparel Manufacturing
their reputation, image or brand. Even so, the persistent
competitive pressure in the garment industry ensures
Tier 2 Supplier Textile Embroidery and Cutting
that production chains are continuously adapted, which
Tier 3 Supplier Cotton Weaving and Dyeing not only drives down costs, but also exacerbates the
problems. This is because production is generally shifted
Tier 4 Supplier Cotton Farming
to countries with even cheaper labour costs and an even
Source: Puma less developed economy.
Recently, however, there has been a counter trend. Relo-
It is not uncommon for some producers of shoes and ap- cating production closer to the point of sale allows com-
parel to have more than 1,000 suppliers scattered panies to speed up the supply chain and respond to mar-
across several dozen countries. In many cases, however, ket trends more quickly. While the lead time for suppliers
around a third account for the bulk of sales. A smoothly in Asia is roughly three months, orders for goods being
functioning and sustainable supply chain is therefore cru- made in southern Europe can be delivered within two
cial for the commercial success of clothing companies. weeks. This can be a key success factor for companies
In such a scenario, the question is how far these compa- that need to be able to respond very quickly to rapidly
nies’ controls can or should extend, in order to minimise changing fashion trends. While production costs are sig-
the inherent risks and take advantage of potential oppor- nificantly higher for “local outsourcing”, they can be off-
tunities. Two key aspects need to be borne in mind here: set to some extent by lower transport costs.
1. Is it actually possible for companies to push
through their demands?
2. Who bears the cost for the controls/audits and
the resulting improvement measures (such as
better safety in the workplace)?
4China still supplies a substantial proportion of the world's of the list of countries for offshoring textile manufacturing
textiles. Other important production locations are to be in future. Foreign investors are increasingly setting up
found in developing countries such as Bangladesh, Vi- their own textile production capacities, for example Chi-
etnam and Turkey (Figure 2). nese and Turkish producers who are setting up vertically
integrated production facilities in Ethiopia in a bid to ben-
Figure 2: Textile Exports 2012 efit from the availability of cheap local cotton and low la-
bour costs. But investments are not only required in pro-
duction facilities, but also in the country’s infrastructure.
35%
This latter aspect is preventing countries such as India
37%
and other low-cost countries from winning additional mar-
ket shares from China especially in the area of textile and
garment production. Nevertheless, China is still by far the
3%
5% 3% biggest exporter of textiles. For the time being, China will
5% 5% 4% 3%
retain its lead as the world's most important procurement
country thanks to the know-how it has acquired over the
Others India Vietnam
Turkey Germany Bangladesh years (e.g. in shoes) and the necessary infrastructure,
Italy Hong Kong China
although the shift towards other markets is likely to con-
Source: WTO tinue.
The highest growth rates in recent years have been Figure 4: Production Cost Index
achieved in China, but also in Bangladesh and Cambodia 70
(Figure 3). 60
50
Figure 3: Growth of Textile Exports 2005-12 40
200%
30
150% 20
10
100%
0
Bangladesh China - Low China - High India Turkey
50% 2005 2009 2013
Source: Kurt Salmon
0%
Minimum wage still too low to cover basic needs
-50%
In the two markets posting the highest export growth in
recent years, Bangladesh and Cambodia, the legal mini-
mum wage is only a fraction of what people need to sur-
vive, i.e. the living wage (Figure 5). If the standard work-
Source: WTO
ing week is not long enough to earn sufficient money to
cover a family’s basic living needs, this not only creates
The dynamic growth in Bangladesh is hardly surprising,
extra stress but also other problems associated with
given that local production costs have barely increased
poverty. These include malnutrition, poor access to
since 2005. In Turkey, production costs are as much as
healthcare, lack of social security, bad living conditions,
4-5 times higher than Bangladesh (Figure 4). In the con-
restricted access to education and limited participation in
ventional offshoring regions in South China have risen
the country’s cultural and political life.
sharply, which are not that much different now from a
number of Eastern European procurement markets such
as Romania. In addition to Cambodia, Vietnam and Bang-
ladesh, North Korea, Ethiopia and Mexico are at the top
5Figure 5: Living Costs and Minimum Wage sportswear brands – Hazardous chemicals found in World
600 120% Cup merchandise”) show that even well-known branded
Living Wage (EUR)
500 Min.Wage % of Living Wage 100% products do not offer any guarantee for environmentally
400 80%
friendly production and green products. For example,
Greenpeace found hormone-disrupting and potentially
300 60%
carcinogenic chemicals in numerous products, including
200 40% T-shirts and football boots. Not only are these worn by
100 20% consumers, but they also end up in the environment
0 0%
when discarded, having already contributed to water/air
pollution in the production phase.
In its Detox campaign launched two years ago, Green-
peace calls for fashion and sportswear companies to
Source: wageindicator.org embrace environmentally friendly production methods.
Numerous companies have already committed to making
These precarious living and working conditions repeatedly the necessary changes to their production processes.
fuel social unrest (such as demonstrations, strikes, acci- However, these have only been partly implemented to
dents, etc.), an increasingly common phenomenon re- date. Clear targets, a commitment to achieving them, and
cently (Figure 6). total transparency regarding the progress made are there-
fore essential.
Figure 6: Social Unrest in the Supply Chain
(Observation Period 2010-2013; over 130 data points) Positioning and strategies of apparel companies
To establish how effectively a company masters the chal-
lenges described, we examine on the one hand the com-
pany’s exposure to procurement markets with poor work-
ing conditions, and on the other hand how well it manag-
es these tasks in terms of strategy, targets and perfor-
mance. As expected, there is a positive correlation be-
tween these two factors (Figure 7).
Figure 7: Supply Chain (Social Aspects) –
Exposure vs. Management
10
9
Supply Chain Labor - Management Score
Cambodia Bangladesh India 8
Global Indonesia Sri Lanka 7
China Others 6
5
Source: SocGen Research
4
3
The other key criteria apart from the management of the
2
supply chain in the social dimension, include the pro-
1
curement of raw materials (especially cotton and leather),
0
product safety (including the use of hazardous substanc- 1 2 3 4 5 6 7 8 9 10
Supply Chain Labor - Exposure Score
es), and the carbon footprint of products (in the garment
Source: MSCI, J. Safra Sarasin
industry, about a quarter of CO2 is produced during raw
material production, and half during the garment manu-
A straight line drawn between the exposure/management
facturing process).
dots on the above chart should help to differentiate the
Studies recently published by Greenpeace (“A Little Story
companies based on the factors analysed. Companies
about the Monsters in your closet…” and “A Red Card for
below the red line are therefore not as well positioned to
6meet the future challenges, while those above the line Impacts of controversial aspects
have a lower risk profile. The companies with a lower in the supply chain on the enterprise value
than average sustainability score for the criterion of man- Ultimately the key question for investors is the extent to
agement are mainly retailers and luxury goods compa- which non-sustainable sourcing can have an impact on
nies. Producers of sports goods are positioned just below the enterprise value. Failure to adopt sustainable busi-
them. This could be partly attributable to the different ness practices may not have any negative impact on the
transparency in reporting, which in this context is an im- value of a company over the course of just a few years. In
portant confidence factor for investors. the long run, however, this company is not only likely to
The two leading sportswear companies Nike and Adidas be operating at a disadvantage (through damage to its
have comprehensive guidelines for the conduct of suppli- image and brand, for example), but also risks missing out
ers as well as appropriate management structures, while on a number of clear benefits, such as greater flexibility
Asics still has some catching up to do in these areas (on- and efficiency in production. Unfortunately such effects
ly social aspects are taken into consideration; Figure 8). are extremely difficult to measure, as numerous events –
in more or less random strengths and sequences – can
Figure 8: Management of affect the enterprise value and are virtually impossible to
Social Aspects in the Supply Chain eliminate in a reasonable way. However, it is possible to
analyse the effect of individual controversial events on a
Guidelines & Management
System for Supply Chain company’s share price. Examples of controversial events
include:
Implementation of
Guidelines
Accidents in producers’ factories
0 5 10 Failure to comply with standards (e.g. working
Asics Nike adidas hours)
Obvious sourcing from controversial countries
Source: J. Safra Sarasin, Company Data (e.g. cotton from Uzbekistan)
The overall assessment of all sustainability factors Figure 10: Controversial Events and Relative Share
deemed to be relevant shows that all three companies Price Performance (indexed) using the Example of a
qualify for our sustainable investment universe (Figure 9). Textile Company
Figure 9: Sustainability Matrix
Source: Datastream, MSCI, J. Safra Sarasin
In order to minimise the market/sector effect, the share
price of the three companies (Nike, Adidas and Asics)
was compared with that of the sector as a whole, and the
trends analysed on this basis (Figure 10).
Source: J. Safra Sarasin
737% of the 24 significant controversial events in total (for Figure 12: Breakdown of the Price of a T-Shirt
CHF % Price
all three companies over the past two years) triggered a
T-Shirt Retail Price 29.0
worse performance (downward trend) in their share price - Cost of Goods Sold 12.0
over the following 2-4 weeks compared with the sector - Selling, General & Administration Costs 10.0
= Profit 7.0 24%
index (MSCI Consumer Discretionary). In 38% of contro- T-Shirt Intermediary Price 12.0
versial events, there was no clear trend, while the share - Transportation Costs 2.2
- Selling, General & Administration Costs 1.2
price posted a positive performance versus the sector in- - Cost of Goods Sold 5.0
= Profit 3.6 30%
dex in a quarter of cases (Figure 11).
T-Shirt Production Price 5.0
Certain (negative) events can therefore definitely have a - Cost of Material 3.4
(negative) impact on the enterprise value, even if the lat- - Labor Costs 0.2
- Selling, General & Administration Costs 0.3
ter is also influenced by a variety of other factors. = Profit 1.1 22%
Source: Clean Clothes Campaign (2014), J. Safra Sarasin Assumptions
Figure 11: Short-Term Relative Share Price
Performance in Response to Controversial Events Although the wage costs do not seem very high (4% for T-
Uptrend Downtrend No Trend shirts; figure 12: grey bar) – there are numerous indirect
effects that can drive (overall) costs significantly higher:
Strikes in factories (in Spring 2014, for exam-
25%
ple, 40,000 workers employed by the world’s
38% biggest manufacturer of sport shoes, Yue Yuen
in China and Vietnam, went on strike – estimat-
ed costs: USD 58 million + USD 31 million paid
in backdated pension contributions)
37% Higher staff turnover rates and subsequently in-
consistent quality in production
Lower productivity due to lack of staff motivation
Source: MSCI, J. Safra Sarasin
Damage to the brand (e.g. due to unacceptable
working conditions in production or avoidable
If there is a sudden jump in the number of controversial
accidents, as in Bangladesh).
events reported in a country - a signal for non-sustainable
business practices in the supply chain – it can often re-
The Rana Plaza catastrophe in Bangladesh resulted in
sult in changes and remedial measures. In order to un-
consequential costs of around USD 4 billion (Figure 13).
derstand the consequences of such measures, it is worth
taking a look at the financial statements. A breakdown of
Figure 13: Indirect Costs of a Non-Sustainable Procure-
the sale price of a T-Shirt (Figure 12) shows that labour
ment Policy in Bangladesh
costs only make up a very small proportion of overall pro- Cost (mio USD)
duction costs. Even a doubling of labour costs could be Accord on Fire and Building Safety in Bangladesh
200
Alliance for Bangladesh Worker Safety
offset by possible efficiency improvements or by raising Rana Plaza - Compensation for Workers 40
the selling price. Factory Rebuild & Repair Costs
(3% of factories need to be closed; approx. USD 1050
A reduction in transport costs (e.g. by relocating produc- 0.5 mio repair cost per factory)
tion closer to end markets) would significantly improve Increase of Minimum Wages
2710
(from 3'000 Taka to 5'300 Taka)
flexibility in the area of labour costs. The cost of materi-
Total 4000
als is also very important. However, these are usually
borne by the company placing the contract (intermediary; Source: PRI, J. Safra Sarasin
company owning the brand). The biggest share of a prod-
uct’s final sales price goes to the retailer, who does Some 150 organisations make an annual contribution to
however provide the sales infrastructure and in some the “Accord on Fire and Building Safety in Bangladesh“.
cases sales promotional measures as well. There is also the Alliance for Bangladesh Worker Safety,
8which is partly funded by credit. The Rana Plaza Trust Social & environmental profit and loss account
Fund has contributed around USD 35 million. In addition, The idea of a social & environmental profit and loss
repair and maintenance costs amount to USD 1 billion. account is not new, but its compilation is a relatively
The biggest amount comes from an increase in the mini- complex task. What is the underlying idea? – Tradi-
mum wage, however. But the minimum wage, at just un- tional financial statements do not paint the full pic-
der USD 70 per month, is still well short of the living ture. In particular they tend to ignore inherent hidden
wage, which is more than twice as high. The estimated costs that only emerge over the longer term in re-
total costs of approximately USD 4 billion equate to sponse to stricter environmental regulation, sharp
roughly 18% of Bangladesh’s annual textile exports. price hikes for resources in increasingly short supply,
and controversial events as described previously.
The search for cheap resources continues By publishing an environmental profit and loss account
In recent years there has been a significant change in the in 2010, Puma took the first step towards quantifying
challenges that the supply chain present to textile and the ecological impacts of its business activities across
clothing companies. While the main criterion for procure- the entire supply chain. Factors such as greenhouse
ment in the past was to achieve the best possible gas emissions, water consumption, waste volumes
cost/benefit ratio, companies nowadays have to satisfy and land usage are converted into monetary values.
many different demands. Apart from the need for a faster Here it is not just the absolute figures that are inter-
pace of innovation and shorter product lead times, cus- esting, but the fact that 94% of the total ecological
tomers are placing increasing demands on companies to impacts are attributable to suppliers. Apart from
comply with environmental and social standards in their greater transparency, such a comprehensive profit and
production processes. Responsibility for this extends well loss account also provides better risk management
beyond the company’s own scope of control and far down and encourages companies to reduce the negative im-
the supply chain. Here the depth and complexity of the pacts and thereby save costs in the process.
sourcing structure makes it difficult to monitor the supply Although it will still probably take some time for the
chain in an efficient and comprehensive way. Apart from idea of a social and environmental profit and loss ac-
this, there are a number of other interests affecting the count to catch on, pressure will gradually increase on
procurement environment: governments in the countries companies (and their shareholders) over the coming
where the goods are produced are generally not very in- years to expand their horizon.
terested in allowing labour costs to rise significantly, as
this would undermine competitiveness - which would in labour and production costs, but also takes into account
turn have significant economic consequences. this would other elements. These include involving suppliers in the
undermine competitiveness - which would in turn have procurement process and giving them the support they
significant economic consequences. On the other hand, need to comply with work and safety standards (e.g. train-
companies are naturally keen to avoid strikes. Given this ing or “capacity building”, infrastructure investments,
backdrop, the trend towards outsourcing production to in- etc.). This is the only way of ensuring that standards filter
creasingly low-cost countries/regions seems likely to con- through to the very bottom of the supply chain, i.e. down
tinue. This inevitably throws up some of the widely re- to tiers 2, 3 and 4. In addition, this allows supplier audit
ported problems associated with such a development or costs to be further reduced without compromising quality.
supply chain. On the other hand, pressure from various
sides (investors, NGOs, media etc.) is likely to increase Philipp Mettler, CFA
on companies to make their supply chain as sustainable Senior Sustainable Investment Analyst
as possible. +41 58 317 41 24
Against this backdrop, companies can certainly expect philipp.mettler@jsafrasarasin.com
greater cost pressure – both direct and indirect. The most
successful companies are likely to be those with suffi- Makiko Ashida
cient pricing power (thanks to their brands or innovation Senior Sustainable Investment Analyst
powers, among other things) and/or those who manage +41 58 317 44 70
to establish a process that is not only based upon low makiko.ashida@jsafrasarasin.com
910
Disclaimer

Trademark information
J. Safra Sarasin (Logo), Sarasin Sustainable Investment and Sarasin Sustainability-Matrix are trademarks of the J. Saf-
ra Sarasin Group and are registered in a number of jurisdictions.

Important notice
This publication has been prepared by Bank J. Safra Sarasin Ltd, Switzerland, (hereafter “Bank”) for information pur-
poses only. This publication contains selected information and does not purport to be complete. This document is
based on publicly available information and data (“the Information”) believed to be correct, accurate and complete.
The Bank has not verified and is unable to guarantee the accuracy and completeness of the Information contained
herein. Possible errors or incompleteness of the Information do not constitute legal grounds (contractual or tacit) for
liability, either with regard to direct, indirect or consequential damages. In particular, neither the Bank nor its share-
holders and employees shall be liable for the opinions, estimations and strategies contained in this document. The
opinions expressed in this document, along with the quoted figures, data and forecasts, are subject to change without
notice. A positive historical performance or simulation does not constitute any guarantee for a positive performance in
the future. Discrepancies may emerge in respect of our own financial research or other publications of the J. Safra
Sarasin Group relating to the same financial instruments or issuers. It is impossible to rule out the possibility that a
business connection may exist between a company which is the subject of research and a company within the J. Safra
Sarasin Group, from which a potential conflict of interest could result.

This document does not constitute either a request or offer, solicitation or recommendation to buy or sell investments
or other specific financial instruments, products or services. It should not be considered as a substitute for individual
advice and risk disclosure by a qualified financial, legal or tax advisor.

This document is intended for persons working in countries where the J. Safra Sarasin Group has a business pres-
ence. The Bank does not accept any liability whatsoever for losses arising from the use of the Information (or parts
thereof) contained in this document.

© Copyright Bank J. Safra Sarasin Ltd. All rights reserved.

Bank J. Safra Sarasin Ltd
Elisabethenstrasse 62
P.O.Box
CH - 4002 Basel
Switzerland
Tel + 41 (0)58 317 44 44
Fax + 41 (0)58 317 44 00
www.jsafrasarasin.com

Printed on 100% recycled paper
You can also read