COVID 19: a simple statistical model for predicting intensive care unit load in exponential phases of the disease - Nature
←
→
Page content transcription
If your browser does not render page correctly, please read the page content below
www.nature.com/scientificreports
OPEN COVID‑19: a simple statistical
model for predicting intensive care
unit load in exponential phases
of the disease
Matthias Ritter 1*, Derek V. M. Ott2, Friedemann Paul3,4, John‑Dylan Haynes3,5 &
Kerstin Ritter 3,5,6*
One major bottleneck in the ongoing COVID-19 pandemic is the limited number of critical care beds.
Due to the dynamic development of infections and the time lag between when patients are infected
and when a proportion of them enters an intensive care unit (ICU), the need for future intensive care
can easily be underestimated. To infer future ICU load from reported infections, we suggest a simple
statistical model that (1) accounts for time lags and (2) allows for making predictions depending
on different future growth of infections. We have evaluated our model for three heavily affected
regions in Europe, namely Berlin (Germany), Lombardy (Italy), and Madrid (Spain). Before extensive
containment measures made an impact, we first estimate the region-specific model parameters,
namely ICU rate, time lag between infection, and ICU admission as well as length of stay in ICU.
Whereas for Berlin, an ICU rate of 6%, a time lag of 6 days, and a stay of 12 days in ICU provide the
best fit of the data, for Lombardy and Madrid the ICU rate was higher (18% and 15%) and the time
lag (0 and 3 days) and the stay in ICU (3 and 8 days) shorter. The region-specific models are then used
to predict future ICU load assuming either a continued exponential phase with varying growth rates
(0–15%) or linear growth. By keeping the growth rates flexible, this model allows for taking into
account the potential effect of diverse containment measures. Thus, the model can help to predict
a potential exceedance of ICU capacity depending on future growth. A sensitivity analysis for an
extended time period shows that the proposed model is particularly useful for exponential phases of
the disease.
The number of reported COVID-19 cases worldwide is steadily increasing and has almost reached 100 million
in January 20211. Most infections have been reported in the U.S. (almost 25 million) but also European countries
including France, Italy, UK, Spain, and Germany have been strongly affected. Even though these numbers depend
on the number of conducted tests, they demonstrate the huge spread and severity of the SARS-CoV-2 pandemic.
It lies in the nature of exponential growth that it starts slowly and bears the risk that the future development
is underestimated, as shown in multiple psychological s tudies2. In the SARS-CoV-2 pandemic, this leads to the
risk of underestimating case fatality r ates3,4 but also the risk that the health system might be overburdened due to
a too high number of patients in intensive care units (ICUs)5. Although it is well-known that a certain number of
COVID-19 patients needs intensive care, especially elderly people and people with pre-existing c onditions6, the
exponential dynamics of infections along with the time lag between the number of reported infections and the
number of ICU patients can lead to the false impression that the amount of ICU patients will be u nproblematic3,7.
Due to the lag and ICU durations of one to several weeks, even when the exponential growth of infections is
stopped, it takes a while until the pressure on ICUs is r educed8–10.
1
Faculty of Life Sciences, Humboldt-Universität zu Berlin, Unter den Linden 6, 10099 Berlin,
Germany. 2Neurology Clinic with Stroke Unit and Early Rehabilitation, Unfallkrankenhaus Berlin, 12683 Berlin,
Germany. 3Charité-Universitätsmedizin Berlin and Berlin Institute of Health (BIH), Charitéplatz 1, 10117 Berlin,
Germany. 4Department of Neurology, Experimental and Clinical Research Center and Max Delbrueck Center for
Molecular Medicine, Charitéplatz 1, 10117 Berlin, Germany. 5Berlin Center for Advanced Neuroimaging, Bernstein
Center for Computational Neuroscience, Charitéplatz 1, 10117 Berlin, Germany. 6Department of Psychiatry and
Psychotherapy, Charitéplatz 1, 10117 Berlin, Germany. *email: matthias.ritter@hu-berlin.de; kerstin.ritter@
charite.de
Scientific Reports | (2021) 11:5018 | https://doi.org/10.1038/s41598-021-83853-2 1
Vol.:(0123456789)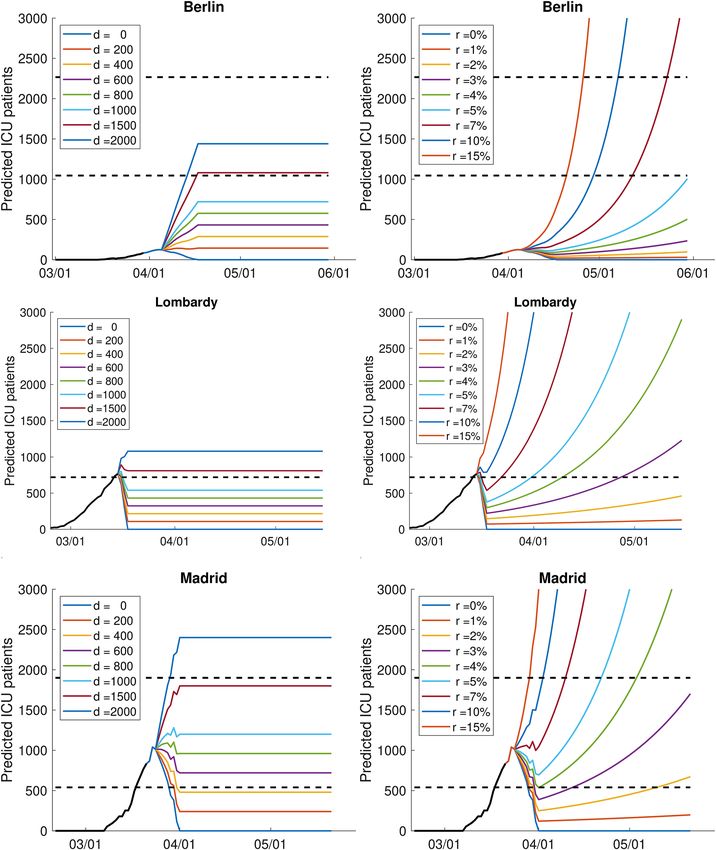
www.nature.com/scientificreports/
In several regions including Lombardy (Italy) and Madrid (Spain), the need for ICUs surpassed the available
capacity and not all COVID-19 patients who needed intensive care could be treated5,11,12. To slow down the
spread of the disease and to avoid a triage, several countries, including Germany, Italy, and Spain, decided to
apply containment measures—ranging from temporary closures of schools and kindergartens to travel restric-
tions, compulsory mask wearing, and curfew. Those measures, however, disrupt economic activity and lead to
the risk of a recession. Thus, policymakers are confronted with the difficulty of making decisions that severely
affect the healthcare system, the global economy as well as the everyday life of many individuals while facing
a large amount of uncertainty within the SARS-CoV-2 pandemic (e.g., the time until new treatments or vac-
cinations have been developed and are available at a large scale). Since one major bottleneck for the healthcare
system is the ICU capacity, risk models are needed that allow policymakers to estimate the future ICU load to
take appropriate measures.
So far, most forecast models for ICU load fit exponential growth (e.g., using ordinary least-squares in the
log-space) to either the cumulated number of positive COVID-19 patients or directly to the number of ICU
patients5,13,14. For different regions in the UK, regional ICU capacities have been predicted using a Monte Carlo
simulation13. Those models, however, assume that the initial exponential growth will hold over the forecast
horizon (usually 14 days) and do not account for the alleviation of growth rates, e.g., due to containment meas-
ures. Moreover, these models do not exploit the underlying relationship between reported infections and ICU
admissions, e.g., in terms of ICU rate.
In this study, we suggest a simple and transparent statistical model that is able to account for (1) the time
lag between reported infection and ICU admission and (2) different future growth (linear or exponential). This
allows us in particular to predict the time point when the ICU load exceeds a given capacity. We address the
following research questions: Can the future number of ICU patients be predicted from the number of reported
infections? And how does the growth rate influence the time when ICU capacity is expected to be overburdened?
In our main analysis, we apply the model to public data sets for three regions, namely Berlin (Germany),
Lombardy (Italy), and Madrid (Spain). All three regions have been strongly affected by the SARS-CoV-2 pan-
demic and data on ICU patients as well as the initial number of ICU beds were publicly available. Based on
the total number of COVID-19 patients and the number of COVID-19 patients in ICUs, we first estimate the
parameters of the model (i.e., ICU rate, length of stay in ICU, and time lag between the positive testing and the
ICU admission). We restrict here the data to the first wave of infections and the time period before extensive
containment measures made an impact. And second, we predict for a time horizon of 2 months the number
of COVID-19 patients who need intensive care when assuming linear or exponential growth of the number of
reported infections. By incorporating the dependency between the total number of COVID-19 patients and
COVID-19 patients in ICUs as well as holding growth rates flexible, our model extends previous models and
accounts for differential effects of potential containment measures. The predictions of our model in combination
with epidemiological estimates regarding disease dynamics can be used in turn to predict future ICU load and
to potentially infer when the ICU load will exceed a given capacity. In an additional analysis, we investigate the
sensitivity of our proposed model with respect to different phases in the pandemic. For this, we extend the time
series of all regions until December 2020 and estimate the parameters separately for each month.
Method
In this section, we introduce the theoretical model for predicting the number of ICU patients based on the
number of reported infections. Denote PTt the total number of positively tested people until day t in a particu-
lar region. PTt = PTt − PTt−1 is then the number of newly positively tested people only on day t. A certain
share αl of the newly positively tested people needs intensive care l days later with lag l, l = 1, . . . , L, and some
maximum lag L denoting the maximal duration between a positive test and ICU admission. Moreover, patients
remain in intensive care for a longer time, which means that ICU admissions of the previous days also have to
be considered. In early stages of a disease, the exact distribution of the lengths of ICU stays might not be avail-
able and for simplification, the duration can be modelled as constant for all patients. We denote K the number
of days patients remain in an ICU.
The number of ICU patients at time t can then be predicted in dependence of K and a vector αl with
l = 1, . . . , L , which contains the probabilities that positively tested persons have transited to ICU after l days,
in the following way:
K
L
t (K, αl ) =
IC αl �PTt−l−k+1 (1)
k=1 l=1
In case only the overall share of reported infected people needing
intensive care is available (without dif-
ferentiating between the lags), the so-called ICU rate α with α = Ll=1 αl , this can be used in combination with
a specific lag l ∗. Eq. (1) then becomes:
K
t (K, α, l ∗ ) =
IC α�PTt−l∗ −k+1 (2)
k=1
Since Eq. (2) corresponds to the data situation in our empirical application, the subsequent considerations
will be based on this equation. They can, however, analogously be applied to Eq. (1).
Scientific Reports | (2021) 11:5018 | https://doi.org/10.1038/s41598-021-83853-2 2
Vol:.(1234567890)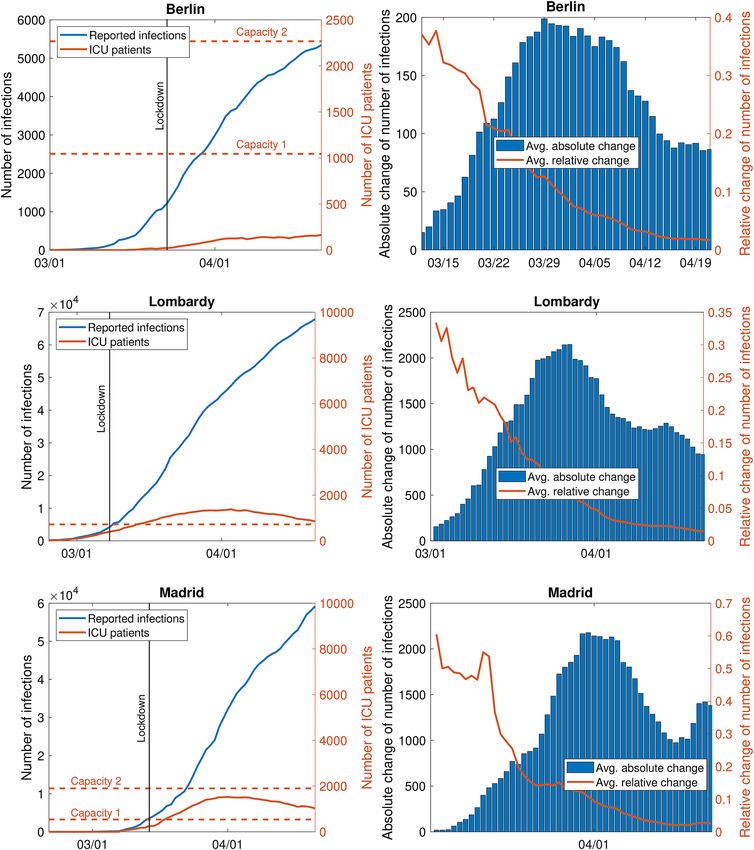
www.nature.com/scientificreports/
To evaluate the performance of the models and to derive the parameters ICU rate α, the length of ICU stay
K and the lag length l ∗ that best explain the data, the squared correlation coefficient and the root mean squared
prediction error (RMSE) for each model can be calculated by comparing the predicted value IC t (K, α, l ∗ ) to the
observed value IC t . The RMSE is defined as
T
RMSE(K, α, l ∗ ) =
(ICt − IC t (K, α, l ∗ ))2 (3)
t=1
with T denoting the number of days with observations available. The model with the lowest RMSE is supposed to
fit best to the observed data. Since the RMSE depends on the level of the variable to be predicted, we also provide
the normalized RMSE (nRMSE) by dividing the RMSE by the variable mean. This results in a percentage error
and facilitates comparing the results for different regions.
Containment measures and other factors including testing capacity and the age distribution of infected people
can influence Eqs. (1)–(3) in several ways. For instance, while successful containment decreases the number of
positively tested people PTt , an extended testing capacity in turn increases PTt . Moreover, containment measures
and testing capacity can lead to structural breaks in the parameter estimates. For example, a better protection of
people with pre-existing conditions or elderly people as well as a higher testing capacity could lead to a reduced
ICU rate α due to an increased share of mild cases. In addition, the testing capacity and resulting timing of tests
influence the time lag l, and the length of stay in ICU depends on the occupancy rates in the hospitals, which in
turn can be influenced by successful containment.
After the parameters K, a, and l ∗ are estimated (based on prior knowledge or data), they can be used to
predict the future development by assuming either linear growth with slope d for the number of infections, i.e.,
PTt+1 = PTt + d , or exponential growth with rate r for the number of infections, i.e., PTt+1 = (1 + r)PTt . By
allowing flexible linear and exponential growth, the model indirectly accounts for the effect of different con-
tainment measures. The predicted number of ICU patients can then be compared with different levels of ICU
capacities. Moreover, dates when a given capacity is expected to be exceeded can be calculated.
Empirical application for early phase
We now apply the above introduced theoretical model to data of the initial phase (March/April 2020) of the
SARS-CoV-2 pandemic for Berlin (Germany), Lombardy (Italy), and Madrid (Spain). In a first step, we deter-
mine the parameters K, a, and l ∗ that best explain the data in each region. We then use this model to predict the
number of ICU patients for a fixed time horizon of 2 months assuming further linear or exponential growth.
Please note that the model is sensitive to the estimated parameters and the underlying data. In particular, we
demonstrate here the sensitivity of the development regarding future growth and different time periods within
the SARS-CoV-2 pandemic.
Data. Berlin (Germany). Berlin (Germany) is one of the 16 federal states of Germany and is densely popu-
lated with currently about 3.8 million inhabitants15. For each day between March 1 and April 21, we retrieved
the number of reported COVID-19 patients and the number of COVID-19 patients in ICUs for Berlin from the
Berlin Senate Department for Health, Nursing and Equal Opportunities (https://www.berlin.de/sen/gpg/service/
presse/2020/; Fig. 1, top left). The total number of COVID-19 infections increased from one on March 1, 2020,
to 5341 on April 21, 2020. The first patients in intensive care (three) were reported on March 16, 2020, and this
number increased to 164 on April 21, 2020. Figure 1 (top right) depicts the (absolute and relative) daily change
in the number of reported infections over the previous 7 days since the first day more than 100 cases were re-
ported (March 12, 2020, 118 cases). This averaging rules out weekend effects when some numbers are reported
with delay.
On March 23, 2020, extensive containment measures including school closure and contact restriction were
erlin16. To make the three regions comparable and to ensure a greater homogeneity of the data,
established for B
we restrict our analysis to the period before containment measures make an impact. For Berlin, we therefore
include only data from March 1, 2020, to March 30, 2020. The end date corresponds to 7 days after the lockdown.
The overall daily growth rate for this period (with a minimum of 100 cases) is 19% , but it decreased to 11% in
the last week.
The deployment of ICU beds is a highly dynamic process. According to the health senator of Berlin, Dilek
Kalayci, the number of ICU beds in Berlin was 1045 in March 2020 and has been planned to increase to 2267
pril17,18. Based on this, we define the following capacity limits for Berlin: (1) current maximal
until the end of A
capacity (1045 ICU beds) and (2) extended capacity by the end of April (2267 ICU beds).
Lombardy (Italy). Lombardy is one of the 20 administrative divisions of Italy and has about 10 million
inhabitants19. For each day between February 24, 2020, and April 21, 2020, we retrieved the number of reported
COVID-19 patients and the number of COVID-19 patients in ICUs for Lombardy from the Presidenza del
Consiglio dei Ministri—Dipartimento della Protezione Civile (https://github.com/pcm-dpc/COVID-19; Fig. 1,
middle left). The total number of COVID-19 infections increased from 166 on February 24, 2020, to 67,925 on
April 21, 2020. The number of ICU patients increased from 19 on February 24, 2020, to 1381 on April 3, 2020.
Since then, it decreased to 851 on April 21, 2020. Figure 1 (middle right) depicts the daily (absolute and relative)
change in the number of reported infections over the previous 7 days. On March 8, 2020, Italian Prime Minister
Giuseppe Conte put the whole Lombardy under quarantine20. Assuming that at least 7 days are needed before
the quarantine makes an impact, we restrict our analysis to data from February 24, 2020 to March 15, 2020. The
Scientific Reports | (2021) 11:5018 | https://doi.org/10.1038/s41598-021-83853-2 3
Vol.:(0123456789)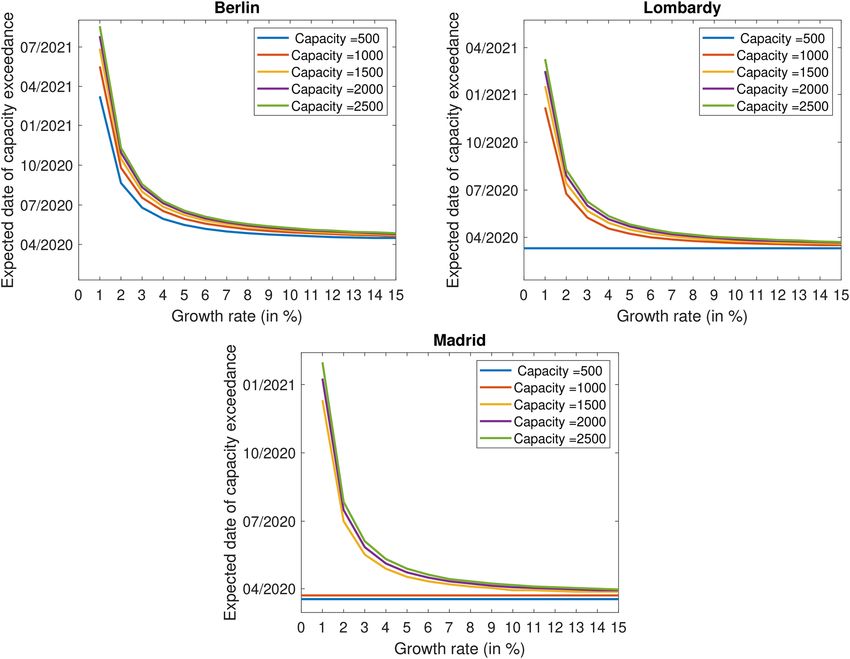
www.nature.com/scientificreports/
Figure 1. Number of reported infections and intensive care patients (left) and absolute and relative daily change
of the number of infections (right, averaged over the last 7 days, since 100 infections) in Berlin, Lombardy, and
Madrid; based on data from the Berlin Senate Department of Health, Nursing and Equal Opportunities (Berlin),
the Presidenza del Consiglio dei Ministri—Dipartimento della Protezione Civile (Lombardy), and Datadista
(Madrid).
overall daily growth rate for this period (with a minimum of 100 cases) is 23% and it decreased to 21% in the
week between March 8, 2020, and March 15, 2020.
Before the SARS-CoV-2 pandemic, the ICU capacities in Lombardy were estimated to be 720 beds5, however,
some hospitals have increased their number of ICU beds by the factor of 4–5 during the pandemic.
Madrid (Spain). Madrid is one of the 17 autonomous communities in Spain and has about 6.6 million
inhabitants21. For each day between February 25, 2020, and April 21, 2020, we retrieved the number of reported
COVID-19 patients and the number of COVID-19 patients in ICUs for Lombardy from Datadista (https://
github.com/datadista/datasets; Fig. 1, bottom left). The total number of COVID-19 infections increased from
two on February 25, 2020, to 59,199 on April 21, 2020. The number of ICU patients increased from 53 on March
3, 2020, to 1528 on April 1, 2020. Since then, it decreased to 1024 on April 21, 2020. Figure 1 (bottom right)
depicts the daily (absolute and relative) change in the number of reported infections over the previous 7 days.
Scientific Reports | (2021) 11:5018 | https://doi.org/10.1038/s41598-021-83853-2 4
Vol:.(1234567890)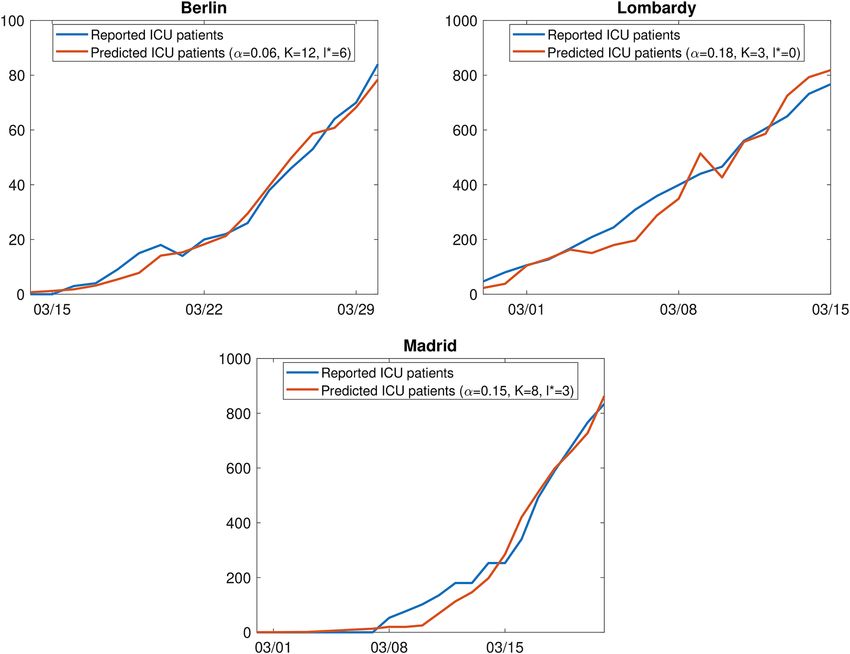
www.nature.com/scientificreports/
Region T α K l∗ RMSE (nRMSE) ρ2
Berlin 17 0.06 12 6 3.37 (20.82%) 0.98
Lombardy 17 0.18 3 0 54.01 (17.78%) 0.97
Madrid 22 0.15 8 3 39.50 (24.82%) 0.98
Table 1. Parameters for the best model fit separately for Berlin, Lombardy, and Madrid. T, number of days for
which the model was fitted; α, ICU rate; K, stay in ICU; l ∗, time lag between positive testing and entering the
ICU; (n)RMSE, (normalized) root mean squared error; ρ 2, squared correlation coefficient.
Figure 2. Best model fit for the number of ICU patients with ICU rate α, stay in ICU K and time lag l ∗ between
positive testing and entering ICU, separately for Berlin, Lombardy, and Madrid.
On March 14, 2020, the Prime Minister of Spain Pedro Sánchez declared a nationwide State of Alarm and a
national lockdown was i mposed22. Also for Madrid, we restrict our analysis to data until 7 days after the lock-
down. Hence, our data set ranges from February 25, 2020, to March 21, 2020. The overall daily growth rate for
this period (with a minimum of 100 cases) is 31% and it increased to 54% in the week between March 7, 2020,
and March 14, 2020.
An ICU capacity of 540 beds has been reported before the SARS-CoV-2 pandemic, during the pandemic this
number has been t ripled23,24.
Results. We estimated the parameters of the model separately for Berlin, Lombardy, and Madrid (see Table 1).
For Berlin, the best fit was found for an ICU rate α of 6%, a time lag of 6 days, and a stay of 12 days in ICU. For
Lombardy and Madrid, in contrast, a better fit was found for larger ICU rates (18% and 15%), shorter ICU stays
(3 and 8 days), and a shorter time lag (0 and 3 days). The RMSE for Berlin is considerably lower than for Lom-
bardy and Madrid, which can be explained by the lower number of ICU patients. If the RMSE is normalized by
the average number of ICU patients in the considered period, it corresponds to 18% (Lombardy), 21% (Berlin),
and 25% (Madrid). The squared correlation coefficient lies between 0.97 and 0.98 for all three regions. In Fig. 2,
we compare the reported ICU patients with the predicted ICU patients based on the estimated parameters.
Based on the models with the estimated parameters, we now predict the future development of the number
of ICU patients (see Fig. 3). Here, we will make a simplified assumption that the growth can be approximated
Scientific Reports | (2021) 11:5018 | https://doi.org/10.1038/s41598-021-83853-2 5
Vol.:(0123456789)www.nature.com/scientificreports/
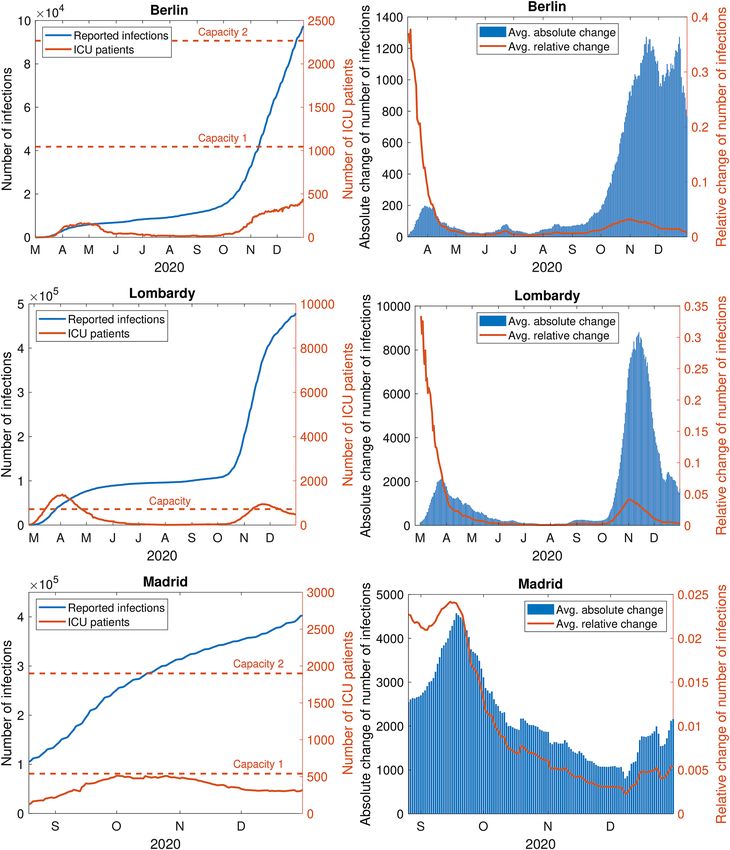
Figure 3. Predicted number of ICU patients assuming different linear (left) and exponential growth (right),
separately for Berlin, Lombardy and Madrid. The black line corresponds to the true observations until seven
days after the lockdown. The dashed black line indicates the estimates of capacity.
as either linear or exponential and hence demonstrate the effect of lower growth induced by containment meas-
ures. We show the sensitivity of the results for linear growth with the slope d between 0 and 2, 000 as well as
exponential growth rates between 0 and 15%. A growth rate of 0% means that from one day to another, no more
new infections are reported, which is an unrealistic extreme case. The other extreme, 15%, corresponds to a
duplication of reported infections every 5 days. Please note that the daily growth rate in the last week before
the strong containment measures came into force was 10% for Berlin, 23% for Lombardy, and 54% for Madrid.
In Fig. 3, the predicted number of ICU patients is additionally compared with the capacity limits introduced in
the data section. A linear growth in the number of infections leads in the long-run to a constant number of ICU
patients, which corresponds to α · d · K . This means, a share of α of the daily new infections d needs intensive
care for K days. Regarding exponential growth, our estimated parameters show that for Berlin only growth rates
between 0 and 4% guarantee that the number of patients at the end of May remains below the current maximal
capacity, a rate of up to 5% guarantees to stay below the extended capacity by the end of May (but exceeds the
Scientific Reports | (2021) 11:5018 | https://doi.org/10.1038/s41598-021-83853-2 6
Vol:.(1234567890)www.nature.com/scientificreports/
Figure 4. Expected dates of capacity exceedance for different growth rates and exemplary capacities, separately
for Berlin, Lombardy, and Madrid.
capacity in June). For Lombardy and Madrid, it can be seen that the capacity was already exceeded before the
containment measures came into force.
Figure 4 depicts the relation between different growth rates (0–15%) and the dates of capacity exceedance for
exemplary capacities of 500, 1000, 1500, 2000, and 2500 for Berlin, Lombardy, and Madrid. It demonstrates how
the approach can be applied also for different phases of exponential growth or capacity extensions.
Sensitivity analysis for an extended time period
Extended data until December 2020. To analyze the sensitivity of the model parameters, we extend the
time series for all three regions until December 2020. While for Lombardy and Berlin, the same data as for the
early phase are available until December 2020, we need to adapt the data for Madrid since consistent data were
only available for the time period between August and December 2020. After the beginning of the pandemic in
March/April 2020 and a decline of reported infections and ICU patients afterwards due to containment meas-
ures, all three regions experienced a second wave starting in September/October 2020 with strongly increasing
numbers of reported infections and ICU patients (Fig. 5 in the Appendix).
Results of the sensitivity analysis. Table 2 depicts monthly estimates of the parameters and the good-
ness of fit if separate models are estimated for each calendar month from March (if available) to December 2020.
It can be seen that the parameters vary over time, indicating structural breaks in the course of the pandemic. For
example, the ICU rate α strongly decreases after the first wave, which can be explained by larger testing capacities
and/or a better protection of people with pre-existing conditions or elderly people. In Berlin and Lombardy, the
ICU rate seems to increase again with the second wave. Data for Berlin demonstrate that the age distribution of
the reported infections changed significantly: Around 20% of reported infections in April and December belong
to the group of 70 years old or older people, whereas this number goes down to 2% in August (own calculations
based on data from LAGeSo Berlin25). Interestingly, the model fits are best in tipping points of the disease where
the rates start to grow exponentially. For Berlin and Lombardy, the model fits best in March (nRMSE = 18%,
ρ 2 = 0.99 for Berlin, nRMSE = 12%, ρ 2 = 0.97 for Lombardy) and October (nRMSE = 15%, ρ 2 = 0.93 for
Berlin, nRMSE = 13%, ρ 2 = 0.99 for Lombardy), but the nRMSE goes up to 50% (Berlin) and 40% (Lombardy)
in between. For Madrid, where we only have consistent data after the early phase, the lowest nRMSE has been
found for September (nRMSE = 19.15%, ρ 2 = 0.78). These results highlight that the model is in particular suit-
able for exponential phases of the disease.
Scientific Reports | (2021) 11:5018 | https://doi.org/10.1038/s41598-021-83853-2 7
Vol.:(0123456789)www.nature.com/scientificreports/
Mar Apr May Jun Jul Aug Sep Oct Nov Dec
Berlin
α 0.06 0.10 0.20 0.18 0.11 0.04 0.03 0.04 0.05 0.05
K 12 14 10 4 6 6 6 6 5 7
l∗ 6 0 8 0 9 4 6 8 4 7
RMSE 3.34 45.43 48.76 18.26 6.95 5.21 3.32 11.49 40.88 55.34
nRMSE (%) 17.93 31.97 49.59 45.19 31.42 32.19 19.93 15.04 15.13 15.49
ρ2 0.99 0.04 0.08 0.00 0.14 0.00 0.73 0.93 0.72 0.53
Lombardy
α 0.12 0.20 0.17 0.20 0.10 0.03 0.02 0.01 0.02 0.06
K 5 4 3 2 3 6 7 7 5 4
l∗ 1 6 9 5 6 9 5 2 9 4
RMSE 96.73 228.30 88.40 33.66 7.44 2.36 6.20 16.96 121.08 157.02
nRMSE (%) 12.23 22.28 28.60 40.78 30.09 18.18 21.06 13.00 15.55 24.02
ρ2 0.97 0.34 0.54 0.22 0.41 0.67 0.20 0.99 0.80 0.26
Madrid
α – – – – – – 0.02 0.04 0.05 0.04
K – – – – – – 6 6 6 5
l∗ – – – – – – 7 1 5 7
RMSE – – – – – – 70.28 96.76 92.17 112.43
nRMSE (%) – – – – – – 19.15 19.62 22.25 36.13
ρ2 – – – – – – 0.78 0.21 0.04 0.18
Table 2. Monthly estimates of ICU rate α, stay in ICU K, time lag between positive testing and entering the
ICU l∗, as well as model fit in terms of RMSE, normalized RMSE (nRMSE), and squared correlation ρ 2 for the
extended datasets.
Discussion
In this study, we provide a simple, comprehensible, and transparent model that allows for predicting ICU load
assuming linear or different exponential growth of the number of infections depending on applied containment
measures. We evaluated this model for Berlin, Lombardy, and Madrid, where we had access to the number of
reported COVID-19 infections and ICU patients with COVID-19. Since the outbreaks are highly regional, we
did not apply this model to larger areas such as whole countries. Based on data before extensive containment
measures led to structural breaks, we first estimated the parameters ICU rate, length of stay in ICU, and time lag.
For Berlin, an ICU rate of 6% was estimated which is close to an estimate of 5% in other s tudies26,27 and expec-
tations of intensive care physicians in B erlin28. An ICU rate of 5% has been reported based on data for 72,312
cases in China29. For Lombardy and Madrid, in contrast, a much higher ICU rate of 18% and 15%, respectively,
resulted in the best model fit. This is in relative accordance with Grasselli et al.5 who reported an ICU rate of 16%
for Lombardy in the first 2 weeks of the SARS-CoV-2 pandemic. In the sensitivity analysis, we have shown for
Berlin and Lombardy that the ICU rate decreases to below 5% in the later months August to October/November
probably due to a less restrictive testing scenario as in the b eginning22,30,31. In similar models, relying only on
exponential growth of intensive care patients, ICU rates of 9–11% have been a ssumed14.
Regarding the length of stay in ICU (until recovery or death), the best model fit resulted in 12 days for Berlin,
3 days for Lombardy, and 8 days for Madrid. Whereas for Berlin and Madrid the numbers seems to be reason-
able, a stay of 3 days in Lombardy seems to be rather short. We think that this can be explained by the excessive
demands on the health care system resulting in higher mortality rates and thus in a shorter length of stay in ICU.
Based on data from China, other forecast models assumed an average stay of 8–10 days13,30. For Lombardy, a
median length of ICU stay of 9 days has been reported for the early p hase32. Also for other regions in Italy and
USA, longer ICU stays (about 15 days for ICU patients who remain alive and about 10–12 days for patients who
die after ICU treatment) have been f ound8,10. In New York, COVID-19 patients typically need ICU care with
ventilation for 11–21 days, some patients stay in ICU for 30 d ays9.
The time lag between positive testing and ICU admission was estimated to be 6 for Berlin, 0 for Lombardy,
and 3 for Madrid. The time lag is known to be highly variable because COVID-19 patients may be tested at dif-
ferent time points due to different disease courses as well as regulatory and organizational issues (e.g., capacity
of test units or eligibility to get a test). Thus, the low numbers for Lombardy and Madrid can be explained by the
limited testing capacity in those regions, where tests are mainly administered for patients with severe COVID-19
symptoms22,31. In addition, the extended time period analysis for Lombardy (see Fig. 5) revealed that the time
lag seems to reflect the extent of demands on the ICU capacity by providing a time lag between 5 and 9 in times
when the pressure was lower.
We then used the models with the estimated parameters to predict the number of ICU patients for a fixed
time horizon of 2 months. By assuming linear or exponential growth of different levels and different ICU capaci-
ties, we evaluated different scenarios simulating the effect of containment measures and show the sensitivity
Scientific Reports | (2021) 11:5018 | https://doi.org/10.1038/s41598-021-83853-2 8
Vol:.(1234567890)www.nature.com/scientificreports/
towards the growth rate in the exponential phase of COVID-19. The further the expected dates of a capacity
exceedance can be shifted into the future, the higher the likelihood that new treatments or a vaccination are
available or that a larger share of the population has become immune against COVID-19, which would further
lower the growth rate. The sensitivity analysis for the extended time series revealed that our model performs best
in phases of the disease when the growth is exponential (first wave, second wave etc.) and might get inaccurate
in non-exponential phases.
To account for the dynamic situation of the deployment of ICU beds, we compare the predicted number of
ICU patients to different estimates of ICU capacity (if available). For simplicity, we assumed that all those beds
are available for only COVID-19 patients and thus did not account for different utilization rates which might lead
to an earlier capacity exceedance in practice. Additionally, we did not account for shortage in highly-qualified
medical personnel. Already prior to the COVID-19 associated increase in capacities, it had been a common
phenomenon that ICU beds were unused for lack of qualified personnel33. Please note that we here also did not
differentiate between high and low care ICUs (i.e., with and without invasive ventilator) since we only had num-
bers on the total number of ICU patients with COVID-19. Future studies might also try to account for changing
treatment strategies of COVID-19 patients. Guidelines have emerged34, but are likely subject to change. Early
reports on the outbreak emphasized the potential progression of COVID-19 pneumonia to acute respiratory
distress syndrome (ARDS)35, biasing towards early intubation and ventilation. However, a growing number
of studies shows that a subgroup of patients seems to be clinically stable despite very low blood oxygenation
levels and may benefit more from non-invasive oxygen supply and ventilation methods than early intubation36.
Accumulating experience with COVID-19 patients will therefore result in shifting treatment strategies that can
either increase or ease the strain on ICU capacities.
By testing the proposed model for three regions, we show that this approach is generalizable to data of other
cities and regions as long as the overall numbers of reported COVID-19 patients and the ICU capacities are
available. We suppose here to use only regional data instead of summary data of whole countries since the occur-
rence of infections can be very diverse between different parts. When data on ICU patients with COVID-19 are
additionally available, it can further be evaluated if our parameter estimates also hold true for other regions.
Although our predictions are based on a small data set and a number of assumptions, we introduced here
a simple statistical model that (1) produces reasonable estimates for ICU rate, length of ICU stay, and time lag
and (2) accounts for different exponential growth rates as well as linear growth with different slopes. Since our
proposed model is quite generic, we hope that this study will help others to estimate the future need of intensive
care in addition to sophisticated epidemiological approaches such as compartment or transmission m odels30,37,38.
Moreover, a simultaneous modelling for several neighboring regions (e.g., for whole Germany (DIVI register),
Italy (PCM-DPC), Spain (Datadista), or France (Géodes database)) and a comparison of the results would be
interesting. However, as already pointed out by others13, any forecast models in early times of the current SARS-
CoV-2 pandemic needs to be taken with caution and assumptions need to be updated when further data become
available. In particular, future studies might model the number of administered tests as a confounding variable.
Data availability
All data we used are public and can be downloaded from LAGeSo Berlin (https://www.berlin.de/lageso/gesun
dheit/infektionsepidemiologie-infektionsschutz/corona/) for Berlin, the Presidenza del Consiglio dei Ministri—
Dipartimento della Protezione Civile (https://github.com/pcm-dpc/COVID-19) for Lombardy, and Datadista
(https://github.com/datadista/datasets) for Madrid.
Code availability
The code can be found here: https://github.com/MatRit/Covid-19.git.
Appendix
See Fig. 5.
Scientific Reports | (2021) 11:5018 | https://doi.org/10.1038/s41598-021-83853-2 9
Vol.:(0123456789)www.nature.com/scientificreports/
Figure 5. Number of reported infections and intensive care patients (left) and absolute and relative daily change
of the number of infections (right, averaged over the last 7 days, since 100 infections) in Berlin, Lombardy, and
Madrid until December 31, 2020.
Received: 12 August 2020; Accepted: 6 February 2021
References
1. Dong, E., Du, H. & Gardner, L. An interactive web-based dashboard to track COVID-19 in real time. Lancet Infect. Dis. 20, 533–534.
https://doi.org/10.1016/S1473-3099(20)30120-1 (2020).
2. Wagenaar, W. A. & Sagaria, S. D. Misperception of exponential growth. Percept. Psychophys. 18(6), 416–422 (1975).
3. Baud, D. et al. Real estimates of mortality following COVID-19 infection. Lancet Infect. Dis. 20, 773. https://doi.org/10.1016/
S1473-3099(20)30195-X (2020).
4. Lipsitch, M. Estimating case fatality rates of COVID-19. Lancet Infect. Dis. 20, 774–775. https://d
oi.o
rg/1 0.1 016/2 FS147 3-3 099(20)
30246-2 (2020).
5. Grasselli, G., Pesenti, A. & Cecconi, M. Critical care utilization for the COVID-19 outbreak in Lombardy, Italy: Early experience
and forecast during an emergency response. JAMA 323, 1545–1546. https://doi.org/10.1001/jama.2020.4031 (2020).
Scientific Reports | (2021) 11:5018 | https://doi.org/10.1038/s41598-021-83853-2 10
Vol:.(1234567890)www.nature.com/scientificreports/
6. Verity, R. et al. Estimates of the severity of coronavirus disease 2019: A model-based analysis. Lancet Infect. Dis. 20, 669–677.
https://doi.org/10.1016/S1473-3099(20)30243-7 (2020).
7. Ferriss, T. Predicting hospital capacity: Why to act early, how to think about lag time, and a model you can use. https://tim.blog/
2020/03/17/predicting-hospital-capacity-why-to-act-early-how-to-think-about-lag-time-and-a-model-you-can-use (2020).
8. Bhatraju, P. K. et al. COVID-19 in critically ill patients in the Seattle region—case series. N. Engl. J. Med. 382, 2012–2022. https://
doi.org/10.1056/NEJMoa2004500 (2020).
9. Clukey, K. & Berthelsen, C. Ventilators top fear with N.Y. deaths at 385, N.J. cases up 56%. Bloomberg (2020-03-26). https://www.
bloomberg.com/news/articles/2020-03-26/n-y-death-toll-up-to-385-ventilators-used-as-long-as-30-days (2020).
10. Manca, D. Dynamics of ICU patients and deaths in Italy and Lombardy due to Covid-19 analysis updated to 30-March. European
Society of Anesthesiology. https://www.esahq.org/esa-news/dynamics-of-icu-patients-and-deaths-in-italy-and-lombardy-due-to-
covid-19-analysis-updated-to-30-march-day-38-evening/ (2020).
11. Arango, C. Lessons learned from the coronavirus health crisis in Madrid, Spain: How COVID-19 has changed our lives in the last
2 weeks. Biol. Psychiatry 88, e33–e34. https://doi.org/10.1016/2Fj:biopsych:2020:04:003 (2020).
12. Wood, R. M., McWilliams, C. J., Thomas, M. J., Bourdeaux, C. P. & Vasilakis, C. COVID-19 scenario modelling for the mitigation
of capacity-dependent deaths in intensive care. Health Care Manag. Sci. 23, 315–324. https://doi.org/10.1007/s10729-020-09511-7
(2020).
13. Deasy, J. et al. Forecasting ultra-early intensive care strain from COVID-19 in England. medRxiv (2020).
14. Remuzzi, A. & Remuzzi, G. COVID-19 and Italy: What next?. Lancet 395, 1225–1228. https://doi.org/10.1016/S0140-6736(20)
30627-9 (2020).
15. Amt für Statistik Berlin-Brandenburg. Statistischer Bericht A I 5–hj 2/19: Einwohnerinnen und Einwohner im Land Berlin am 31.
Dezember 2019. https://www.statistik-berlin-brandenburg.de/publikationen/stat_berichte/2020/SB_A01-05-00_2019h02_BE.pdf
(2020).
16. Senatsverwaltung für Justiz, Verbraucherschutz und Antidiskriminierung. Verordnung über erforderliche Maßnahmen zur Ein-
dämmung der Ausbreitung des neuartigen Coronavirus SARS-CoV-2 in Berlin. Gesetz- und Verordnungsblatt 76, 220–223 (2020).
17. Schroeter, T. Wie sich Berlins größtes Krankenhaus auf den Corona-Ernstfall vorbereitet. Der Tagesspiegel (2020-04-03). https://
www.tagesspiegel.de/berlin/mueller-zu-besuch-in-der-charite-wie-sich-berlins-groesstes-krankenhaus-auf-den-corona-ernstfall-
vorbereitet/25714372.html (2020).
18. Senatsverwaltung für Gesundheit, Pflege und Gleichstellung. Berlin plant COVID-19-Krankenhaus. https://www.berlin.de/rbmsk
zl/aktuelles/pressemitteilungen/2020/pressemitteilung.908115.php (2020).
19. Istat—Istituto Nazionale di Statistica. Bilancio demografico anno 2018 e popolazione residente al 31 dicembre. http://demo.istat.
it/bil2018/index04.html (2020).
20. Horowith, J. Italy locks down much of the country’s north over the coronavirus. The New York Times (2020-03-07). https://www.
nytimes.com/2020/03/07/world/europe/coronavirus-italy.html (2020).
21. European Commission. Internal market, industry, entrepreneurship and SMEs: Autonomous community of madrid. https://ec.
europa.eu/growth/tools-databases/regional-innovation-monitor/base-profile/autonomous-community-madrid (2020).
22. Gobierno de España. Estado de alarma. Medidas crisis sanitaria COVID-19. https://administracion.gob.es/pag_Home/atencionCi
udadana/Historico/Estado-de-alarma-crisis-sanitaria.html (2020).
23. Mateo, J. J. Madrid calcula que 300.000 habitantes han sido afectados por el coronavirus. El País (2020-04-15). https://elpais.com/
espana/madrid/2020-04-14/madrid-calcula-que-300000-residentes-han-sido-afectados-por-el-coronavirus.html (2020).
24. Winfield, N. & Charlon, A. Europe faces ICU crunch, rushes to build field hospitals. NBC (2020-04-01). https://nbcmontana.com/
news/nation-world/europe-faces-icu-crunch-rushes-to-build-field-hospitals (2020).
25. Landesamt für Gesundheit und Soziales Berlin. COVID-19 Fälle im Land Berlin, 7-Tage-Inzidenz nach Altersgruppen und Mel-
dewochen—Gesamtübersicht . https://www.berlin.de/lageso/gesundheit/infektionsepidemiologie-infektionsschutz/corona/tabel
le-altersgruppen-gesamtuebersicht/ (2020).
26. Science Media Center Germany. Auslastung der Intensivstationen: Zahlen aus Deutschland und Europa. https://w ww.m ig.t u-b
erlin.
de/fileadmin/a38331600/sonstiges/Auslastung-und-Verfu-gbarkeit_ITS_HG-1.pdf (2020).
27. Kluge, S. et al. German recommendations for critically ill patients with COVID-19. Medizinische Klinik-Intensivmedizin und
Notfallmedizinhttps://doi.org/10.1007/Fs00063-020-00689-w (2020).
28. Bach, I., Birnbaum, R., Heine, H. & Trappe, T. Wie die Kliniken vorsorgen und was Ärzte jetzt fordern. Der Tagesspiegel (2020-03-
27). https://www.tagesspiegel.de/politik/naechste-woche-wird-es-noch-schlimmer-wie-die-kliniken-vorsorgen-und-was-aerzte-
jetzt-fordern/25687438.html (2020).
29. Wu, Z. & McGoogan, J. M. Characteristics of and important lessons from the coronavirus disease 2019 (COVID-19) outbreak
in China: Summary of a report of 72 314 cases from the Chinese Center for Disease Control and Prevention. JAMA 323(13),
1239–1242. https://doi.org/10.1001/jama.2020.2648 (2020).
30. Ferguson, N. et al. Report 9: Impact of non-pharmaceutical interventions (NPIs) to reduce COVID19 mortality and healthcare
demand. Imperial College COVID-19 Response Team (2020).
31. García-Basteiro, A. L. et al. Monitoring the COVID-19 epidemic in the context of widespread local transmission. Lancet Respir.
Med. 8, 440–442. https://doi.org/10.1016/S2213-2600(20)30162-4 (2020).
32. Grasselli, G. et al. Baseline characteristics and outcomes of 1591 patients infected with SARS-CoV-2 admitted to ICUs of the
Lombardy Region, Italy. JAMA 323, 1574–1581. https://doi.org/10.1001/jama.2020.5394 (2020).
33. Karagiannidis, C. et al. Auswirkungen des Pflegepersonalmangels auf die intensivmedizinische Versorgungskapazität in
Deutschland. Medizinische Klinik-Intensivmedizin und Notfallmedizin 114, 327–333. https://doi.org/10.1007/s00063-018-0457-3
(2019).
34. Alhazzani, W. et al. Surviving sepsis campaign: Guidelines on the management of critically ill adults with coronavirus disease 2019
(COVID-19). Intensive Care Med. 46, 854–887. https://doi.org/10.1007/s00134-020-06022-5 (2020).
35. Yang, X. et al. Clinical course and outcomes of critically ill patients with SARS-CoV-2 pneumonia in Wuhan, China: A single-
centered, retrospective, observational study. Lancet Respir. Med.https://doi.org/10.1016/S2213-2600(20)30079-5 (2020).
36. Gattinoni, L. et al. COVID-19 pneumonia: Different respiratory treatments for different phenotypes?. Intensive Care Med. 46,
1099–1102. https://doi.org/10.1007/s00134-020-06033-2 (2020).
37. Ferguson, N. M. et al. Strategies for mitigating an influenza pandemic. Nature 442, 448–452. https://doi.org/10.1038/nature04795
(2006).
38. Fox, G. J., Trauer, J. M. & McBryde, E. Modelling the impact of COVID-19 upon intensive care services in New South Wales. Med.
J. Aust. 212, 468–469. https://doi.org/10.5694/mja2.50606 (2020).
Acknowledgements
We acknowledge support from the Open Access Publication Fund of Charité - Universitätsmedizin Berlin. We
are grateful to Prof. Dr. med. Michael M. Ritter for his clinical input and Hans-Ludwig Hackmack for revising
the mathematical model.
Scientific Reports | (2021) 11:5018 | https://doi.org/10.1038/s41598-021-83853-2 11
Vol.:(0123456789)www.nature.com/scientificreports/
Author contributions
M.R., J.D.H. and K.R. designed the study. M.R. and K.R. developed the method. M.R. analyzed the data. M.R.,
D.O., F.P., J.D.H. and K.R. wrote the manuscript.
Funding
Open Access funding enabled and organized by Projekt DEAL.
Competing interests
The authors declare no competing interests.
Additional information
Correspondence and requests for materials should be addressed to M.R. or K.R.
Reprints and permissions information is available at www.nature.com/reprints.
Publisher’s note Springer Nature remains neutral with regard to jurisdictional claims in published maps and
institutional affiliations.
Open Access This article is licensed under a Creative Commons Attribution 4.0 International
License, which permits use, sharing, adaptation, distribution and reproduction in any medium or
format, as long as you give appropriate credit to the original author(s) and the source, provide a link to the
Creative Commons licence, and indicate if changes were made. The images or other third party material in this
article are included in the article’s Creative Commons licence, unless indicated otherwise in a credit line to the
material. If material is not included in the article’s Creative Commons licence and your intended use is not
permitted by statutory regulation or exceeds the permitted use, you will need to obtain permission directly from
the copyright holder. To view a copy of this licence, visit http://creativecommons.org/licenses/by/4.0/.
© The Author(s) 2021
Scientific Reports | (2021) 11:5018 | https://doi.org/10.1038/s41598-021-83853-2 12
Vol:.(1234567890)You can also read