COVID-VAC: The second global study of COVID-19 vaccine acceptance
←
→
Page content transcription
If your browser does not render page correctly, please read the page content below
COVID-VAC: The second global study of COVID-19 vaccine acceptance Jeffrey Lazarus ( Jeffrey.Lazarus@ISGlobal.org ) Barcelona Institute for Global Health (ISGlobal) https://orcid.org/0000-0001-9618-2299 Katarzyna Wyka Graduate School of Public Health & Health Policy, City University of New York (CUNY) Trenton White Barcelona Institute for Global Health (ISGlobal), Hospital Clínic, University of Barcelona, Barcelona https://orcid.org/0000-0002-0633-4445 Camila Picchio Barcelona Institute for Global Health (ISGlobal), Hospital Clínic, University of Barcelona, Barcelona Kenneth Rabin City University of New York (CUNY) Graduate School of Public Health & Health Policy, New York Scott Ratzan City University of New York (CUNY) Graduate School of Public Health & Health Policy, New York Jeanna Parsons Leigh Dalhousie University Jia Hu University of Calgary Ayman El-Mohandes City University of New York (CUNY) Graduate School of Public Health & Health Policy, New York Article Keywords: COVID-19, disease control, SARS-CoV-2, vaccination DOI: https://doi.org/10.21203/rs.3.rs-780128/v1 License: This work is licensed under a Creative Commons Attribution 4.0 International License. Read Full License
COVID-VAC: The second global study of COVID-19 vaccine acceptance

Jeffrey V Lazarus1,2*, Katarzyna Wyka2, Trenton M White1, Camila A Picchio1, Kenneth Rabin2, Scott C
Ratzan2, Jeanna Parsons Leigh3, Jia Hu4, Ayman El-Mohandes2

       1. Barcelona Institute for Global Health (ISGlobal), Hospital Clínic, University of Barcelona,
       Barcelona, Spain

       2. Graduate School of Public Health & Health Policy, City University of New York (CUNY),
       New York, New York, United States

       3. School of Health Administration, Dalhousie University, Halifax, Canada

       4. University of Calgary, Calgary, Canada

* Corresponding Author: Jeffrey V Lazarus, jeffrey.lazarus@isglobal.org

Abstract (150/150 words)

This one-year follow-up study investigated COVID-19 vaccine acceptance in 23 countries. In June

2021, 75.2% of respondents reported to accept the vaccine, of which 49% had received at least one

vaccine dose and 51% were willing to get it once available to them. Factors associated with COVID-

19 vaccine acceptance include perceived safety and trust in science, as measured by a novel COVID-

VAC score, and personal experience with COVID-19. Males, healthcare workers, well-to-do people,

those with university degrees, and those whose physician recommended vaccination were more

likely to accept it. Trust in governmental ability to address COVID-19 was weakly associated with

vaccine acceptance. Respondents strongly supported vaccination to travel internationally, but

weakly supported vaccinating children for school attendance. Hesitancy rates remain high in LMICs.

Health policymakers should aggressively communicate vaccination need and inform accurately about

efficacy and safety compared to disease risk, and healthcare workers need a greater vaccine

communications role.

Keywords: COVID-19, disease control, SARS-CoV-2, vaccination

                                                   1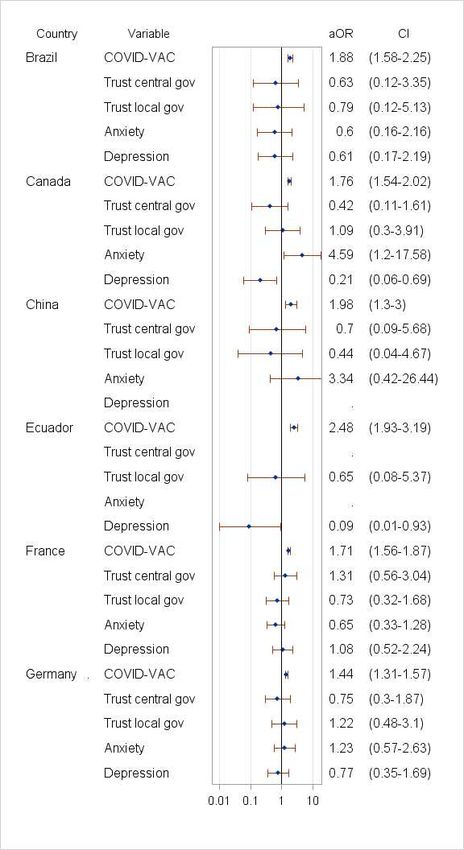
Introduction

Vaccine hesitancy is a global challenge, declared by the World Health Organization in 2019 as one of

the ten greatest global health threats1, and a vital concern since vaccination is the most effective

intervention to control the ongoing COVID-19 pandemic. In June 2020, as most countries were

experiencing a second wave of SARS-CoV-2 transmission, the authors of this study reported

potentially low COVID-19 vaccine acceptance among more than 13,000 respondents in 19 of the

hardest-hit countries.2 As of 1 August 2021, 1.07 billion individuals globally had received one dose

and another 1.14 billion received two doses of an available COVID-19 vaccine; however, more than

70% of the world (90% in low- and middle-income countries (LMIC)) remains unvaccinated.3

Globally, rates of COVID-19 vaccine acceptance vary. In a 2021 study of more than 30,000

respondents from eight countries, 27% of participants were hesitant, ranging from 9.6% in Brazil to

47.3% in France.4 Another survey of more than 18,000 respondents from 15 countries reported a

range of 54% vaccine acceptance in France to 87% in India.5 A recent review of 15 peer-reviewed

studies calculates a COVID-19 vaccine acceptance rate of 77.6% in the general population and 86.1%

among students.6 Another study reported vaccine acceptance ranges from 23.6% in Kuwait to 97% in

Ecuador.7 The lowest rates of acceptance to date are reported in the Middle East, Africa, and several

European countries (notably France, Italy, Poland, and Russia).

The main causes of vaccine hesitancy in these studies included concerns about vaccine safety and

efficacy, mistrust of governments and health and scientific institutions, individual religious and

political beliefs, as well as misinformation and conspiracy theories.8–11Most studies reported men to

be more likely to accept COVID-19 vaccines than women.7 Other variables associated with lower

vaccine acceptance include living in rural areas and lower income. Conversely, COVID-19 vaccine

acceptance correlated strongly among those who reported greater concern about the effects of

                                                   2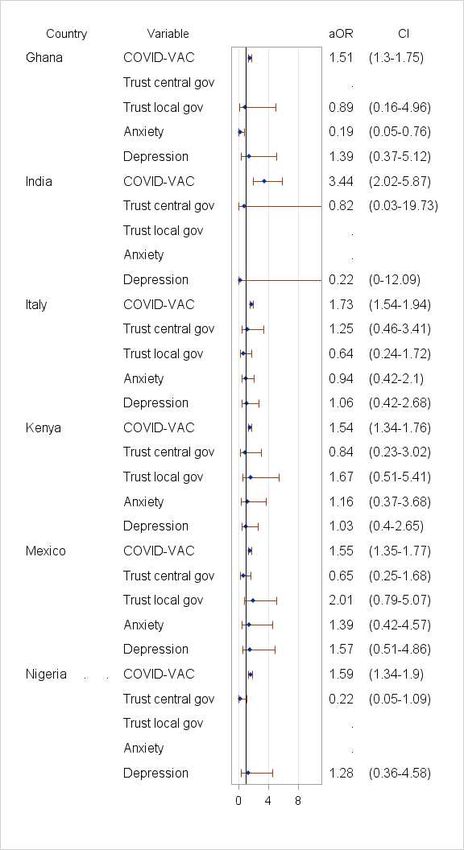
COVID-19 disease and those previously vaccinated against influenza.4 Posessing accurate knowledge

about COVID-19 disease transmissibility and prevention, fear of contracting COVID-19, and higher

income all correlated positively with acceptance, but having a chronic disease and being female did

not.12 The association between age and vaccine acceptance varied geographically, with some studies

showing greater acceptance among older (above 65 years)4 and others among younger (below 40

years) age groups.12 A survey conducted in nine LMICs in Asia and Africa showed that vaccine

acceptance increased with a higher perception of effectiveness; 76.4% accepting a hypothetical 90%

effective vaccine increased to 88.8% accepting if 95% effective.12

Following a year of substantial but very uneven global availability, administration and acceptance of

COVID-19 vaccines, further investigation is necessary to understand how knowledge, risk perception,

trust, and other factors associated with acceptance continue to evolve. The present study was

undertaken in June 2021 to assess vaccine acceptance and uptake among 23 countries that

represent approximately 60% of the world’s population. In addition, comparisons in acceptance

rates among the 19 countries in our 2020 study were included. Novel investigations in this 2021

study include testing the predictive value of a new vaccine acceptance score (COVID-VAC), which

represents perceptions of risk, trust, safety, equity, and efficacy; the impact of mental health on

vaccine acceptance; and acceptance for a range of requirements for proof of vaccination, and

vaccination for children.

Results

Sample characteristics

23,000 participants from 23 countries responded to the survey. Approximately half were female

(50.2%), ages 30-59 (59.9%), and resided in LMICs (52.2%). One-fifth were university graduates

(22.4%) (Table 1). Healthcare workers represented 10.8% of respondents. COVID-19 illness (self or

                                                   3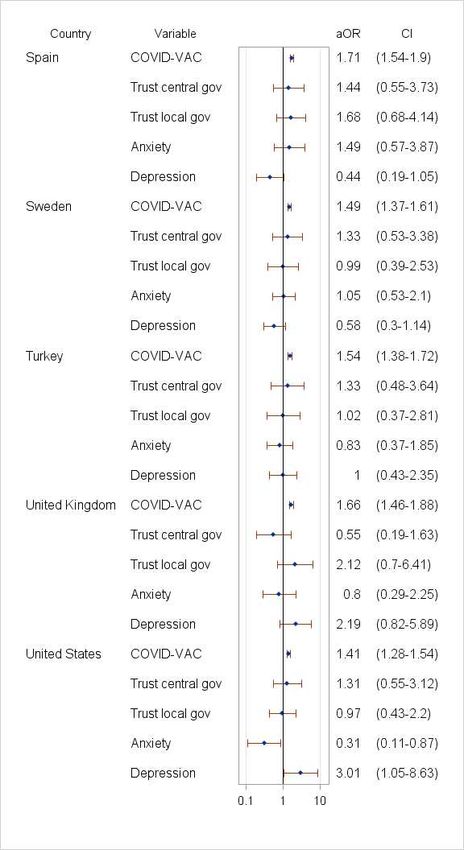
family) or loss of a family member to COVID-19 were most common in Ecuador (48.3% and 19.2%),

Brazil (38.3% and 18.3) and Peru (35.5% and 34.7%), and least common in China (1.5% and 2%),

Singapore (3.3% and 5.3%), South Korea (3.8% and 2.1%), Ghana (5.8% and 1.5%), and Nigeria (6%

and 2.3%). Loss of income was highest in lower-middle and upper-middle income countries (range

31.7% in Germany to 95.1% in Ecuador). Reported anxiety prevalence ranged from 9.2% in Ghana to

44.7% in Turkey, and depression was lowest in China (12.6%) and Ghana (12.9%) and highest in

Turkey (38.7%).

Vaccine acceptance, June 2021

In June 2021, global COVID-19 vaccine acceptance was 75.2%, of whom 49% reported having

received at least one vaccine dose and 51% were willing to get it once available to them (Figure 1).

Reported vaccine acceptance was highest in China (97.6% (of whom 91.9% had received at least one

dose)), Canada (79.2% (86.3%)), and the UK (81.2% (82.6%)) and lowest in Russia (51.6% (30.4%)),

Nigeria (57% (3.5%)), and Poland (59.3% (74.2%) (Figure 1). The mean difference between these

single-dose figures and official rates13 was 2.7%; reliable data for China are unavailable.

Compared to June 2020, vaccine acceptance in the 19 countries previously surveyed increased from

71.5% to 75.2%, though an opposite trend was observed in South Africa (-20.9%), the US (-8.8%),

Nigeria (-8.2%), and Russia (-3.3%). Vaccine acceptance when recommended by employer increased

in all countries (global average increased from 48.1% in 2020 to 64.2% in 2021), except in Germany (-

3%) and South Korea (-0.2%). Vaccine acceptance when recommended by one’s doctor (range 56.4%

in Russia to 95.1% in China), was higher in all countries compared to one’s employer (range 44.4% in

Russia to 96.7% in China) . Notably, among respondents unsure/unwilling to vaccinate, potential

vaccine acceptance was most likely if recommended by one’s doctor, particularly in India (63.5%),

Kenya (38%), Brazil, (36.8%), Turkey(29.9%), South Korea (28.4%), and Russia (26.5%). Generally,

                                                    4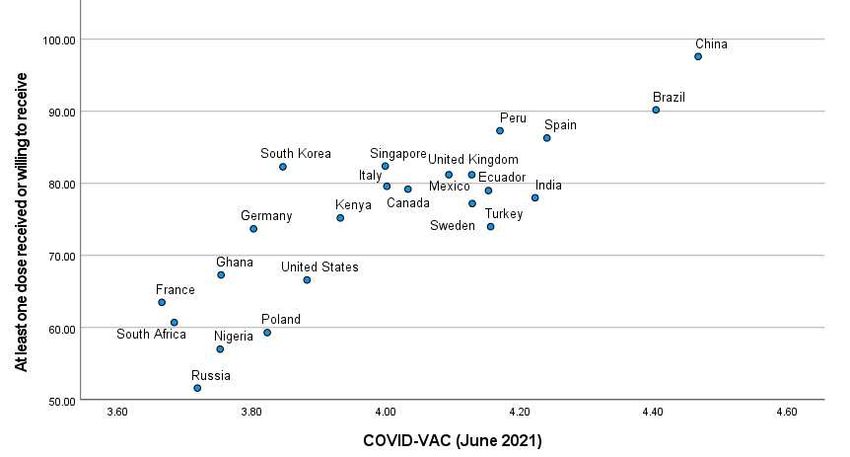
those unsure/unwilling to take the vaccine were more likely to follow their doctors’

recommendation (21.9% +/- 12.3%) than employers’ recommendation (13.2% +/- 7.7%; p=0.006)

(Figure 1).

Vaccine acceptance correlated highly with perceptions of risk, trust, safety, equity, and efficacy,

measured using COVID-VAC (June 2021: r=0.85, p
ones in Nigeria (aOR=0.89) and Ghana (aOR=0.93). Male gender was significantly positively

correlated in Ghana, Nigeria, South Africa, and the US (aOR range 1.51-8.84) and female gender in

Kenya and Peru (aOR=0.39 and aOR=0.32). Having a university degree was significantly associated

with vaccine acceptance in France, Mexico, South Africa, and the US (aOR range, 1.75-5.55). Personal

or family COVID-19 illness or death of a family member due to COVID-19 was strongly assocated with

vaccine acceptance, with statistically significant associations with personal or family illness in

Germany, Peru, Poland, Turkey, Singapore, UK (aOR range 1.89-5.72) and with loss of a family

member in Brazil, France, Germany, Ghana, Mexico, Peru, Poland, Sweden, Turkey and the UK (aOR

range 2.75-9.25). Having low or no income was associated with less vaccine acceptance in Brazil,

France, Germany, Nigeria, Peru, Russia, South Korea, Spain, Turkey, and the US (aOR range 0.08-

0.55). Moderate or severe income loss due to the pandemic was positively associated with vaccine

acceptance in Ghana, Nigeria, Poland, and the US (aOR range 2.01-6.27).

Adjusted for socio-demographic factors and COVID-19 experience, the COVID-VAC score was the

most salient and consistent positive correlate of vaccine acceptance in all countries (aOR range,

1.41-3.44) (Figure 5). The strongest correlation was with “I trust the science behind the COVID-19

vaccines” and “safety of the vaccines.” The lowest correlation was with “I trust my government is

able to deliver the vaccine to everyone and everywhere in my country” (Supplemental Table 1). In

univariable analyses, vaccine acceptance was significantly higher among respondents who reported

that they trust their central and/or local government. This finding was not universal, however, and

was not found in Brazil, China, Ecuador, and Peru (Supplemental Figure 1). After adjustment, trust in

central government had a significantly positive association in Russia and Singapore (aOR=2.05 and

aOR=5.28) and trust in local government had a negative association in South Africa (aOR=0.44). In

Poland, vaccine acceptance was negatively correlated with trust in central government (aOR=.48)

and positively correlated with trust in local government (aOR=2.9). Finally, vaccine acceptance

positively correlated with anxiety in Canada (aOR=4.59) and Peru (aOR=3.64) and negatively

                                                    6
correlated in South Korea (aOR=.43) and the US (aOR=.31), while depression was a negative factor in Canada (aOR=.21) and South Africa (aOR=.53) (Figure 5). Healthcare workers (HCW) Vaccine acceptance was significantly higher among HCWs globally compared to non-HCWs (91.8% vs. 83%, p
achieve global herd immunity (80-85%). Among the six-item COVID-VAC score, positive perceptions

of safety and trust in the science behind vaccine development were the strongest predictors of

acceptance, while perceptions of efficacy, benefit, and equity also held strong associations. Other

determinants of vaccine acceptance varied by country; personal experience with COVID-19 (e.g.

sickness or loss of a family member) predominated, but other demographic characteristics (e.g.

gender, education and income) showed varying degrees of association, and government trust was

associated with vaccine acceptance in a few countries.

In order to improve the global vaccination rate, some countries may require people to present proof

of vaccination to attend work, school, or indoor activities and events. Our results found the

strongest support for requirements targeting international travellers and support was weakest for

requirements for school children. Importantly, vaccine acceptance improves among those indicating

unwillingness to vaccinate if it is recommended by a doctor, and to a lesser extent by an employer.

Misperceptions of vaccines as having high risks and low benefits drive vaccine hesitancy,14 which

may also be influenced by lower trust in the science behind vaccine research and production.15–19 In

late 2019 and early 2020 the majority of people in most countries preceived the importance of

science and trust in scientists positively.20 Our results corroborate these findings where perceptions

of trust in science and vaccine safety were most predictive of vaccine acceptance.

Healthcare workers are in a privileged position of trust and are therefore important sources of

reliable and accurate vaccine information.21–24 Among HCWs, COVID-19 vaccine hesitancy ranged

between 4.3% and 72%, with an average of 22.5%.25 Similar to the general population, the main

reasons for vaccine hesitancy among HCWs were concerns about efficacy, safety, and potential side-

effects. Demographic factors among HCWs such as male gender, older age and holding a doctoral

degree were positively associated with acceptance of COVID-19 vaccines.25 Our study aligns with

                                                   8
similarly recorded trends of higher rates of vaccination acceptance among physicians compared to
nurses.26–29 Among hesitant respondents in this survey, the advice of their physician was the factor
most likely to change their minds, followed by the recommendation of their employer. This effect
could be amplified if the physician had personally received the vaccine.
In June 2020, trust in government to successfully address unexpected health threats, including the
COVID-19 pandemic, was one of the strongest factors associated with acceptance of an (at that
time) unavailable vaccine.2 A 2020 study in Portugal, where 56% reported they would wait to take
the COVID-19 vaccine and 9% would refuse, showed that vaccine hesitancy was related to a poor
perception of government and health service response as well as a lack of trust in the information
provided,30 which is consistent with previous pandemic research.31 Yet, after accounting for socio-
demographic, vaccine-specific, and COVID-19 experience variables, our study found trust in central
government to be significantly associated with vaccine acceptance only in Russia and Singapore and
for local government in only Poland. It is notable also that Nigeria reported low vaccine acceptance
and high distrust in governmental ability to respond to COVID-19,32 but the association was not
significant. This dissonance between trust in government and vaccine acceptance in our study could
be related to the population’s general dissatisfaction with government responses to the pandemic
and its economic consequences, with vaccine acceptance being independent of such sentiments and
more a reflection of personal experiences with COVID-19 illness or loss of life and livelihood. Our
results confirm that direct experience for self or family with the illness, and/or loss of a family
member to the disease are independently associated with vaccine acceptance.
As health systems in LMICs struggle to address COVID-19,33 vaccine access has become cause for
national frustrations. Most LMICs have been slow to receive and distribute vaccines, which are
significantly more available in high-income countries, prompting critiques of global vaccine
inequity.34
9Most recent studies do not investigate income as a potential influencer on vaccine acceptance. A
study conducted in Portugal found people who lost income during the pandemic were more
hesitant.30 An Irish study showed that people with lower income were also more vaccine hesitant.35
In China, loss of income was greater among residents of areas with more severe COVID-19
transmission and magnified existing social and economic disparities.36 In the US, having lower
income was associated with higher risk of depression during the pandemic.37 Our results show a
seemingly paradox where lower household income is associated with a greater level of hesitance,
while loss of income due to the pandemic is associated with greater likelihood of vaccine
acceptance. We suspect the perceived association between vaccination and return to normalcy is
stronger among people who lost socioeconomic status due to pandemic-related job loss, while
people whose income was low before the pandemic may not perceive a vaccine as making much of a
difference in their lives.
Globally, anxiety and depression increased during the pandemic while positive feelings such as
happiness and life satisfaction decreased.38 A global review of COVID-19 related mental health found
anxiety levels of 26.5%-44.6%, depression rates of 8.1%-25% and insomnia levels of 38%.39 Stress
levels were found to greatly differ (3.8% and 68.3%). In several countries such as Bangladesh, India,
and Pakistancases of suicide as a result of COVID-19 fear have been reported.38 Across a range of
timepoints and geographies, people who had COVID-19 report more symptoms of anxiety,
depression, and post-traumatic stress disorder than people without a COVID-19 diagnosis.38
Similarly, people with pre-existing psychiatric conditions reported worsening of their psychiatric
symptoms during the pandemic.40
Mental illness has been associated with a higher risk of COVID-19 related mortality and morbidity,41
yet studies examining the impact of mental health on vaccine hesitancy are scarce. One German
10study did not show a relation between depression or anxiety and vaccine hesitancy.42 This is in line
with a Danish study showing that, although people previously diagnosed with mental illnesses
reported slightly lower vaccine acceptance compared to the general population (84.8% versus
89.5%), vaccine hesitancy among people with mental illnesses does not seem to be a deterrant to
reaching herd immunity.43 In Ireland, by contrast, people who had received treatment for a mental
health problem were more accepting of a vaccine, unlike UK respondents who showed no
association.35 Our study results suggest that the effects of depression and anxiety are far from
universal, with divergent associations between anxiety and depression and vaccine acceptance
reported across the 23 countries. A deeper examination of cultural influences should be explored in
future research.
Increased vaccine scepticism may result from the dissemination of erroneous or inaccurate, and
often politicized,17,44 information. Misinformation drives vaccine hesitancy, undermining confidence
in vaccine safety and efficacy, as well as in equity of availability and access to COVID-19 vaccines.45
For example, over two-thirds of vaccine videos on YouTube that were analyzed for content accuracy
in May 2019 were found to have presented unreliable safety and efficacy information.46 However, in
mid-February 2021, despite only 46% of Twitter poll respondents agreeing that all COVID-19
vaccines are safe, 83% indicated they would accept a vaccine, while only 2% would only agree to
accept one if it were mandatory to do so.47 Our results indicate that respondents are willing to trust
their doctors’ advice. HCWs should play a more direct role in disseminating clear and credible
information whenever possible.
To control the COVID-19 pandemic, requirements for proof of vaccination, or vaccine mandates, are
being considered, for example, to travel internationally or to attend work, school, or indoor events.
A 2020 study surveying 1,200 Australians found that 73% of the respondents agreed with vaccine
mandates for work, travel, and study.48 In line with our results, a US September 2020 study found
11that approximately half of the general population considered mandatory COVID-19 vaccination for
children attending school acceptable, a perspective that remains universally low in our sample.
Mandates for adults by state governments were considered acceptable by 40.9% of the US
population, whereas 47.7% accepted mandates by their employer to attend work.49 However, our
2020 global study showed that people were potentially more likely to accept voluntary over
employer-mandated vaccination.2 “Choice architecture” that frames vaccination requirements as
effective public health and disease prevention and control tools, which one chooses to accept in
order to fully participate in society, as opposed to a violation of the individual’s right to select
medical treatment, may promote incremental vaccine uptake.50 As vaccines receive full approval
from regulatory agencies, this may lead to improved perspectives on safety and efficacy, and
vaccination campaigns based on such choice framing could convince more unvaccinated adults and
young adults to acceopt vaccination and increase parental acceptance of vaccination for their
children.
One limitation of correlation analyses using actual vaccination rates is that countries with low
vaccine access may produce unreliable results given this extrinsic factor. Additionally, our
questionnaire asked about a general COVID-19 vaccine, whereas several COVID-19 vaccines, each
with different efficacy results and targeted misinformation, are being distributed globally. This study
is strengthened by maintaining a sampling methodology that ensures population representativeness
between iterations.
As COVID-19 vaccination campaigns continue and coverage improves, further challenges will include
increasing vaccination among those reporting lower vaccine confidence in addition to expanding
equitable vaccine access to low- and middle-income countries. Validation of COVID-VAC confirms the
importance of positive perception of vaccine safety, efficacy and equity for vaccine acceptance.
Vaccine uptake may be improved through targeted requirements for vaccination in order to
12participate in certain activities. Misinformation may have greater opportunity to spread in settings
where access to COVID-19 vaccination is low, so accurate COVID-19 vaccine communication should
be delivered by trusted sources, like doctors, to promote vaccination and clearly explain its safety
and benefits to individuals, families, and communities.
Methods
Study participants
Participants were recruited by Consensus Strategies using multiple international online panel
providers to avoid coverage bias: Dynata provided 22,500 respondents across all 23 countries; and
Consensus Strategies provided 500 respondents from Ghana. Respondents’ identities were verified
using IP addresses and mobile phone numbers. Participants were recruited for the panels via a
variety of methods, including online, telephone, and direct mail solicitation and equitably
compensated in compliance with ethical standards, varying by country and not exceeding USD 3 per
completed survey. No personally identifiable information was collected or stored.
Sampling
Strata included age (18–29, 30-39, 40-49, 50-59 and 60 years and older); gender (male, female,
prefer not to say, and “other”); statistical regions (usually province or state, varies by country); and
level of education (based on each country’s educational system51), using global data from UNESCO
the Organisation for Economic Co-operation and Development, and country data from Sweden, the
United Kingdom, and the United States. Educational level was coded into two groups, those who had
or had not completed a university degree. The number of participants who could enrol in each of
13these strata was calculated to reflect the distribution in the general population based on
census/survey estimates provided by the World Bank and CIA World Factbook. Data were weighted
by strata with each stratum requiring a minimum of 50 participants. Sampling was random and is
described in detail elsewhere.51
Data collection
Survey data were collected between 25-30 June 2021, from an online panel of 23,000 respondents
aged >18 years from 23 countries (n=1,000 per country), comprised of those countries included in
the 2020 study2 (n=19) , augmented by four additional countries with high disease incidence52 and
representing regions not represented in the previous study. The 23 countries are: Brazil, Canada,
China, Ecuador, France, Germany, Ghana, India, Italy, Kenya, Mexico, Nigeria, Peru, Poland, Russia,
Singapore, South Africa, South Korea, Spain, Sweden, Turkey, the United Kingdom (UK) and the
United States (US). This study was approved and the survey administered by Emerson College,
Boston, USA (institutional review board protocol no. 20–023-F-E-6/12-[R1] updated April 12, 2021).
Survey Instrument
The instrument was developed by an expert panel following a comprehensive literature review of
COVID-19 vaccine acceptance studies and the authors’ earlier studies of pandemic control
measures51,53,54 and vaccination intent.14,55–60 The instrument included 1) a 6-item COVID-VAC score
representing perceptions of risk, trust, safety, equity, and efficacy, identified via the literature
review as important determinants of acceptance of a COVID-19 vaccine and of routine
immunization, 2) vaccination acceptance for self (whether respondent received at least one dose of
a COVID-19 vaccine and if not, whether he/she will take the COVID-19 vaccine when it is available for
them) and vaccination acceptance for their children, 3) vaccination acceptance if reccomended by
14one’s employer or doctor, 4) COVID-19 mandate acceptance (required by: (a) employers and (b) the
government and for (c) university students, (d) school children, and (e) indoor activities like
auditoriums, concerts, sports events, and (f) international travel), 5) trust in central and local
government, 6) experience of anxiety and depression (moderate; 3-4 days per week, or most or all of
the time; 5-7 days), 7) COVID-19 experience (self or a family member became ill with COVID-19, lost
a family member to COVID-19), and 8) demographic variables (age, gender, education, income, loss
of income due to COVID-19 (self-reported as “moderate” or “severe”), and health care worker
(HCW) status (Supplemental Information 1).
Data analysis
This study documents vaccine acceptance globally and by country at a point in time approximately
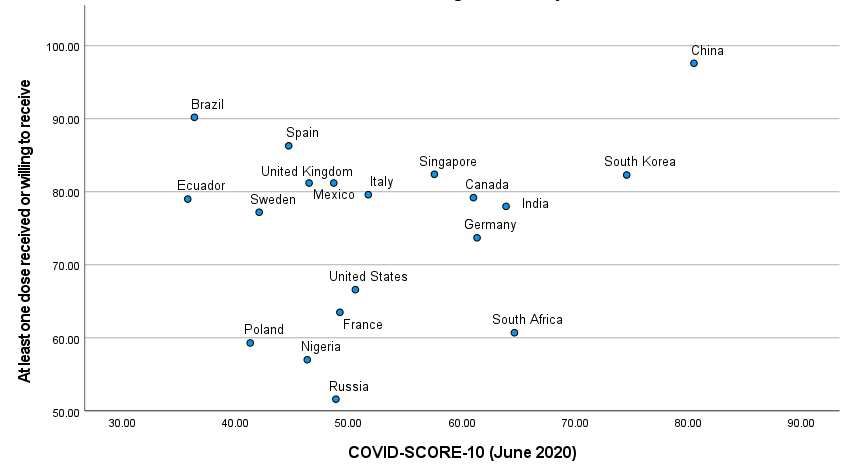
six months after the first vaccine was authorized and made available for emergency use. First,
vaccine acceptance was assessed using descriptive statistics. The association between a country’s
vaccine acceptance and current COVID-19 cases and mortality (per million population), COVID-
SCORE-10 (June 2020),51 COVID-VAC score (June 2021), and vaccine hesitancy were each assessed
using Pearson correlations. We also compared the acceptance of a hypothetical vaccine described in
our June 2020 study and current COVID-19 vaccine acceptance now that vaccines are available.
Weighted multivariable logistic regressions were used to assess the relationship between vaccine
acceptance and socio-demographic variables, COVID-19 illness experience (personally or a family
member), COVID-VAC score, trust in central and local government, and mental health. In addition to
adult vaccine acceptance, we investigated attitudes regarding vaccination of children and
requirements for proof of vaccination to travel internationally or to attend work, school, or indoor
events using descriptive statistics. Finally, vaccine acceptance among HCWs was assessed across all
countries combined. Statistical significance was set at alpha=0.05. Analyses were conducted in SAS
9.4.
15Author Contributions
JVL, SCR and AEM conceived the study. PFF collected the data. KW was responsible for coding and
data analyses with input from TMW. JVL, TMW, CAP and AEM wrote the first draft of the paper. JVL,
AEM, TMW, CAP, KW, KR, SCR, JPL, and JH edited subsequent revisions of the draft and approved the
final manuscript.
Acknowledgements
The authors would like to thank Patrick F Fox at Consensus Strategies for surveying the countries and
reviewing the methodology.
Competing Interests Statement
The authors declare no competing interests.
References
1. World Health Organization. Ten threats to global health in 2019 [Internet]. 2019 [cited 2020
Oct 6]. Available from: https://www.who.int/news-room/spotlight/ten-threats-to-global-
health-in-2019
2. Lazarus JV, Ratzan SC, Palayew A, Gostin LO, Larson HJ, Rabin K, et al. A global survey of
potential acceptance of a COVID-19 vaccine. Nat Med [Internet]. 2020; Available from:
https://www.nature.com/articles/s41591-020-1124-9
3. Mathieu E, Ritchie H, Ortiz-Ospina E, Roser M, Hasell J, Appel C, et al. A global database of
COVID-19 vaccinations. Nat Hum Behav 2021 57 [Internet]. 2021 May 10 [cited 2021 Aug
3];5(7):947–53. Available from: https://www.nature.com/articles/s41562-021-01122-8
4. Stojanovic J, Boucher VG, Gagne M, Gupta S, Joyal-Desmarais K, Paduano S, et al. Global
Trends and Correlates of COVID-19 Vaccination Hesitancy: Findings from the iCARE Study.
Vaccines 2021, Vol 9, Page 661 [Internet]. 2021 Jun 17 [cited 2021 Jul 9];9(6):661. Available
from: https://www.mdpi.com/2076-393X/9/6/661/htm
5. Boyon N. COVID-19 vaccination intent is decreasing globally [Internet]. Ipsos and World
Economic Forum. 2020 [cited 2021 Jul 29]. Available from: https://www.ipsos.com/en/global-
attitudes-covid-19-vaccine-october-2020
6. Troiano G, Nardi A. Vaccine hesitancy in the era of COVID-19. Public Health. 2021 May
1;194:245–51.
7. Sallam M. COVID-19 Vaccine Hesitancy Worldwide: A Concise Systematic Review of Vaccine
Acceptance Rates. Vaccines 2021, Vol 9, Page 160 [Internet]. 2021 Feb 16 [cited 2021 Jul
9];9(2):160. Available from: https://www.mdpi.com/2076-393X/9/2/160/htm
8. Grossman VA. The COVID-19 Vaccine: Why the Hesitancy? J Radiol Nurs. 2021 Jun
1;40(2):116–9.
9. Sallam M, Dababseh D, Eid H, Hasan H, Taim D, Al-Mahzoum K, et al. Low COVID-19 Vaccine
Acceptance Is Correlated with Conspiracy Beliefs among University Students in Jordan. Int J
16Environ Res Public Health [Internet]. 2021 Mar 1 [cited 2021 Apr 29];18(5):2407. Available
from: https://www.mdpi.com/1660-4601/18/5/2407
10. Loomba S, de Figueiredo A, Piatek SJ, de Graaf K, Larson HJ. Measuring the impact of COVID-
19 vaccine misinformation on vaccination intent in the UK and USA. Nat Hum Behav
[Internet]. 2021 Mar 1 [cited 2021 Apr 28];5(3):337–48. Available from:
https://doi.org/10.1038/s41562-021-01056-1
11. Chaccour C, Vilasanjuan R. Infodemic: How Has the Epidemic of Misinformation Affected the
Response to COVID-19? ISGlobal. 2020.
12. Suzanna Awang B, Edlaine F de MV, Ching Sin S, Won Sun C, Supa P, M Tasdik H, et al. Factors
Affecting COVID-19 Vaccine Acceptance: An International Survey among Low- and Middle-
Income Countries. Vaccines [Internet]. 2021 May 1 [cited 2021 Jul 9];9(5). Available from:
https://pubmed.ncbi.nlm.nih.gov/34067682/
13. Our World in Data. Coronavirus (COVID-19) Vaccinations [Internet]. Statistics and Research.
2021 [cited 2021 Apr 20]. Available from: https://ourworldindata.org/covid-vaccinations
14. Lane S, MacDonald NE, Marti M, Dumolard L. Vaccine hesitancy around the globe: Analysis of
three years of WHO/UNICEF Joint Reporting Form data-2015–2017. Vaccine. 2018 Jun
18;36(26):3861–7.
15. Cadeddu C, Daugbjerg S, Ricciardi W, Rosano A. Beliefs towards vaccination and trust in the
scientific community in Italy. Vaccine [Internet]. 2020 Sep 29 [cited 2021 Jul 21];38(42):6609–
17. Available from: https://pubmed.ncbi.nlm.nih.gov/32788138/
16. Palamenghi L, Barello S, Boccia S, Graffigna G. Mistrust in biomedical research and vaccine
hesitancy: the forefront challenge in the battle against COVID-19 in Italy. Eur J Epidemiol
[Internet]. 2020 Aug 1 [cited 2021 Jul 27];35(8):785–8. Available from:
https://pubmed.ncbi.nlm.nih.gov/32808095/
17. May T. Anti-Vaxxers, Politicization of Science, and the Need for Trust in Pandemic Response. J
Health Commun [Internet]. 2020 [cited 2021 Jul 27];25(10):761–3. Available from:
https://pubmed.ncbi.nlm.nih.gov/33345732/
18. Bicchieri C, Fatas E, Aldama A, Casas A, Deshpande I, Lauro M, et al. In science we (should)
trust: Expectations and compliance across nine countries during the COVID-19 pandemic.
PLoS One [Internet]. 2021 Jun 1 [cited 2021 Jul 21];16(6). Available from:
https://pubmed.ncbi.nlm.nih.gov/34086823/
19. Veit W, Brown R, Earp B. In Science We Trust? Being Honest About the Limits of Medical
Research During COVID-19. Am J Bioeth [Internet]. 2021 [cited 2021 Jul 27];21(1):22–4.
Available from: https://pubmed.ncbi.nlm.nih.gov/33373581/
20. Funk C, Tyson A, Kennedy B, Johnson C. Science and Scientists Held in High Esteem Across
Global Publics [Internet]. 2020 Sep [cited 2021 Jul 20]. Available from:
https://www.pewresearch.org/science/2020/09/29/science-and-scientists-held-in-high-
esteem-across-global-publics/
21. Arce JSS, Warren SS, Meriggi NF, Scacco A, McMurry N, Voors M, et al. COVID-19 vaccine
acceptance and hesitancy in low- and middle-income countries. Nat Med 2021 [Internet].
2021 Jul 16 [cited 2021 Jul 27];1–10. Available from:
https://www.nature.com/articles/s41591-021-01454-y
22. Yaqub O, Castle-Clarke S, Sevdalis N, Chataway J. Attitudes to vaccination: A critical review.
Soc Sci Med. 2014 Jul 1;112:1–11.
23. Paterson P, Meurice F, Stanberry LR, Glismann S, Rosenthal SL, Larson HJ. Vaccine hesitancy
and healthcare providers. Vaccine [Internet]. 2016 Dec 20 [cited 2021 Apr 28];34(52):6700–6.
Available from: https://pubmed.ncbi.nlm.nih.gov/27810314/
24. Verger P, et al. Vaccine Hesitancy Among General Practitioners and Its Determinants During
Controversies: A National Cross-sectional Survey in France. EBioMedicine [Internet]. 2015 Aug
1 [cited 2021 Jul 27];2(8):891–7. Available from: https://pubmed.ncbi.nlm.nih.gov/26425696/
25. Biswas N, Mustapha T, Khubchandani J, Price JH. The Nature and Extent of COVID-19
17Vaccination Hesitancy in Healthcare Workers. J Community Health [Internet]. 2021 [cited
2021 Jul 9];1. Available from: /pmc/articles/PMC8056370/
26. Picchio CA, Carrasco MG, Sagué-Vilavella M, Rius C. Knowledge, attitudes and beliefs about
vaccination in primary healthcare workers involved in the administration of systematic
childhood vaccines, Barcelona, 2016/17. Eurosurveillance [Internet]. 2019 Feb 7 [cited 2021
May 20];24(6):1800117. Available from:
https://www.eurosurveillance.org/content/10.2807/1560-7917.ES.2019.24.6.1800117
27. Elizondo-Alzola U, Carrasco MG, Pinós L, Picchio CA, Rius C, Diez E. Vaccine hesitancy among
paediatric nurses: Prevalence and associated factors. PLoS One [Internet]. 2021 May 1 [cited
2021 Jul 27];16(5):e0251735. Available from:
https://journals.plos.org/plosone/article?id=10.1371/journal.pone.0251735
28. Dzieciolowska S, Hamel D, Gadio S, Dionne M, Gagnon D, Robitaille L, et al. Covid-19 vaccine
acceptance, hesitancy, and refusal among Canadian healthcare workers: A multicenter
survey. Am J Infect Control. 2021 Apr 28;
29. Bauernfeind S, Hitzenbichler F, Huppertz G, Zeman F, Koller M, Schmidt B, et al. Brief report:
attitudes towards Covid-19 vaccination among hospital employees in a tertiary care
university hospital in Germany in December 2020. Infect 2021 [Internet]. 2021 May 20 [cited
2021 Aug 3];1:1–5. Available from: https://link.springer.com/article/10.1007/s15010-021-
01622-9
30. Soares P, Rocha JV, Moniz M, Gama A, Laires PA, Pedro AR, et al. Factors Associated with
COVID-19 Vaccine Hesitancy. Vaccines [Internet]. 2021 Mar 22 [cited 2021 Jul 9];9(3):300.
Available from: https://www.mdpi.com/2076-393X/9/3/300/htm
31. Siegrist M, Zingg A. The role of public trust during pandemics: Implications for crisis
communication. Eur Psychol [Internet]. 2014 [cited 2020 Oct 6];19(1):23–32. Available from:
/record/2013-34232-001
32. Ezeibe CC, Ilo C, Ezeibe EN, Oguonu CN, Nwankwo NA, Ajaero CK, et al. Political distrust and
the spread of COVID-19 in Nigeria. https://doi.org/101080/1744169220201828987 [Internet].
2020 Dec 1 [cited 2021 Jul 21];15(12):1753–66. Available from:
https://www.tandfonline.com/doi/abs/10.1080/17441692.2020.1828987
33. Okereke M, Ukor NA, Adebisi YA, Ogunkola IO, Iyagbaye EF, Owhor GA, et al. Impact of
COVID-19 on access to healthcare in low- and middle-income countries: Current evidence and
future recommendations. Int J Health Plann Manage [Internet]. 2021 Jan 1 [cited 2021 Jul
26];36(1):13–7. Available from: https://onlinelibrary.wiley.com/doi/full/10.1002/hpm.3067
34. Acharya KP, Ghimire TR, Subramanya SH. Access to and equitable distribution of COVID-19
vaccine in low-income countries. npj Vaccines [Internet]. 2021 Apr 14 [cited 2021 Jul
9];6(1):1–3. Available from: https://www.nature.com/articles/s41541-021-00323-6
35. Murphy J, Vallières F, Bentall RP, Shevlin M, McBride O, Hartman TK, et al. Psychological
characteristics associated with COVID-19 vaccine hesitancy and resistance in Ireland and the
United Kingdom. Nat Commun [Internet]. 2021 Dec 1 [cited 2021 May 5];12(1):1–15.
Available from: https://doi.org/10.1038/s41467-020-20226-9
36. Qian Y, Fan W. Who loses income during the COVID-19 outbreak? Evidence from China. Res
Soc Stratif Mobil. 2020 Aug 1;68:100522.
37. Ettman C, Abdalla S, Cohen G, Sampson L, Vivier P, Galea S. Prevalence of Depression
Symptoms in US Adults Before and During the COVID-19 Pandemic. JAMA Netw open
[Internet]. 2020 Sep 3 [cited 2021 Jul 9];3(9). Available from:
https://pubmed.ncbi.nlm.nih.gov/32876685/
38. Hossain M, Tasnim S, Sultana A, Faizah F, Mazumder H, Zou L, et al. Epidemiology of mental
health problems in COVID-19: a review. F1000Research [Internet]. 2020 [cited 2021 Jul 9];9.
Available from: https://pubmed.ncbi.nlm.nih.gov/33093946/
39. García-Iglesias J, Gómez-Salgado J, Martín-Pereira J, Fagundo-Rivera J, Ayuso-Murillo D,
Martínez-Riera J, et al. Impacto del SARS-CoV-2 (Covid-19) en la salud mental de los
18profesionales sanitarios: una revisión sistemática. Rev Esp Salud Publica [Internet]. 2020
[cited 2021 Jul 9];94(1):e1–20. Available from: https://medes.com/publication/152295
40. Vindegaard N, Benros M. COVID-19 pandemic and mental health consequences: Systematic
review of the current evidence. Brain Behav Immun [Internet]. 2020 Oct 1 [cited 2021 Jul
9];89:531–42. Available from: https://pubmed.ncbi.nlm.nih.gov/32485289/
41. Mazereel V, Assche K Van, Detraux J, Hert M De. COVID-19 vaccination for people with severe
mental illness: why, what, and how? The Lancet Psychiatry [Internet]. 2021 May 1 [cited 2021
Jul 9];8(5):444–50. Available from:
http://www.thelancet.com/article/S2215036620305642/fulltext
42. Bendau A, Plag J, Petzold MB, Ströhle A. COVID-19 vaccine hesitancy and related fears and
anxiety. Int Immunopharmacol [Internet]. 2021 Aug 1 [cited 2021 Jul 9];97:107724. Available
from: https://www.ncbi.nlm.nih.gov/pmc/articles/PMC8078903/
43. Jefsen OH, Kølbæk P, Gil Y, Speed M, Dinesen PT, Sønderskov KM, et al. COVID-19 vaccine
willingness amongst patients with mental illness compared with the general population. Acta
Neuropsychiatr [Internet]. 2021 [cited 2021 Jul 9];1–4. Available from:
https://www.cambridge.org/core/journals/acta-neuropsychiatrica/article/abs/covid19-
vaccine-willingness-amongst-patients-with-mental-illness-compared-with-the-general-
population/949CE2ADF019A3D78F64E704146EE348
44. Lin C, Tu P, Beitsch LM. Confidence and receptivity for covid‐19 vaccines: A rapid systematic
review. Vaccines [Internet]. 2021 Jan 1 [cited 2021 Apr 20];9(1):1–32. Available from:
https://pubmed.ncbi.nlm.nih.gov/33396832/
45. Islam M, Kamal A, Kabir A, Southern D, Khan S, Hasan S, et al. COVID-19 vaccine rumors and
conspiracy theories: The need for cognitive inoculation against misinformation to improve
vaccine adherence. PLoS One [Internet]. 2021 May 1 [cited 2021 Jul 19];16(5). Available from:
https://pubmed.ncbi.nlm.nih.gov/33979412/
46. Murphy M, Nanadiego FA, McCavera L, Nichols C, Kalekas P, Wachs D. Assessing the Validity
and Accuracy of Online Videos on Vaccine Health Risks. Clin Pediatr (Phila) [Internet]. 2020
Feb 19 [cited 2021 Jul 9];59(4–5):458–66. Available from:
https://journals.sagepub.com/doi/abs/10.1177/0009922820905866
47. Eibensteiner F, Ritschl V, Nawaz F, Fazel S, Tsagkaris C, Kulnik S, et al. People’s Willingness to
Vaccinate Against COVID-19 Despite Their Safety Concerns: Twitter Poll Analysis. J Med
Internet Res [Internet]. 2021 Apr 1 [cited 2021 Jul 9];23(4). Available from:
https://pubmed.ncbi.nlm.nih.gov/33872185/
48. Smith DT, Attwell K, Evers U. Support for a COVID-19 vaccine mandate in the face of safety
concerns and political affiliations: An Australian study: Politics [Internet]. 2021 May 7 [cited
2021 Jul 9]; Available from: https://journals.sagepub.com/doi/10.1177/02633957211009066
49. Largent EA, Persad G, Sangenito S, Glickman A, Boyle C, Emanuel EJ. US Public Attitudes
Toward COVID-19 Vaccine Mandates. JAMA Netw Open [Internet]. 2020 Dec 18 [cited 2021
Jul 9];3(12). Available from: https://www.ncbi.nlm.nih.gov/pmc/articles/PMC7749443/
50. Dubov A, Phung C. Nudges or mandates? The ethics of mandatory flu vaccination. Vaccine
[Internet]. 2015 May 21 [cited 2021 Jul 9];33(22):2530–5. Available from:
https://pubmed.ncbi.nlm.nih.gov/25869886/
51. Lazarus JV, Ratzan S, Palayew A, Billari FC, Binagwaho A, Kimball S, et al. COVID-SCORE: A
global survey to assess public perceptions of government responses to COVID-19 (COVID-
SCORE-10). Hotchkiss D, editor. PLoS One. 2020 Oct;15(10):e0240011.
52. Worldometer. COVID-19 data [Internet]. 2020 [cited 2020 Jun 30]. Available from:
https://www.worldometers.info/coronavirus/about/#sources
53. Lazarus JV, Binagwaho A, El-Mohandes A, Fielding JE, Larson HJ, Plasència A, et al. Keeping
governments accountable: the COVID-19 Assessment Scorecard (COVID-SCORE). Nat Med
[Internet]. 2020 Jun 11 [cited 2020 Jun 19];1–4. Available from:
https://doi.org/10.1038/s41591-020-0950-0
1954. White TM, Cash-Gibson L, Martin-Moreno JM, Matesanz R, Crespo J, Alfonso-Sanchez JL, et
al. COVID-SCORE Spain: Public perceptions of key government COVID-19 control measures.
Eur J Public Health [Internet]. 2021 Apr 19 [cited 2021 May 3]; Available from:
https://academic.oup.com/eurpub/advance-article/doi/10.1093/eurpub/ckab066/6238158
55. Larson HJ, Cooper LZ, Eskola J, Katz SL, Ratzan S. Addressing the vaccine confidence gap.
Lancet. 2011;378(9790):526–35.
56. MacDonald NE, SAGE Working Group on Vaccine Hesitancy. Vaccine hesitancy: Definition,
scope and determinants. Vaccine [Internet]. 2015 Aug 14 [cited 2020 Oct 6];33(34):4161–4.
Available from: https://pubmed.ncbi.nlm.nih.gov/25896383/
57. Larson HJ, Clarke RM, Jarrett C, Eckersberger E, Levine Z, Schulz WS, et al. Measuring trust in
vaccination: A systematic review. Hum Vaccines Immunother [Internet]. 2018 Jul 3 [cited
2021 Apr 22];14(7):1599–609. Available from: /pmc/articles/PMC6067893/
58. Quinn SC, Parmer J, Freimuth VS, Hilyard KM, Musa D, Kim KH. Exploring communication,
trust in government, and vaccination intention later in the 2009 H1N1 pandemic: Results of a
national survey. Biosecurity and Bioterrorism [Internet]. 2013 Jun 1 [cited 2020 Jul
9];11(2):96–106. Available from: http://www.knowledgenetworks.com
59. Karafillakis E, Larson HJ. The benefit of the doubt or doubts over benefits? A systematic
literature review of perceived risks of vaccines in European populations. Vaccine [Internet].
2017 Sep 5 [cited 2021 Apr 22];35(37):4840–50. Available from:
https://pubmed.ncbi.nlm.nih.gov/28760616/
60. Strategic Advisory Group of Experts on Immunization (SAGE). Report of the SAGE Working
Group on Vaccine Hesitancy [Internet]. Geneva; 2014 Oct [cited 2021 Apr 28]. Available from:
https://www.who.int/immunization/sage/meetings/2014/october/1_Report_WORKING_GR
OUP_vaccine_hesitancy_final.pdf
20Tables and figures
Table 1. Sample characteristics
Global average
United States
South Korea
South Africa
Singapore
Germany
Kingdom
Ecuador
Sweden
Canada
Mexico
Nigeria
Poland
Turkey
United
France
Ghana
Russia
Kenya
China
Brazil
Spain
India
Peru
Italy
Country
% % % % % % % % % % % % % % % % % % % % % % % %
Age
Groups
18-29 19 16.5 16.5 23.5 16.5 14.1 35.6 24.2 18.5 37.9 23.5 31.9 23.3 16 15.8 25 18.4 20.7 15.5 15.7 22.1 16.6 17.1 21.0
30-39 20.3 17.7 22.4 22.1 15.2 15.3 64.4 21.2 20 20.7 22.1 68.1 21.5 17.3 17.7 23.4 21.3 20.7 17.4 16.3 20.6 17.2 15.8 23.4
40-49 19 16.5 23.5 22.1 16.5 16.5 21.2 20 18.9 20.6 20.6 18.5 19 20.3 19.9 22 18.6 17.6 20.6 17.8 17.1 19.3
50-59 24.1 16.5 16.5 14.7 17.7 17.6 16.7 16.9 13.8 16.2 16.5 17.3 18.7 17.2 18.4 17.1 17.4 15.7 17.6 16.6 18.4 17.2
60+ 17.7 32.9 21.2 17.6 34.2 36.5 16.7 24.6 8.8 17.6 18 30.9 28.8 14.1 22 19.5 31.1 34.7 19.1 31.8 31.6 24.3
Sex
Male 49.1 49.3 51.5 49.7 49.2 48.9 50.6 50.4 48.7 49.3 49.8 50.5 49.4 48.1 46.2 48.9 49.8 49.3 48.9 49.6 48.7 49.1 48.9 49.3
Female 50.9 50.1 48.5 49.7 50.7 50.5 49.2 48 51 49.9 50.1 49.2 49.9 51.5 53.2 50.6 49.7 50.2 50.7 49.6 49.9 50.4 51 50.2
Prefer not
to 0.6 0.6 0.1 0.6 0.2 1.6 0.3 0.8 0.1 0.3 0.7 0.4 0.6 0.5 0.4 0.5 0.4 0.7 1.4 0.5 0.1 0.54
say/Other
Education (university degree)
No 82.6 73.8 88 88 82 75 85 91 85.6 97 84 91.5 84 75 45 92.5 44.9 67.8 67 75.7 79 65.6 64.3 77.6
Yes 17.4 26.2 12 12 18 25 15 9 14.4 3 16 8.5 16 25 55 7.5 55.1 32.2 33 24.3 21 34.4 35.7 38.7
Income (country median)
More
than 32.1 39.8 65.9 30.3 39.6 30.2 17.7 66.6 29.8 36.1 49.6 17.9 40.7 40.2 24.4 65.6 50.4 35.4 37.6 22.6 32.3 43 42 38.7
Median
21Less than
58.2 53 29.3 36.7 53.2 61.1 42.8 19.4 57.8 28.2 42.4 48 38.9 53.4 69.3 18.9 37.4 54.1 52.3 68.8 56.9 49 46.1 46.7
Median
No
9.7 7.2 4.9 33 7.2 8.7 39.5 14 12.4 35.7 8 34.1 20.3 6.4 6.3 15.5 12.2 10.4 10 8.6 10.8 8 11.9 14.6
income
Have you or anyone else in your household experienced a loss in income due to
the COVID-19 pandemic?
Severe
29.7 16.7 14.4 58.9 14.5 13.7 43.4 57.5 14.9 59.9 33.1 56.2 37.3 10.8 24.9 40.1 19.5 23.2 16.4 13.1 38.4 11.9 17.9 29.0
loss
Moderate
42.2 24.8 51.5 36.2 23.1 18 25.9 27.2 41.2 29.3 45.2 20.6 50 16.6 36.2 39.7 40.7 39.2 34.6 23.4 37 24.7 18.2 32.4
loss
No 28.2 58.5 34.1 5 62.5 68.2 30.7 15.2 43.9 10.7 21.7 23.2 12.6 72.5 38.9 20.2 39.9 37.6 49.1 63.5 24.6 63.4 63.8 38.6
COVID-19 experience
None 43.3 84.9 96.5 32.4 68.8 85.7 92.7 70.3 73.2 78 50.4 91.7 29.8 52.2 53.1 58.5 94.1 91.4 72.5 67.4 60.1 73.6 71 69.2
Self/famil
y member 38.3 11 1.5 48.3 25.4 9.4 5.8 8.7 20.1 15.2 28.2 6 35.5 41.4 42.8 25.1 3.8 3.3 19.6 27.3 31.3 17.8 17.7 21.0
sick
Lost
family 18.3 4.1 2 19.2 5.8 4.9 1.5 20.9 6.7 6.8 21.4 2.3 34.7 6.4 4.1 16.5 2.1 5.3 7.8 5.3 8.6 8.6 11.3 9.8
member
Health care worker
Yes 5.5 9.8 9 7.7 10.8 12 20.6 25.4 5.6 10.9 8.9 19.4 8.2 4.7 2.9 6.7 11.2 7.7 7.8 13.8 9.3 14.8 16.5 10.8
No 94.5 90.2 91 92.3 89.2 88 79.4 74.6 94.4 89.1 91.1 80.6 91.8 95.3 97.1 93.3 88.8 92.3 92.2 86.2 90.7 85.2 83.5 89.2
Mental health
25.1 24.9 12.3 21.7 28.7 20.6 9.2 26.7 26.1 24.4 29.4 13.3 39.3 20.6 36.6 37 22.7 20.8 24.4 24.1 44.7 27.6 21.9 25.3
Anxiety
Depressio 25.3 23.1 12.6 23.1 23.1 19.2 12.9 15 22.4 32.5 23.8 25.1 28.8 20.3 27.2 30.9 21.1 21.6 22.2 23.8 38.7 25.9 23.2 23.6
n
Note: Anxiety and depression defined as symptoms moderate amount of time (3-4 days) or most or all of the time (5-7 days).
22Panel b. Vaccine acceptance if recommended by employer or one’s doctor.
l
Figure 1. Vaccine acceptance in June 2020 and June 2021
Panel a. Vaccine acceptance overall
% Yes
100
10
20
30
40
50
60
70
80
90
0
Brazil 85.4
34.5 55.7
Canada 68.7
68.4 10.8 79.2
China 88.6
89.7 7.9 97.6
Ecuador 71.9
16 63 79
Willingness to take vaccine when available June 2021
Willingness to take vaccine June 2020
France 58.9
50 13.5 63.5
Germany 68.2
55.3 18.4 73.7
Ghana
3 64.3 67.3
India 74.5
20 58 78
Italy 70.8
56.1 23.5 79.6
Kenya
2 73.2 75.2
Mexico 76.3
24 57.2 81.2
Nigeria 65.2
23
2 55 57
Peru
13 74.3 87.3
At least one dose of vaccine June 2021
Poland 56.3
44 15.3 59.3
Russia 54.9
15.7 35.9 51.6
South Africa 81.6
5 55.7 60.7
South Korea 79.8
29.6 52.7 82.3
Singapore 67.9
57.4 25 82.4
Spain 74.3
52.8 33.5 86.3
Sweden 65.2
46.4 30.8 77.2
Turkey
42 32 74
United
71.5
Kingdom 67.1 14.1 81.2
United
75.4
States 55 11.6 66.6
Global
71.5
average 36.9 38.3 75.2June 2020: I would follow my employer’s recommendation to get a COVID-19 vaccine once the government has approved it as safe and effective.
June 2021: I will take the COVID-19 vaccine if my employer recommends it.
June 2021: I will take the COVID-19 vaccine if my doctor recommends it.
96.7
95.1
90.8
100
82.4
82.2
81.8
81.6
81.2
80.6
77.8
84
76.2
76.1
75.4
75.3
74.9
74.8
74.1
73.9
80
80
73.3
72.8
79
90
70.1
69.5
69.1
67.8
67.2
73
66.4
64.7
64.2
63.6
63.3
80
62.3
62.3
61.3
61.1
60.9
60.7
60.4
59.7
57.6
57.5
56.4
54.1
53.7
70
51.6
50.7
50.1
48.1
47.4
46.2
46.2
51
44.4
44.3
44.1
43.8
43.7
43.3
60
42.3
45
37.4
34.5
50 26.9
26.1
40
30
20
10
0
France
Brazil
Canada
Kenya
Nigeria
Turkey
Ecuador
Germany
India
Mexico
Spain
United States
Kingdom
China
Ghana
Italy
Poland
Russia
South Korea
Peru
Global average
Singapore
Sweden
South Africa
United
Panel c. Vaccine acceptance if recommended by employer or one’s doctor among 1) willing to get vaccinated, 2) unsure/unwilling to get vaccinated.
24% Yes
100
10
20
30
40
50
60
70
80
90
0
69.7
Brazil 86.3
4.7
36.8
59.6
Canada 84.8
12.2
16.8
99.2
China 98.2
16.2
14.6
92.1
Ecuador 97.2
19.5
16.1
68.4
France 93.4
9.9
14
61.8
Germany 94.9
4.6
10.2
85.2
Ghana 95.4
7.6
31.3
95.2
India 98
30.2
Doctor recommended vaccine among unsure/unwilling to take vaccine
Employer recommended vaccine among unsure/unwilling to take vaccine
Doctor recommended vaccine among willing to take vaccine
Employer recommended vaccine among willing to take vaccine
63.5
70.7
Italy 91.1
3.4
10.4
79
Kenya 95.6
27.4
38
25
88.2
Mexico 96.3
21.6
18.1
92.6
Nigeria 98.9
21.9
25.1
83.9
Peru 91.3
22.3
13.5
62.7
Poland 88.8
9.8
13.8
71.7
Russia 82
12.2
26.5
86.6
South Africa 96.4
12.5
27.5
82.2
South Korea 91.1
21.9
28.4
76.3
Singapore 92.6
9.1
19.4
78.8
Spain 94.5
9.1
14.5
73.6
Sweden 91.9
10.2
18.5
82.9
Turkey 93.6
8
29.9
66.9
United Kingdom 82.7
3.7
7.6
71.1
United States 81
5.2
9.7Figure 2. Vaccine acceptance by current cases and mortality
Panel a. Vaccine acceptance and COVID-19 cases
r=.13
p-value = .560
Panel b. Vaccine acceptance and COVID-19 mortality
r=.19
p-value = .390
26Panel c. Vaccine acceptance and COVID-SCORE-10 (June 2020)
r=.25
p-value = .311
Panel d. Vaccine acceptance and COVID-VAC
r=.85
p-value =% Yes
0
10
20
30
40
50
60
70
80
90
100
Brazil 91.3
Panel a. Overall
Canada 66.9
China 95
Ecuador 85.9
France 48.9
Germany 55.4
Ghana 60.3
Panel e. Vaccination rates and hesitancy
India 80.8
Italy 68.4
Kenya 73.6
28
Panel b. By respondent’s willingness to vaccinate self.
Mexico 73.2
Figure 3. Vaccine acceptance for children among parents
Nigeria 60
Peru 85.1
Poland 46.3
Russia 35.5
r=-.45
South Africa 56.7
South Korea 73.7
p-value = .034
Singapore 69.6
Spain 75.9
Sweden 64.1
Turkey 67
United… 63.2
United… 57.6100
10
20
30
40
50
60
70
80
90
0
Brazil 97.2
95.0
35.6
Canada 86.5
71.9
6.2
China 96.6
94.8
40.0
Ecuador 100.0
93.6
53.4
France 75.8
65.3
2.8
Germany 76.3
58.6
4.8
Ghana 83.3
86.7
1.6
India 100.0
97.1
18.3
Italy 83.6
80.6
7.1
Kenya 100.0
92.9
6.1
Mexico 91.2
29
84.7
11.9
Nigeria 100.0
78.5
20.2
Peru 96.7
96.1
12.3
Poland 80.5
62.5
4.9
Russia 67.0
55.4
5.3
South Africa 87.8
84.1
9.8
South Korea 80.4
83.6
19.6
Singapore 83.2
73.9
10.0
Spain 89.4
78.1
1.2
Sweden 84.1
67.0
14.8
Turkey 89.8
85.3
0.5
United Kingdom 81.3
69.9
9.6
United States 88.2
67.0
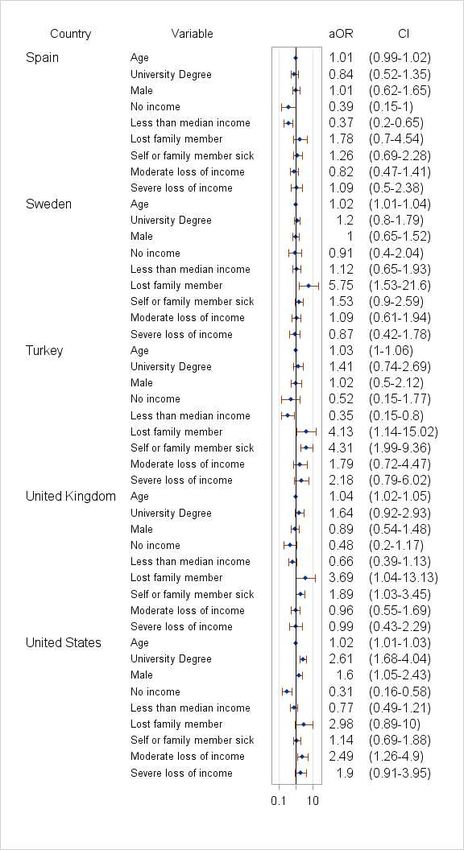
6.0Figure 4. Correlates of vaccine acceptance-sociodemographic factors and COVID-19 experience.
Adjusted odds ratios (aOR) and 95%CI (log scale) from weighted multivariable logistic regression;
refrence categories: Female, No university degree, More than median income, No COVID-19
sickness/death, No loss of income.
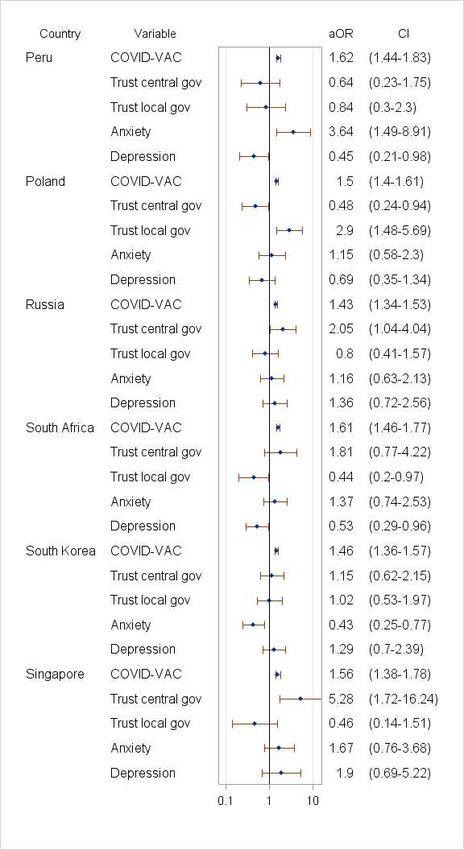
30Figure 5. Correlates of vaccine acceptance-COVID-VAC score, trust in government, anxiety and
depression.
Adjusted odds ratios (aOR) and 95%CI (log scale) from weighted multivariable logistic regression,
adjusted for socio-demographic factors and COVID-19 experience.
31Table 2. Vaccine acceptance by HCW status.
At least Will take At least one Unsure
one when dose received or not
dose available or will receive willing to
received when available take
n % % % % p-value aOR(95%CI
Not HCW 19840 52 31 83 17
All HCW 3295 72.4 19.4 91.8 8.1Figure 6. Vaccine mandates acceptance.
100
86.4
95.4
86.6
89.7
93.2
84.2
87.7
82.5
82.6
81.3
84.9
87.8
80.5
96.6
87.6
79.3
94
86
66.778.3
62.177.9
77.6
77.2
77.1
62.576.4
82
% agree
83
75.8
75.2
74.6
74.4
74.4
72.3
74.2
73.7
73.5
73.4
73.2
6872.6
55.6 72.2
72.1
90
69.6
70.9
70.7
68.5
70.3
6470.3
77
67.7
66.5
68.4
74
67.2
67.2
66.9
66.7
66.7
53 66.6
66.5
6066.3
73
49.1 65.9
65.8
65.7
64.8
64.4
51.964.3
62.3
71
63.8
63.3
63.1
5562.7
62.7
5762.6
60.6
62.4
60.4
62.3
6169
61.9
80
61.5
61.1
60.8
58.7
58.4
59.5
59.3
59.2
59.1
58.8
58.2
58.2
57.6
56.7
54.6
56.5
63
55.9
53.7
52.9
54.5
53.9
53.8
53.3
39.852.7
52.6
37.652.5
52.2
70
51.2
51.2
50.8
50.6
50.4
49.3
45.2
52
43.7
41.1
60
41.5
41.3
40.3
40.3
40.3
37.9
36.2
33.6
33.1
50
30.9
24.4
40
30
20
10
0
United Global
Canad Ecuad Germa Mexic Nigeri South South Singap Swede United
Brazil China France Ghana India Italy Kenya Peru Poland Russia Spain Turkey Kingdo averag
a or ny o a Africa Korea ore n States
m e
Employer 75.8 59.3 94 77 49.3 40.3 65.8 84.2 57.6 66.7 70.9 56.7 81.3 40.3 30.9 52.2 75.2 64.4 61.1 53.3 66.5 59.5 50.4 62.3
Government 72.3 55 96.6 69.6 58.4 41.1 58.7 87.6 54.6 74 68.5 66.5 79.3 37.9 33.6 53.7 82 67.7 57 52.9 60.6 60.4 45.2 62.3
Universities 74.4 62.7 95.4 72.6 54.5 41.5 67.2 86 55.9 70.3 70.7 63 77.6 40.3 33.1 53.9 76.4 66.9 62.6 51.2 61.9 64.8 52.6 63.3
Children 71 59.1 86.6 68 43.7 41.3 63.8 73.5 50.6 72.1 67.2 61.5 74.6 36.2 24.4 51.2 62.5 59.2 56.5 52 60.8 51.9 50.8 58.2
Indoor activities 73.4 62.4 89.7 58.2 53 60 61 82.5 68.4 65.7 58.8 64 77.1 39.8 37.6 49.1 80.5 66.7 62.1 55.6 66.7 64.3 53.8 63.1
International travel 86.4 73.2 93.2 83 66.6 66.3 69 87.7 73 82.6 77.2 70.3 84.9 52.7 52.5 65.9 87.8 78.3 77.9 72.2 73.7 74.2 62.7 74.4
33You can also read