Creating xBD: A Dataset for Assessing Building Damage from Satellite Imagery
←
→
Page content transcription
If your browser does not render page correctly, please read the page content below
Creating xBD: A Dataset for Assessing Building Damage from Satellite Imagery

          Ritwik Gupta1,2 Bryce Goodman3,5 Nirav Patel3,5 Richard Hosfelt1,2 Sandra Sajeev1,2
              Eric Heim1,2 Jigar Doshi6 Keane Lucas4,5 Howie Choset1 Matthew Gaston1,2
         1
           Carnegie Mellon University 2 Software Engineering Institute 3 Defense Innovation Unit
               4
                 Joint Artificial Intelligence Center 5 Department of Defense 6 CrowdAI, Inc.

                         Abstract

    We present a preliminary report for xBD, a new large-
scale dataset for the advancement of change detection and
building damage assessment for humanitarian assistance
and disaster recovery research. Logistics, resource planning,
and damage estimation are difficult tasks after a disaster,
and putting first responders into post-disaster situations is
dangerous and costly. Using passive methods, such as analy-
sis on satellite imagery, to perform damage assessment saves
manpower, lowers risk, and expedites an otherwise danger-
ous process. xBD provides pre- and post-event multi-band
satellite imagery from a variety of disaster events with build-
ing polygons, classification labels for damage types, ordinal
labels of damage level, and corresponding satellite meta-
data. Furthermore, the dataset contains bounding boxes
and labels for environmental factors such as fire, water, and
smoke. xBD will be the largest building damage assessment
dataset to date, containing ∼700,000 building annotations
across over 5,000 km2 of imagery from 15 countries.

                                                                     Figure 1: From top left (clockwise): California wildfire;
1. Introduction                                                      Sulawesi tsunami; India monsoon; Lombok earthquake. Im-
    With recent, abrupt changes in weather patterns around           agery from DigitalGlobe.
the world, natural disasters have become more unpredictable
and have wider impacts than ever before [1]. Improvements
in the fields of machine learning and computer vision have           to place, and data must exist to reflect this phenomenon.
led to increased interest in creating smart, autonomous solu-        Last, guidance for assessing building damage from satellite
tions to problems that many first responders face worldwide.         imagery for a wide variety of disasters is lacking in available
The increasing availability of satellite imagery from sources        literature.
such as USGS, NOAA, and ESA allows researchers to create                 In order to fully support machine learning for building
models for a variety of humanitarian assistance and disas-           damage assessment, datasets of appropriate scope, scale,
ter recovery (HADR) tasks. Training accurate and robust              size, and standard must be available. For this reason, we
models necessitates large, diverse datasets. Unfortunately,          introduce xBD, a satellite imagery dataset for building dam-
datasets for these use cases are hard to obtain. Although            age assessment. xBD addresses the limitations enumerated
large-scale disasters bring catastrophic damage, they are rel-       above by collecting data across 8 disaster types, 15 countries,
atively infrequent, so the availability of relevant satellite        and thousands of square kilometers of imagery. Furthermore,
imagery is low. Furthermore, building design differs depend-         we introduce a Joint Damage Scale that provides guidance
ing on where a structure is located in the world. As a result,       and an assessment scale to label building damage in satellite
damage of the same severity can look different from place            imagery. xBD is used to introduce the xView 2.0 challenge

                                                                  1 10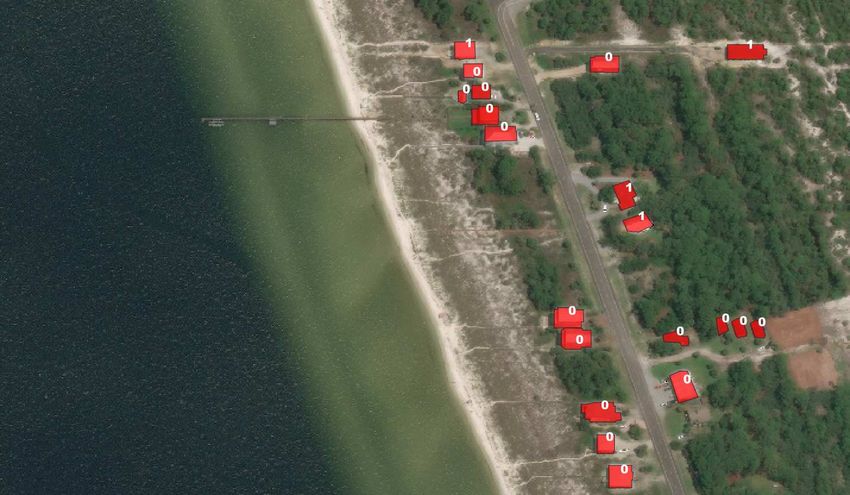
problem and address operational concerns of the HADR and             hurricanes [20, 27, 24, 13]. However, since each scale in
emergency response community.                                        this corpus is specifically scoped to a limited set of disaster
                                                                     types and is generally meant for in-person damage assess-
2. Related Work                                                      ment, the scales cannot be simultaneously used to assess
                                                                     building damage by multiple disasters in satellite imagery.
    Assessing damage from satellite imagery, especially for          There are some notable attempts to assess multiple types of
disparate disaster types, is a complicated task. Intuitively,        disasters. The HAZUS software from FEMA [11] is used to
it is easy to imagine that different disasters—for example,          assess earthquakes, floods, and hurricanes. More generally,
floods versus fires—would impact buildings in drastically            the FEMA Damage Assessment Operations Manual [10] de-
different ways. In order to train robust building damage             scribes damage qualitatively, but mostly relies on in-person
assessment models, datasets that can provide imagery from            assessments and provides specific criteria only for residen-
multiple types and severities of disasters are critical.             tial dwellings. As a result, there does not exist a standard
                                                                     scale for assessing damage across damage types from aerial
2.1. Existing data sources                                           imagery.
    Existent satellite imagery datasets that contain damaged
buildings cover only single disaster types, with different           3. Dataset Details
labeling criteria for damaged structures [14, 4, 28, 12].               In this section we describe the xBD dataset in detail, in-
    Furthermore, there are limited datasets that provide la-         cluding the image collection considerations, damage scale,
bels for forces of nature (fire, water, wind, etc.) that caused      annotation process, and quality control. We also show statis-
damage to a building visible in satellite imagery. Related           tics about the dataset that describe the diversity, scale, and
datasets [9, 15] provide derivative location information of          depth of the imagery.
where these forces may occur, but they do not contain im-               The dataset consists of the following: building polygons,
agery of the damaged structures themselves. From an op-              which are granular representations of a building footprint;
erational perspective, it is much more useful to be able to          ordinal regression labels for damage, which rate how dam-
classify a building as, for example, “damage level 5 caused          aged a building is on an increasing integer scale; multi-class
by fire and wind” as opposed to simply “damage level 5.”             labels, which relate all the environmental factors that caused
For any given disaster, currently it is too difficult and time       the damage seen in the imagery; and environmental factor
consuming to assess which factors damaged a given build-             bounding boxes and labels, which are a rough approxima-
ing to any level of granularity. It is simply assumed that a         tion of the area covered by smoke, water, fire, and other
tornado caused wind damage, a wildfire caused fire-related           environmental factors.
damage, and more. However, this ignores secondary issues
that arise because of natural disasters, such as fires that start    3.1. Motivating processes for image collection
after earthquakes, wind damage associated with flooding dis-
                                                                         In collaboration with imagery analysts from the Califor-
asters, and more. A lack of datasets for this problem directly
                                                                     nia Air National Guard, we identified the process by which
impedes any potential for model development.
                                                                     human analysts currently label building damage from satel-
    Similarly, there are few public datasets of satellite im-        lite imagery and the implicit decisions they make in order
agery with associated bounding boxes and labels for en-              to provide insights to first responders. The process is as
vironmental factors such as smoke, water, lava, and fire.            follows: when a disaster occurs, analysts receive aerial and
Existence of these environmental factors in the satellite im-        satellite imagery of the impacted regions from state, federal,
agery provides insights that can aid HADR image analysts             and commercial sources. Analysts make an initial overall
in disambiguating the causal factors and severity of building        assessment of what sub-regions look the most damaged and
damage.                                                              further analyze, identify, and count the number of structures
    Last, many available datasets present multi-view imagery         damaged. The scale used to assess the damage as well as the
for change detection, land classification, and other tasks [7,       types of structures that will be assessed depend on the type of
6, 2, 18]. Imagery from these datasets can span multiple             disaster, requesting agency, and use case for the assessment.
visits over one site and provide a rich resource for any sort of         This process informed a set of criteria that guided the
time-series imagery analysis. xBD emulates these datasets            specific data we targeted for inclusion in the dataset, as well
and provides pre- and post-disaster imagery over consistent          as weaknesses of the current damage assessment processes.
sites for additional environmental context.                          Each disaster is treated in isolation. The process human an-
                                                                     alysts use is not repeatable or reproducible across different
2.2. Assessment scales
                                                                     disaster types. This irreproducible data presents a major
   There is a large corpus of literature that addresses how to       issue for use by machine learning algorithms; different disas-
assess damage after disasters such as fires, earthquakes, and        ters affect buildings in different ways, and building structures

                                                                    11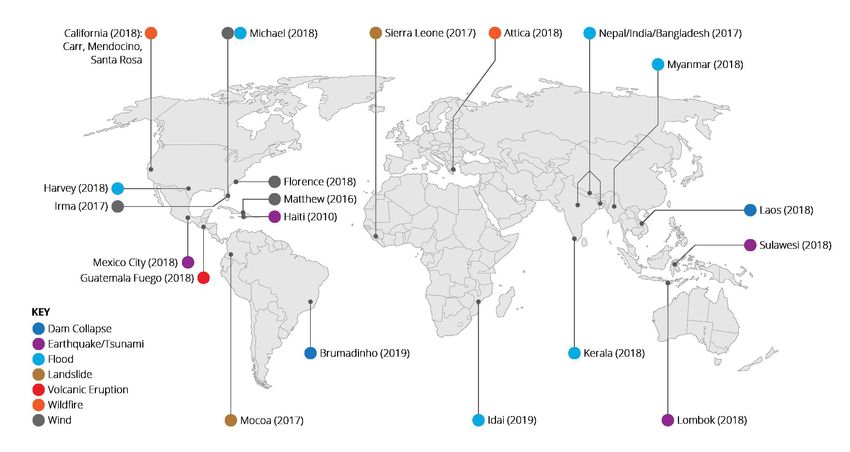
Figure 2: Disaster types and disasters represented in xBD over the world.

vary from country to country, so determinism in the assess-         Assessment Operations Manual [10], the Kelman scale [21],
ment is a necessary property to ensure machine learning             and the EMS-98 [16]. Furthermore, various literature from
algorithms can learn meaningful patterns. Therefore, to en-         the GIS community [5, 30, 8], paired with expert insights
sure a holistic view of building damage, we source imagery          from the California and Indiana Air National Guards and the
from a variety of disaster types across many countries and          US Air Force, help ground the scale in operational relevance.
environments. Table 2 lists all disasters in xBD and their          Assessing damage via satellite imagery is a proxy for the real
corresponding disaster types.                                       task, which requires on-the-ground human analysts using
    An additional consideration for the dataset is the inclusion    these cited scales to assign a metric of damage based on the
of labeled environmental factors such as smoke, landslide,          functionality of the building, not its looks. It is not simple
and water. Human analysts implicitly acknowledge the ex-            to reconcile this highly objective task of assessing function-
istence of these factors, which affects their assessment as         ality in person with assessing functionality from top-down
they mentally categorize the type of damage to expect. xBD          satellite imagery. As such, this scale is not meant as an au-
contains explicit labels to assist any downstream machine           thoritative damage assessment rating, but it does provide the
learning task in accomplishing the same categorization.             first attempt to create a unified assessment scale for building
    A clear understanding of what buildings do not look like        damage in satellite imagery across multiple disaster types,
is necessary when training models to look for buildings,            structure categories, and geographical location. Imagery an-
damaged or otherwise. Explicit techniques to establish this         alysts who provide preliminary building damage assessment
understanding exist; one example is hard negative mining            as well as related machine learning applications would find
[26, 25]. In order to support such techniques, we included a        this scale to be applicable.
large amount of satellite imagery in xBD that may contain              The Joint Damage Scale ranges from no damage (0) to
objects such as vehicles or natural features but no buildings.      destroyed (3). This granularity is based on satellite imagery
                                                                    resolution, available imagery features, and operational use-
3.2. Joint Damage Scale
                                                                    fulness. The descriptions of each damage level have been
   To address the lack of a scale for building damage as-           generalized to handle the wide variety of disasters present
sessment that covers the various types of damage in this            in xBD. The scale allows room for analyst discretion, which
satellite imagery dataset, we present the Joint Damage Scale        can result in some amount of label noise. Although such
(Table 3), based mainly on HAZUS [11], FEMA’s Damage                nuance is not ideal from an objective assessment standpoint,

                                                                   12
it allows analysts to gracefully handle tough cases that fall
between classification boundaries. Figure 5 and Appendix
Figure 6 show examples of what it means to be in one of
these categories.
    Due to the limitations presented by the modality of satel-
lite imagery, such as resolution, azimuth, and smear [29], this
scale presents a best-effort trade-off between operational rel-
evance and technical correctness, and thus cannot accommo-
date the degree of precision that a scale meant for in-person,
human assessment provides.

                                                                     Figure 4: Polygons over a small part of the coast of Florida
                                                                     with damage labels. Imagery from DigitalGlobe.

                                                                     from xView 1.0 [22] with significant alterations to account
                                                                     for the initial round of automated labeling. The first stage
                                                                     consists of global verification where all annotators verify
                                                                     the orientation, positioning, and fidelity of all automatic and
                                                                     human-extracted polygons. After all polygons are verified,
                                                                     all human-annotated labels are verified.
Figure 3: Joint Damage Scale descriptions on a four-level                The second stage uses a targeted, experienced set of an-
granularity scheme.                                                  notators to check for continuity of polygons, granularity of
                                                                     multi-class labels, empty chips, and any disagreeing labels.
                                                                         The final, third stage relies on expert annotators that con-
3.3. Polygons                                                        sist of the authors, HADR subject matter experts, and remote-
   Polygons for all buildings are provided in standard, well-        sensing/satellite imagery experts who randomly sample 4%
known text representation conformant to the ISO/IEC 13249-           of all individual tasks. If any task is found to be incorrect,
3:2016 standard [19]. Polygons will be provided in terms             the entire batch—which itself consists of many tasks—is
of their latitude and longitude as well as their respective          re-submitted for annotation and sent back for expert verifica-
pixel location in a given swath of imagery. Structures that          tion.
are below a set size in terms of square pixels will not be           3.6. Targeted dataset statistics
annotated in the dataset.
   Bounding boxes for environmental factors are rough and               All imagery for xBD is sourced from DigitalGlobe.1 Digi-
potentially overlap annotated buildings as well. These boxes         talGlobe provides high-resolution imagery at ∼0.5m ground
are provided for a relative understanding of the environment.        sample distance, which provides ample resolution for this
                                                                     labeling task. Furthermore, we are able to obtain pre- and
3.4. Multi-class labels                                              post-disaster imagery in multi-band (3, 4, or 8) formats,
    We provide multi-class labels for environmental fac-             which give xBD greater representational capacity. Each im-
tors that caused damage to structures. These labels are              age is also accompanied by metadata such as “sun azimuth”
“fire”, “water”, “wind”, “land shift”, and “other” in the            and “off-nadir”, which enable data processing pipelines to
form of a many-hot vector (i.e., a vector in the form of             account for various skews in the imagery itself. The imagery
[0, 1, 0, 0, 1, 0, ...], where a 1 is present at the index of the    consists of 22 different disasters and is gathered from 15
correct classes). These labels are high level and meant to           countries (Figure 2) at various times of the year. Disasters
provide a coarse level of discrimination to maintain a low           were picked on the basis of what impact people often and at a
level of noise in this set of annotations.                           high severity. Furthermore, disasters had to have a range on
                                                                     their levels of severity, otherwise their impact on buildings
3.5. Quality control                                                 would not be differentiable enough to provide good labels.
                                                                        Overall, xBD will provide approximately 700,000 build-
   Quality control is an essential part of creating an accu-
                                                                     ing polygons with ordinal damage and multi-class damage
rate dataset with many labels and often complicated poly-
gons. A three-stage quality control process was adapted                  1 https://www.digitalglobe.com/

                                                                    13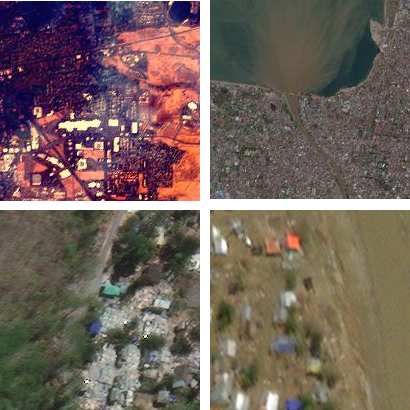
causal labels, as well as approximately 1,000 environmental        localization is not high. The majority of the difficulty relies
factor bounding boxes with corresponding class labels. The         on the fine-grained regression and classification required to
distributions over the labels are unknown at this time, but        accurately assess building damage.
figures and exact numbers will be provided once the entire
data collection process has ended.                                 4.3. Challenge restrictions
                                                                      To better accommodate operational use cases, the data
3.7. Unique dataset features
                                                                   used for inference in the challenge will be purposefully
    As briefly covered in Section 2, xBD presents many at-         lowered in resolution in a stochastic fashion. Since high-
tributes that are not available in other datasets that could be    resolution imagery cannot be guaranteed for all parts of the
used for this task.                                                world, for all disasters, around the clock, any models created
    xBD contains imagery from the majority of common dis-          must work across dynamic resolution limitations.
aster types labeled with a common, expert-verified damage             As with xView 1.0, inference for any submitted model
assessment scale. By including vastly different modes of           will be limited to CPU only with an upper limit on computa-
damage in the dataset, we provide a much more robust view          tion time per image.
of damage than related datasets.
    The dataset also has large geographical diversity. In par-     5. Potential Use Cases
ticular, imagery contains buildings in both highly dense and
                                                                       We provide a brief, non-exhaustive list of compelling
hyper-sparse settings. This range presents difficulties for
                                                                   use cases for xBD that are both operationally useful and
proper localization methods. Furthermore, since imagery
                                                                   academically interesting.
is sourced from around the world, buildings are organized
                                                                       Obstructed road segmentation. The dataset includes
and designed in different ways, providing a representational
                                                                   images of many roads that are broken, covered with a variety
complexity not present in existent literature.
                                                                   of debris, flooded, and otherwise obstructed. Unsupervised
                                                                   models already excel at road segmentation in satellite im-
4. Challenge                                                       agery [3, 23, 17], but limited literature currently addresses
    xBD is being released in conjunction with the second           segmentation and identification of roads with obstructions.
iteration of the global xView challenge. For the purposes          Models that can detect obstructed roads would provide ad-
of the challenge, the dataset is used in a specific fashion        vanced routing capabilities to first responders and disaster
that balances research interest and the operational concerns       planners who need to know how to navigate through a disas-
of various relief-providing agencies, but this use does not        ter environment.
preclude it from being used for other tasks.                           Routing across obstructed roads. As an extension to
                                                                   the previous use case, xBD could also be used as a dataset
4.1. Challenge statement                                           for automatic route planning across obstructed or no-longer-
   xBD provides building polygons, ordinal regression la-          usable roads. Not much literature exists that targets this
bels for building damage, and multi-class labels for environ-      problem, partially due to a lack of datasets providing ob-
mental factors that caused the damage. Given training data,        structed roadways.
the challenge is to create models and methods that can ex-             Force of nature identification. xBD provides bounding
tract building polygons and assess the building damage level       boxes and labels for many environmental factors—such as
of polygons on an ordinal scale. Furthermore, the models           fire, water, and lava—that cause damage. It is essential for
and methods must assign an additional multi-class label to         first responders to know where any of these factors may be
each polygon that indicates which natural force caused the         present. It is possible to create robust detection models for
damage to the building.                                            this task with the data provided in xBD.

4.2. Performance metric                                            6. Conclusion
    A metric for scoring the xView 2.0 challenge needs to             xBD presents the largest satellite imagery dataset for
smoothly combine scores for the tasks of regression, clas-         building damage assessment with over 700,000 labeled build-
sification, and localization. An ideal metric would weight         ing instances covering over 5,000 km2 of imagery.
these tasks from high to low in their listed order. xView             Furthermore, xBD contains labeled data about environ-
1.0 had to make explicit design trade-offs which resulted in       mental factors and hazards that can be used to aid building
certain classes of objects being scored higher for accurately      damage assessment or other research tasks not considered
localizing them. In the case of xView 2.0, every disaster type     by the xView 2.0 challenge.
is treated as equally important, but due to the prevalence of         By combining insights from disaster recovery and emer-
models that can localize building polygons, the weighting for      gency response experts from many US Government agencies,

                                                                  14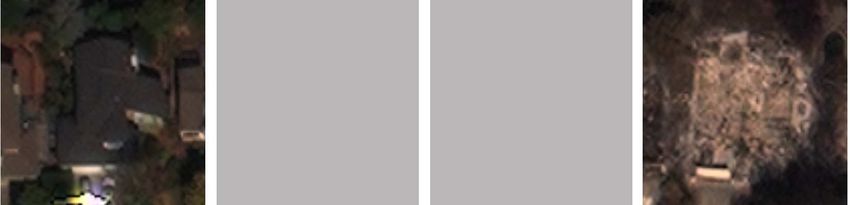
Figure 5: (From left to right) “No damage”, “minor”, and “major” wind damage. “Destroyed” example not available yet.

we are able to generate a high-quality dataset for research                     puter Vision and Pattern Recognition Workshops (CVPRW),
purposes while maintaining operational relevance.                               pages 197–1973. IEEE, June 2018. 5
                                                                          [4]   S. A. Chen, A. Escay, C. Haberland, T. Schneider, V. Staneva,
Acknowledgements: The authors would like to thank                               and Y. Choe. Benchmark Dataset for Automatic Damaged
Phillip SeLegue (California Department of Forestry and Fire                     Building Detection from Post-Hurricane Remotely Sensed
Protection), Major Megan Stromberg and Major Michael                            Imagery. arXiv:1812.05581 [cs], Dec. 2018. 2
Baird (California Air National Guard), Colonel Christopher                [5]   L. Chiroiu and G. André. Damage Assessment Using High
Dinote (Joint Artificial Intelligence Center), and many oth-                    Resolution Satellite Imagery: Application to 2001 Bhuj, India,
ers from the Indiana Air National Guard, United States                          Earthquake. Proceedings of the 7th National Conference on
                                                                                Earthquake Engineering: Urban Earthquake Risk, page 13,
Geological Survey, National Oceanic and Atmospheric
                                                                                Nov. 2001. 3
Administration, National Aeronautics and Space Admin-
                                                                          [6]   G. Christie, N. Fendley, J. Wilson, and R. Mukherjee. Func-
istration, Federal Emergency Management Agency, and
                                                                                tional Map of the World. In 2018 IEEE/CVF Conference on
the city of Walnut Creek, CA, for their subject matter
                                                                                Computer Vision and Pattern Recognition, pages 6172–6180.
expertise and assistance in creating xBD and the xView                          IEEE, June 2018. 2
2.0 challenge. We acknowledge the DigitalGlobe Open
                                                                          [7]   R. C. Daudt, B. Le Saux, A. Boulch, and Y. Gousseau. Ur-
Data program for the imagery used in this dataset.                              ban Change Detection for Multispectral Earth Observation
                                                                                Using Convolutional Neural Networks. In IGARSS 2018 -
©2019 IEEE. All Rights Reserved. This material is based                         2018 IEEE International Geoscience and Remote Sensing
upon work funded and supported by the Department of De-                         Symposium, pages 2115–2118. IEEE, July 2018. 2
fense under Contract No. FA8702-15-D-0002 with Carnegie                   [8]   F. Dell’Acqua and D. A. Polli. Post-Event Only VHR Radar
Mellon University for the operation of the Software Engineer-                   Satellite Data for Automated Damage Assessment: A Study
ing Institute, a federally funded research and development                      on COSMO/SkyMed and the 2010 Haiti Earthquake. Pho-
center.                                                                         togrammetric Engineering & Remote Sensing, 77(10):1037–
[DISTRIBUTION STATEMENT A] This material has been                               1043, Oct. 2011. 3
approved for public release and unlimited distribution.                   [9]   I. Demir, K. Koperski, D. Lindenbaum, G. Pang, J. Huang,
Please see Copyright notice for non-US Government use                           S. Basu, F. Hughes, D. Tuia, and R. Raska. DeepGlobe 2018:
and distribution. DM19-0332                                                     A Challenge to Parse the Earth through Satellite Images. In
                                                                                2018 IEEE/CVF Conference on Computer Vision and Pattern
                                                                                Recognition Workshops (CVPRW), pages 172–17209. IEEE,
References                                                                      June 2018. 2
                                                                      [10]      Federal Emergency Management Agency. Damage Assess-
 [1] M. K. V. Aalst. The Impacts of Climate Change on the Risk                  ment Operations Manual: A Guide to Assessing Damage and
     of Natural Disasters. Disasters, 30(1):5–18, 2006. 1                       Impact. Technical report, Federal Emergency Management
 [2] M. Bosch, Z. Kurtz, S. Hagstrom, and M. Brown. A Multiple                  Agency, Apr. 2016. 2, 3
     View Stereo Benchmark for Satellite Imagery. In 2016 IEEE        [11]      Federal Emergency Management Agency. Hazus Hurricane
     Applied Imagery Pattern Recognition Workshop (AIPR), pages                 Model User Guidance. Technical report, FEMA, Apr. 2018.
     1–9, Oct. 2016. 2                                                          2, 3
 [3] A. Buslaev, S. Seferbekov, V. Iglovikov, and A. Shvets. Fully    [12]      R. Foulser-Piggott, R. Spence, K. Saito, D. M. Brown, and
     Convolutional Network for Automatic Road Extraction from                   R. Eguchi. The Use of Remote Sensing for Post-Earthquake
     Satellite Imagery. In 2018 IEEE/CVF Conference on Com-                     Damage Assessment: Lessons from Recent Events, and Fu-

                                                                     15
ture Prospects. Proceedings of the Fifthteenth World Confer-          J. Schwarz, R. Schwarze, I. Seifert, J. Seifert, and L.-F.-U.
       ence on Earthquake Engineering, page 10, 2012. 2                      Innsbruck. Methods for the Evaluation of Direct and Indirect
[13]   C. J. Friedland. Residential Building Damage from Hurricane           Flood Losses. Proceedings of the 4th International Sympo-
       Storm Surge: Proposed Methodologies to Describe, Assess               sium on Flood Defence, page 10, May 2008. 2
       and Model Building Damage. PhD thesis, Louisiana State           [28] United States Geological Survey. Building Damage Assess-
       University, 2009. 2                                                   ment in the City of Mocoa. United Nations Institute for
[14]   A. Fujita, K. Sakurada, T. Imaizumi, R. Ito, S. Hikosaka,             Training and Research, Apr. 2017. 2
       and R. Nakamura. Damage Detection from Aerial Images             [29] W. A. Wahballah, T. M. Bazan, and M. Ibrahim. Smear effect
       via Convolutional Neural Networks. In 2017 Fifteenth IAPR             on high-resolution remote sensing satellite image quality. In
       International Conference on Machine Vision Applications               2018 IEEE Aerospace Conference, pages 1–14, Mar. 2018. 4
       (MVA), pages 5–8. IEEE, May 2017. 2                              [30] F. Yamazaki, K. Kouchi, M. Matsuoka, M. Kohiyama, and
[15]   L. Giglio, J. T. Randerson, and G. R. van der Werf. Analysis          N. Muraoka. Damage Detection From High-Resolution Satel-
       of Daily, Monthly, and Annual Burned Area Using the Fourth-           lite Images for the 2003 Boumerdes, Algeria Earthquake.
       Generation Global Fire Emissions Database (GFED4). Jour-              Proceedings of 3rd International workshop Remote Sensing
       nal of Geophysical Research: Biogeosciences, 118(1):317–              for Post-Disaster Response, page 13, Sept. 2005. 3
       328, 2013. 2
[16]   G. Grünthal, R. Musson, J. Schwarz, and M. Stucchi. EMS-98
       (European Macroseismic Scale). Technical report, European
       Seismological Commision, 1998. 3
[17]   C. Henry, S. M. Azimi, and N. Merkle. Road Segmentation in
       SAR Satellite Images with Deep Fully-Convolutional Neural
       Networks. IEEE Geoscience and Remote Sensing Letters,
       15(12):1867–1871, Dec. 2018. 5
[18]   D. Ienco and R. Gaetano. TiSeLaC : Time Series Land Cover
       Classification Challenge. TiSeLaC : Time Series Land Cover
       Classification Challenge, Jan. 2007. 2
[19]   Information technology – Database languages – SQL multi-
       media and application packages – Part 3: Spatial. Standard,
       International Organization for Standardization, Geneva, CH,
       Jan. 2016. 4
[20]   M. Ji, L. Liu, and M. Buchroithner. Identifying Collapsed
       Buildings Using Post-Earthquake Satellite Imagery and Con-
       volutional Neural Networks: A Case Study of the 2010 Haiti
       Earthquake. Remote Sensing, 10(11):1689, Nov. 2018. 2
[21]   I. Kelman. Physical Flood Vulnerability of Residential Prop-
       erties in Coastal, Eastern England. PhD thesis, University of
       Cambridge, U.K., 2002. 3
[22]   D. Lam, R. Kuzma, K. McGee, S. Dooley, M. Laielli,
       M. Klaric, Y. Bulatov, and B. McCord. xView: Objects
       in Context in Overhead Imagery. arXiv:1802.07856 [cs], Feb.
       2018. 4
[23]   V. Mnih and G. E. Hinton. Learning to Detect Roads in High-
       Resolution Aerial Images. In Computer Vision – ECCV 2010,
       volume 6316, pages 210–223. Springer Berlin Heidelberg,
       Berlin, Heidelberg, 2010. 5
[24]   S. Okada and N. Takai. Classifications of Structural Types
       and Damage Patterns of Buildings for Earthquake Field Inves-
       tigation. Journal of Structural and Construction Engineering
       (Transactions of AIJ), 64(524):65–72, 1999. 2
[25]   A. Shrivastava, A. Gupta, and R. Girshick. Training Region-
       Based Object Detectors with Online Hard Example Mining.
       arXiv:1604.03540 [cs], Apr. 2016. 3
[26]   K.-K. Sung. Learning and Example Selection for Object and
       Pattern Detection. PhD thesis, Massachusetts Institute of
       Technology, Mar. 1996. 3
[27]   A. Thieken, V. Ackermann, F. Elmer, H. Kreibich,
       B. Kuhlmann, U. Kunert, H. Maiwald, B. Merz, K. Piroth,

                                                                       16
Appendices
Figure 6: (Top) “Major” and “destroyed” examples for flooding. (Bottom) “No damage” and “destroyed” examples for fire.
Figure 7: The same chip in red/green/blue (left) and red/near-IR/blue (right).
17You can also read