Criteo 101 Investor presentation - February 2020

Page created by Jason Sullivan
 
CONTINUE READING
Criteo 101 Investor presentation - February 2020
Criteo 101
Investor presentation
February 2020
Criteo 101 Investor presentation - February 2020
Safe harbor statement

    This presentation contains “forward-looking” statements that are based on our management’s beliefs and assumptions and on information currently
    available to management. Forward-looking statements include information concerning our possible or assumed future results of operations,
    business strategies, financing plans, projections, competitive position, industry environment, potential growth opportunities, potential market
    opportunities and the effects of competition and other actions by our counterparties.

    Forward-looking statements include all statements that are not historical facts and can be identified by terms such as “anticipates,” “believes,”
    “could,” “seeks,” “estimates,” “intends,” “may,” “plans,” “potential,” “predicts,” “projects,” “should,” “will,” “would” or similar expressions and the
    negatives of those terms. Forward-looking statements involve known and unknown risks, uncertainties and other factors that may cause our actual
    results, performance or achievements to be materially different from any future results, performance or achievements expressed or implied by the
    forward-looking statements. Forward-looking statements represent our management’s beliefs and assumptions only as of the date of this
    presentation, and nothing in this presentation should be regarded as a representation by any person that these beliefs or assumptions will take
    place or occur. You should read the Company’s most recent Annual Report on Form 10-K filed on March 1, 2019, and in subsequent Quarterly
    Reports on Form 10-Q, including the Risk Factors set forth therein and the exhibits thereto, as well as future filings and reports by the Company,
    completely and with the understanding that our actual future results may be materially different from what we expect. Except as required by law,
    we assume no obligation to update these forward-looking statements publicly, or to update the reasons actual results could differ materially from
    those anticipated in the forward-looking statements, even if new information becomes available in the future.

    This presentation includes certain non-GAAP financial measures as defined by SEC rules. As required by Regulation G, we have provided a
    reconciliation of those measures to the most directly comparable GAAP measures, which is available in the Appendix slides.

2
Criteo 101 Investor presentation - February 2020
Stock information & key financials

       Ticker:                               CRTO                        FY 2019 Financials
                                                                       Revenue:                       $2,262M, +1%**
       Stock Exchange:                       NASDAQ Global Market
                                                                       Revenue ex-TAC:                $947M, +0.3%**
       CUSIP:                                226718104
                                                                       Adjusted EBITDA:               $299M, -7%**

       Shares issued*:                       66.2M                     Adjusted EBITDA margin:        32% of Revenue ex-TAC

                                                                       Free Cash Flow:                $125M, 42% of adj. EBITDA
       Share capital structure*:
                                                                                   Revenue ex-TAC breakdown (Q4 2019):
                        Founders, NEOs, Management & Employees
                                           5%                                             New solutions
                                                          Idinvest &                         16%
                            Treasury stock              Yahoo! Japan
                                  6%                          1%

                                                                                                                       Core solution
                                Free float
                                                                                                                           84%
                                  89%

    * As of December 31, 2019
3
    ** At constant currency
Criteo 101 Investor presentation - February 2020
Our mission

              To power the world’s

              MARKETERS
        with trusted and impactful
                advertising
Criteo 101 Investor presentation - February 2020
We have unique assets to win

    Global Footprint                Advertisers & Publishers             Data & Reach
    100+ markets                    20,000+ advertisers                  2B+ Criteo IDs
    29 offices in 19 countries      Incl. 1,000+ brands
                                    4,500+ direct publishers

    Technology                      Financial Model                      Talent
    14 years of AI Tech expertise   Profitable, with ability to invest   2,750+ employees
    1,300B+ ads served in 2018      Cash generative                      680 in R&D

5
Criteo 101 Investor presentation - February 2020
Criteo leadership team

        JB         Megan      Benoit     Diarmuid        Isabelle          Ryan            Denis
      Rudelle      Clarken   Fouilland      Gill       Leung-Tack         Damon            Collin
      Chairman      CEO        CFO          CTO          Global        General Counsel     People
    & Co-founder                                      Communications                     Management

       Jess        Kenneth    Shruthi     Thomas        Cédric           Geoffroy          Alex
      Breslav        Pao     Chindalur   Jeanjean     Vandervynkt         Martin           Valle
     Americas       APAC       EMEA      Platform &       Web          Supply & Retail   App & Store
                                         Operations                       Media
6
Criteo 101 Investor presentation - February 2020
A new CEO to lead the company transformation
    Megan Clarken appointed as Chief Executive Officer, based in Paris, effective November 25, 2019

                                Megan Clarken spent fifteen years in various positions at Nielsen
                                and was recently Chief Commercial Officer of Nielsen Global
                                Media. Born in New Zealand, Megan brings to Criteo extensive
                                global leadership experience and very strong industry expertise.

                                "This is a very exciting time for me to join Criteo," said Megan
                                Clarken. "Criteo has grown into a truly impressive company, with
                                high-quality assets and talented teams, and I'm very honored to
                                lead the company into the next chapter of its development."

7
Criteo 101 Investor presentation - February 2020
Market & Trends
Criteo 101 Investor presentation - February 2020
Digital advertising’s share of global ad budgets continues to grow

                                                              50%

                                                       40%

                                                       2018   2020

9   Source: Zenith Advertising Expenditures Forecast
Criteo 101 Investor presentation - February 2020
Digital ad spend has long overtaken TV ad spend

                                                                                                                         Digital

                         $300B

                                                                                                                                     TV

                          $0B

                             2000       2002       2004       2006       2008        2010   2012   2014   2016   2018   2020       2022

10   Source: MAGNA | Data for 2017 and beyond are forecasts – Created with Datawrapper
Paid Display is the #1 Ad Spend category globally

                                                      Marketing Budget Allocation by Activities,
                                                                      N=901

                                                                         9%                                       Paid Display
                                                                                    16%
                                                                                                                  Social Media Marketing
                                                                  9%
                                                                                                                  Traditional Marketing (1)

                                                                                                                  Email Marketing
                                                             9%                               14%
                                                                                                                  Content Marketing

                                                                                                                  SEO (2)
                                                              9%                                                  Search Advertising (PPC)
                                                                                       13%                        Landing Page/Website
                                                                       10%
                                                                              10%                                 Affiliate Marketing

                                                                                     (1) Print, Direct Mail, TV, Radio Ads
                                                                                     (2) Search Engine Optimization

11   Source: Criteo & Euromonitor, State of Ad Tech 2019
Mobile marches on
     Northern Europe and Japan are mobile leaders

                                                       Sweden                   60%                               New Zealand     44%
                                                       Norway                   57%                               Austria         44%
                                                       United Kingdom 55%                                         Switzerland     43%
                                                       Japan                    55%                               Brazil          43%
                                                       Denmark                  51%                               Taiwan          42%

                                                      Germany                   50%                               Italy           41%

                                                       Finland                  49%                               United States   39%
                                                       Netherlands              49%                               France          39%
                                                       Spain                    48%                               Belgium         38%

                                                       South Korea              47%                               Canada          33%

                                                       Turkey                   46%                               Poland          33%

                                                       Australia                46%                               Russia          30%

                    Source: Criteo, Q2 2018.   Base: sales weighted aggregate, Apps excluded (see Methodology).

12
The open Internet offers significant opportunity

                                                         Time Spent                            Digital Ad Spend

                                             50%                      50%                30%               70%

                                                                        Open Internet   Google/Facebook

13   Based on Nielsen US DCR trends, eMarketer, ExchangeWire, IDC
Our market opportunity is enormous
                                                                                                                        TOTAL

                                                                      $11B                                       $36B   $47B
             Awareness                                                    $3B                                    $12B

           Consideration                                                  $2B                                    $10B

            Conversion                                                    $6B
                                                                                                                 $14B
           incl. Retargeting                                               $4B

                                                         Retailers                    Direct & Indirect Brands

      Advertising spend on Display and Video – Global open Internet excluding China
14    Source: Criteo, September 2019
Criteo Platform
Criteo Platform

         Criteo Marketing Solutions                         Solutions                         Criteo Retail Media

                       Advertisers                        Marketing Goals             Retailers                    Brands

                                                            Awareness

                                                                                      Supply-side                 Buy-side
      Web                    App         Store             Consideration              Advertising               Advertising
                                                                                      Technology                Technology

                                                            Conversion

     Self-registration and           Onboarding &                            Campaign creation &
             billing                  integration      Management Center       management
                                                                                                         Insights & analytics

                                         Product                             Dynamic Creative
        Lookalike Finder
                                     Recommendations       AI Engine           Optimization+
                                                                                                        Predictive Bidding

          $900B+                            2B+                                       120+                    10B+
      eCommerce Sales                    Criteo IDs      Shopper Graph      Intent signals/shopper      Products & Services
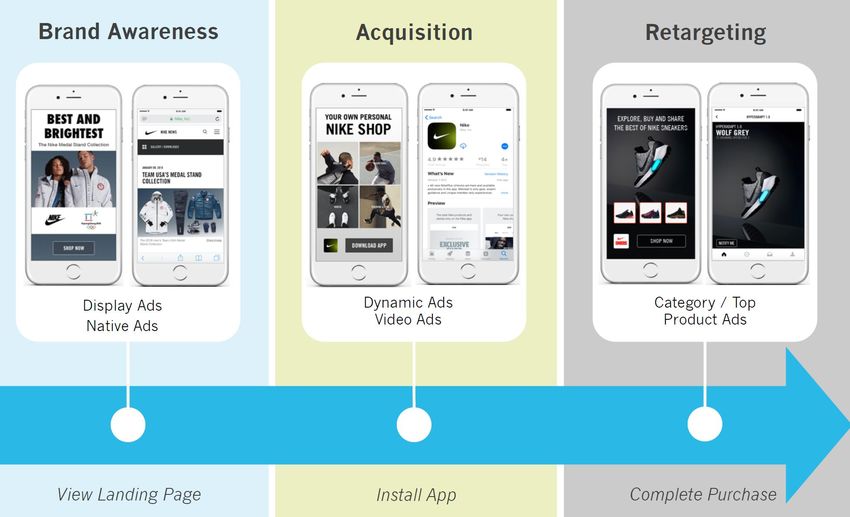
16
Marketing Solutions
     Full-funnel capability addresses the entire customer journey

                               Awareness                   Consideration                Conversion

                            Generate interest in your   Get people to consider your   Encourage interested
         Marketing Goals
                             products or services           products or services       people to purchase

                                Brand Awareness               Traffic: Web, App        Conversion: Web, App
         Ad Objectives
                                   Video Views                  App Installs            Store Conversions

                                     Reach                          Visits
                                                                                      Purchase (Conversions)
         Optimization
                                      Views                        Installs

17
Retail Media
     Enables brands to connect with key retail audiences at all stages of their shopping journey

                                                        SUPPLY

                                       Supply-side Advertising Technology

                    Awareness                    Consideration                              Conversion

                                                                                                           Sargento Swiss
                                                                                                           Cheese Slices
                                                                                                               $3.79

                       Standard                   Commerce Display                          Sponsored Products

                                         Flexible range of targeting and creative options

                                        Buy-side Advertising Technology

                                                      DEMAND

18
Criteo Shopper Graph
Criteo Shopper Graph: the world’s largest set of shopper data
     A unified understanding of a shopper’s online journey and real-time shopping intent data

          Identity Graph:                                              Interest Map:
          2B Criteo IDs cross device,                                  anonymized
          same device, and                                             shopper interest
          online/offline                                               across products

                                             Measurement Network:
                                             conversion and sales
                                             across retailers

20
Criteo Identity Graph
     Matching of identifiers cross device, same device, and online/offline

     Criteo’s advantages                           Persistent
       • ~75% of clients participate                 • 95% of Criteo IDs contain long-term
                                                       identifiers such as hashed emails
       • 2B Criteo IDs
                                                       or app identifiers besides cookies
       • Global coverage

                                                   Participation
     Open, transparent, secure, fair
                                                     • Opt-in by sending hashed identifiers
       • Encrypted and double-hashed                   via OneTag or App Events SDK
         personal identifiable information (PII)
       • Access at no additional cost

21
Criteo Interest Map
     Anonymized shopper interest across products

      Criteo’s advantages                      Open, transparent, secure, fair
        • Access to 10B+ products                • Data isolated unless opt-in
        • Large consumer reach worldwide         • All data anonymized
        • Understand performance of              • No free riders
          product attributes
                                                 • Contribution capped at 15% of pool
        • 120+ shopping intent signals
                                                 • Access at no additional cost
          evaluated per shopper
        • 21B product interactions per month
                                               Participation
        • 600TB daily shopper data
                                                 • Opt-in to share anonymized data
                                                 • Opt-out to use client data only

22
Criteo Measurement Network
     Conversion and sales across retailers

      Criteo’s advantages                      Open, transparent, secure, fair
        • SKU-level sales attribution for        • All retailer data anonymized
          brands across retailers
                                               Participation
        • Deterministic measurement
                                                 • When clients work with us, data within
        • Nearly 100 participating retailers       and across retailers is aggregated
        • $900B+ annual ecommerce sales

23
Identity resolution with Criteo Shopper Graph

                                                                    Benefits
     •   3 data collectives: Identity, Interest, and
         Measurement

     •   Links multiple identifiers and data points
         to a persistent identifier
                                                        Shopper                Performance
     •   Allows advertisers to recognize the           experience                tracking
         customer across all channels

     •   Expands the number of customers our
         clients are able to reach

                                                       Accuracy                  Privacy

24
Identity resolution and Shopper Graph guiding principles

     Central to our approach of the open Internet, and different from what clients may experience
     with walled-gardens, the design and governance of the Shopper Graph is based on strict and
     differentiated guiding principles:

     Openness                       Fairness                        Transparency                    Security
     All clients contributing       The value gained by             Clients' contribution           We apply the highest
     data can in return             participating clients           and sharing of data             data security and
     benefit from the               largely exceeds their           are based on a clear            user privacy
     collective dataset,            individual                      and permission-                 standards to the
     access Criteo IDs and          contribution to the             based usage by                  Shopper Graph
     relevant KPIs of their         graph                           Criteo for the mutual
     campaigns                                                      benefits of all
                                                                    participants

25
Privacy: a key element of the identity graph
                                                                                                                                      WE DO…
     •       Criteo’s fundamental Privacy by Design
                                                                                                       -    Collect only the data that is required to deliver our service
             approach protects and safeguards customer
                                                                                                       -    Automatically complete hashing process, independent of
             data across all standards, processes, and                                                      how we receive email lists
             protocols                                                                                 -    Only store SHA256 hash of MD5 hash of emails*
                                                                                                       -    Minimize data retention
                                                                                                       -    Keep only the last 90 days of data in the graph
     •       Consumers can easily access our Privacy Policy
             and opt-out using Ad Choices
                                                                                                                                   WE DON’T…
     •       Data-hashing algorithms ensure that no directly                                           -    Record any sensitive information
             identifying information* (name, email address) is                                         -    Record directly identifying information
                                                                                                       -    Store any original files containing emails
             stored in plain form                                                                      -    Use or store client’s audience data for any other purpose
                                                                                                       -    Use any 3rd-party owned or managed servers

         * A hash of an email creates a series of characters that doesn’t permit individual identification. For example, a hash of name@mail.com would be
         98307a5ba02fa1072b8792f743bd8b5151360556b8e5a6120fa9a04ae02c88c0. User identifiers (IDFA, AAID, Criteo Cookie ID) are randomly generated IDs that are not linked to or
         derived from any directly identifying information, and therefore don’t need to be hashed. Both hashed emails and user identifiers are considered “pseudonymous data”, a
26       subcategory of personal data that does not allow the direct identification of the data subject.
AI Engine
Proven machine-learning technology
     Shopper-level optimization to drive CTR, CR, Order Value, or Product Margin

                                                       AI Engine

                                                                  Dynamic
                                 Lookalike        Product                         Predictive
                                                                   Creative
                                   Finder     Recommendation                       Bidding
                                                                 Optimization+

                                                > 20,000 tests/year
                                      run on new performance algorithms and variables

28
Lookalike Finder algorithms create relevant audiences

                    Audience previously        Consumers likely to be     Creation of a similar   Dedicated
                    targeted or exposed to a   interested in and engage   audience                campaign
                    specific category of
                    products or services

29
Offering shoppers the best product discovery experience
     Leveraging the power of our shopper graph and world-class algorithms

                          John browses         The Criteo Engine recommends               Products
                          “Bomber              products based on:                         we show John
                          Jacket”
                          on Uniqlo’s site

                                              ✓ Campaign goal

                                              ✓ Visitor’s site navigation

                                              ✓ Recency and frequency of activity

                                              ✓ Product type, price, and category

                                              ✓ Most viewed products on retailer’s site

                                              ✓ And much more...

                                              Product recommendations

30
We have a best-in-class Creative Studio
     Enabling faster roll-out of Awareness and Consideration solutions

                                                                         Creative
                                                                          studio

31
New DCO+ delivers flexible creative formats in real time
     Addressing full-funnel marketing goals

                              AWARENESS          CONSIDERATION             CONVERSION

                              Brand creative   Dynamic Brand creative     Dynamic creative

                                Brand focus       Brand & Product focus      Product focus

         Banner Formats

32
Our Predictive Bidding algorithms are industry-leading

                                     User context            Product behavior         Publisher interaction

                                                    Predictive bidding
                   Standard bidder                  First-price bidder optimization    Second-price bidder optimization

                                 The right bid for the right ad placement at the right time

33
We have immense computational power for real-time processing

                                    10 data centers                >43,000 servers

                                                           Amsterdam (x2)

                                                 Paris (x2)
     Sunnyvale
        CA                Ashburn                                                                                        Tokyo (x2)
                            VA
                 Dallas
                  TX

                                                                                                             Hong Kong

                                                      2 Hadoop clusters
                                                       ~9,800 servers
                                              750K terabytes storage capacity
                                          2K terabytes of random-access memory

                                                                                     Data center locations
34
Criteo AI Engine: Where Artificial Intelligence meets privacy

       A privacy by design    CPM/CPC model:        Trust requires    A European player
       approach since day      an incentive to                          with clear track
       1: data minimization   present relevant   transparency and
                                                                       record in privacy
            approach                ads          control (Adchoice
                                                 icon, cross device
                                                       optout)

35
Client Management Center
We provide enhanced self-service capabilities
     Integrated and modular customer platform
     providing control, visibility and detailed transparency on campaigns

                        Client sign-up &               Campaign                    Analytics &
                          onboarding                  Management                    Insights

                       Autonomous, fast           More control for clients   More transparency and
                         onboarding                  and agencies              insights for clients

                     Accelerated midmarket
                                                  Productivity & retention   Productivity & retention
                        client additions

37
We offer a modular, flexible and progressively open platform
     Self-service, API and managed service delivery options

                                                      Criteo Platform

                                          User Interfaces                          APIs

                                                              Campaigns

                              Objective                       Audiences         Creatives
         Self-service tools

                               Supply                          Coupons          Catalogs

                               Billing                      Event Collection   Integrations

38
39
Targeting the right users with new audience creation options
     Benefiting from Criteo’s unique commerce audience data

               Audiences         Commerce Audiences            Similar Audiences          Custom Audiences

                                 • Choose from 140+        • Similar to your recent    • Web visitors or app users
                                   product interest          web and app users using   • Customer contact lists
                                   categories within our     Lookalike Finder AI       • Offline buyers
                                   Shopper Graph             technology                • Platform audiences
                                   commerce data set

               Users              New customers             New customers              Visitors or Existing customers

               Marketing Goals    Awareness                Awareness                            -

                                  Consideration            Consideration                Consideration

                                          -                Conversion                   Conversion

40
41
42
43
A full end-to-end onboarding flow for midmarket
     For self-service client activation

                     1                               2                           3                             4

           Self-Registration          Campaign Creation             Technical Onboarding             Creative Creation
              1. Contact form             1. Choose the objective   1. Onboarding tools for new      1. Create new banners
                                                                               clients                     from scratch
             2. Business details     2. Identify target audience
                                                                       2. OneTag Integration           2. Update existing
            3. Payment & billing           3. Finalize campaign           (Troubleshooting &                 creative
                   details                   details (Budget, Bid             monitoring)
                                              Strategy, Creative                                     3. Track your creatives
             4. Accept T&C’s                        tracking)           3. Product catalog
                                                                     (Monitoring, Troubleshooting,   4. Manage promotions
                                                                         Advanced settings)               with coupons

44
Criteo Solutions
Criteo Marketing Solutions
 Criteo Dynamic Retargeting

 Benefits
       • Bring shoppers back to buy to drive more sales and increase profitability
       • Gain access to the best inventory
       • Engage shoppers by delivering the right ad at the right price and device with personalized
         product recommendations and 17 trillion ad set variations

What it does
  • Connect across web, mobile, app, social, and video using 120 intent signals
  • Optimize with continuous machine-learning against business objectives
  • Increase mobile app engagement

 Revenue model
   • Revenue = Clicks x CPC
   • Traffic Acquisition Cost (TAC) = CPM x impressions
   • Revenue ex TAC = Revenues – TAC
   • Revenue ex-TAC margin: Approx. 40%

47 •
Criteo Marketing Solutions
 Criteo Customer Acquisition

 Benefits
       • Generate significant new revenue from relevant new customers
       • Discover new customers across a pool that covers 72% of the world’s online shoppers
       • Drive maximum ROI with the industry’s only performance-based acquisition model

  What it does
       • Targets highly relevant shoppers using historic shopping and browsing events from
         Criteo’s identity graph
       • Reaches relevant new customers with user-centric personalized product recommendations
       • Only qualifies relevant shoppers, based on Criteo’s interest map, based on your optimal
         customer using unique, shopper-scoring techniques

  Pricing
       • CPC

48 •
Criteo Marketing Solutions
 Criteo Audience Match

   Benefits                                                What it does
       • Boost sales by re-engaging existing                • Identify audience and campaign objective
         shoppers
                                                            • Pass the audience list to be targeted
       • Bring qualified traffic back to the
                                                            • Match audience with Criteo’s identity graph with
         advertiser’s website
                                                              4B+ global device IDs
       • Capitalize on market leading match rate of
                                                            • Deliver personalized ads to drive engaged
         up to 60%
                                                              traffic to the advertiser’s website

  Use cases

   Loyalty             Seasonal        Offline to online    Top Sellers        Upsell         Upgrade
Audiences that          Seasonal       Offline    Card        Lapsed           Bundle       Audiences likely
may soon churn           Buyers        Buyers    Holders     Shoppers           Offer         to upgrade

  Pricing
       • CPC | CPM*

49 •
         *tentative
Criteo Marketing Solutions
 Criteo Web Consideration

 Benefits
       • Increased reach
       • Greater brand engagement
       • More quality traffic
       • Optimized budget

What it does
  • Identify high-value users that will engage with the brand and bring them to the website
  • Influence users in moments of intent leveraging the Shopper Graph
  • Deliver relevant ads that drive quality traffic while maximizing cost per visit

  Pricing
       • CPM

50 •
Criteo Marketing Solutions
 Manage/App Install/App Retargeting

                                      Creative Formats & Supply
                                       • Primarily use/edit existing advertiser formats

                                       • Single resource dedicated to CS

                                       • ~40% video

                                       • 100% RTB supply

                                      Pricing
                                       • Sell on a CPI*, optimize to CPA**

                                       • Ability to sell on CPC or CPM for brand
                                         campaigns

                                        * Cost per Install
                                        ** Cost per Action
51 •
Criteo Retail Media
Criteo Retail Media                            personalized recommendations based on
                                                shopper’s unique journey
 Sponsored Products

   Benefits
   Offer brands native product recommendation
   based placements that increase conversion

   Budget
   Trade and Performance
                                                                                 DYSON SUPERSONIC HAIR DRYER,
                                                                                         FUCHSIA/IRON
                                                                               259,99 €

       Pricing

       CPC

53 •
Criteo Retail Media
 Sponsored Products Extension                         personalized recommendations based on
                                                      shopper’s unique journey

  Benefits
  Enable brands to retarget customers with relevant
  product recommendations across Criteo’s premium
                                                                                         DYSON Aspirateur
  publisher network                                                                       balai DYSON V7
                                                                                               Animal

                                                                                            398,25 €

  Budget
  Trade and Performance

   Pricing

   CPC

54 •
Criteo Retail Media
 Criteo Reseller Program

 Benefits for Marketplaces
   • Unlock new revenue by reselling Criteo Dynamic Retargeting
   • Boost overall Gross Merchandise Value (GMV)
   • Increase merchant loyalty with proven technology for sales growth

 Benefits for sellers on the
 Marketplace
   • Access best-in-class, commerce marketing technology
   • Drive incremental, high-quality traffic and more sales
   • Activate campaigns immediately – no integration required

55 •
Criteo Retail Media                               dynamic ecommerce features based on
                                                   product catalog, availability, and other
                                                   factors
 Commerce Display

   Benefits
   Enable brands to increase consideration and
   conversion with ecommerce display placements,
   including guaranteed inventory

   Budget                                                                              DYSON SUPERSONIC HAIR DRYER,
                                                                                               FUCHSIA/IRON
                                                                                    259,99 €
   Shopper Marketing and National Media

       Pricing

       CPM

56 •
Criteo Retail Media
 Audience Extension                           branded, standard display

   Benefits
   Enable brands to build shopper audience
   segments and target them across Criteo’s
   premium publisher network
                                                                          DISCOVER

   Budget
   National Media

       Pricing

       CPM

57 •
Clients & Go-to-market
A large opportunity to win new clients

                                 ~80,000   addressable clients worldwide
                            in Retail, Travel and Classifieds (excluding brands)

                                                                                   ~20%
                                                                                   Midmarket
            ~50%                                                                   penetration
            Large Clients
             penetration

59
Direct relationships with many premium commerce
     and brand clients

60
A tailored go-to-market approach to best serve our clients
     Objectives          •1     Adapt sales organization to a multi-solution offering

                         •2     Provide the right level of service to each client

                         •3     Scale operations and enhance profitability

     Client                                                              Telesales
                                    Consultative sales                                               Self-service platform
     tiering
                                       Large Clients                Upper Mid-Market                   Lower Mid-Market

                                    A                  B           C                  D               E                  F
                   Monthly       $200K+            $50K+         $20K+               $10K+          $5K+
Publisher inventory
Extensive supply partnerships ensure broad audience access

                        Direct                          Exchange                            Closed
                     partnerships                        partners                        environments
                4,500 Premium publishers         Long-tail & emerging formats             Additional Reach

                 •   Flexible buying technology: RTB/S2S, Criteo direct bidder, SDK, API
                 •   Any relevant creative formats/environment: IAB, Native, In-App, Video, Google AMP

63
The publisher environment is constantly evolving
     Our sophisticated technology drives more value for publishers

                Changing consumer behavior                               Evolving technology

                Transition to Mobile     Social
                                                                        Native           In App

                 Multiple Devices      Ad Blocking
                                                                     Programmatic    Header Bidding

64
We have always delivered user-friendly ads

     Our Position
     • Promote acceptable ad programs
     • Invest in native formats
     • Support an open tracking standard
     • Define standards for retargeting

     Ad blocking offers an opportunity for players with:
     • The right business model
     • The right technology stack
     • The right expertise in user privacy
     • Premium demand

65
Criteo Direct Bidder
     Direct access to Criteo’s unique demand

       •   Criteo Direct Bidder (CDB) allows Criteo to bid on publisher inventory directly through the ad server
           without the need to funnel demand through Supply Side Platforms (SSPs) or exchanges
       •   Direct integration with publishers gives Criteo a first-party footprint on these inventories
       •   Benefits for the publisher:
           •   all of the Criteo bid goes to the publisher; none is taken by the SSP for fees (typically 10%-20%)
           •   user matching between the Publisher and Criteo is much more timely and complete than matching
               reliant on a third party
           •   +20-40% spend with publishers on the same inventory that was previously accessed through RTB
       •   Launched in Q2 2017, already connected to 4,500 publishers and app developers at the end of 2019

66
Strategy
Our strategic pillars drive our 2020 execution roadmap

             1   Strengthen the Core

             2   Expand Product Portfolio

             3   Explore Strategic Game Changers

             4   Drive Tech & Operations Excellence

68
Product Strategy

                                       API         Self-service    Unbundling

                Brand Awareness                  Planning and Buying

                 Consideration               CRM          Shopper Graph

                                           Measurement            Insights

                  Conversion      Bidder        Recommendation         Incrementality

                                  Viewability           Brand Safety          Fraud

69
Identity context and Criteo principles

                 Identity principles                         Identity context

     • Personalized advertising fuels the open   • Changes to browsers/Chrome
       and free Internet
                                                 • Privacy regulation
     • Criteo is a privacy-by-design
                                                 • Consumer sentiment
       company

     • Enhancing privacy-safe online identity
       is critical for the ecosystem

70
We have differentiated capabilities to leverage identity

                   ▪   Trusted partners integrated into all of our advertisers’ and direct publishers’ websites
       1st party
                   ▪   Privileged position to embed ourselves into their workflow

      Unrivalled   ▪   95% of our 2 billion+ IDs in the graph already contain a significant number of non-cookie identifiers
      ID graph     ▪   Add persistent identifiers and new identification capabilities through trusted partners

       Product     ▪   Moving higher up in marketing funnel and off the browser into app, video, CTV
       Strategy    ▪   Reduce cookie exposure

                   ▪   Use our voice to help shape the direction of our industry
       Influence
                   ▪   Partner with other players, trade associations, standard setting groups and regulators

71
A Growing Ecosystem of Partner Integrations

     AUDIENCES

     MEASUREMENT

     ECOMMERCE PLATFORMS           FEED MANAGEMENT   DCO

     TAG MANAGEMENT

     SUPPLY QUALITY

     OFFLINE

72
Corporate Profile &
Governance
A balanced, global and expert Board of directors
     Board structure as of December 2019

     •   7 board members incl. 6 independent per listing
         standards

                                                                                                                        JB Rudelle

     •   3 committees:                                                                                                Chair of the Board

              Audit
                                                                                   Nathalie Balla                                                    Edmond Mesrobian
          •                                                                         Independent                                                            Independent

          •   Compensation
          •   Nominating & Corp. Governance
                                                             James Warner
                                                                                                                                                                               Rachel Picard
                                                           Chair of Compensation
                                                                                                                                                                         Chair of Nominating and Corp.
                                                                 Committee
                                                                                                                                                                           Governance Committee
                                                                Independent
     •   3 U.S. citizens or residents, 4 French citizen                                                                                                                           Independent

                                                                           Hubert de Pesquidoux
                                                                                                                                                         Marie Lalleman
                                                                            Chair of Audit Committee
                                                                                                                                                           Independent
     •   >40% women representation, in line with Copé-
                                                                                  Independent

         Zimmermann law in France

                                                                                                    Flags indicate country of citizenship or residency
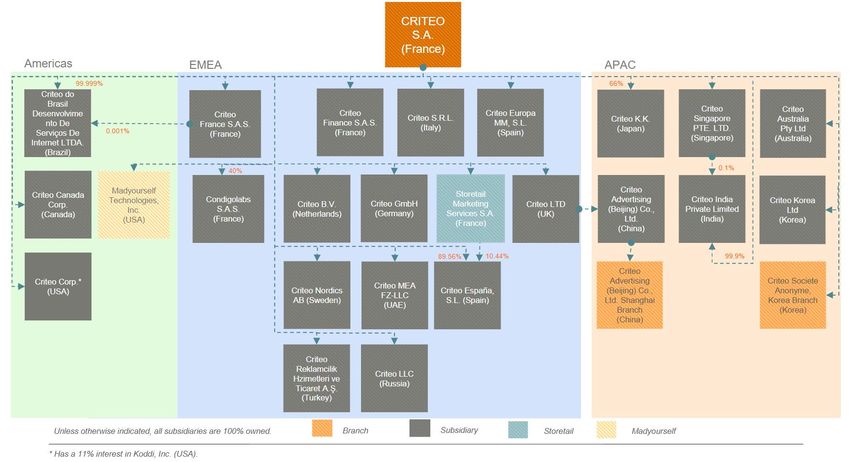
74
A lean legal structure
     Corporate Chart of Criteo Group as of January 2, 2020

75
Public issuer status

     SOX compliance
     •   An Emerging Growth Company at the time of the IPO
          •   Complying with Sections 302 and 404(a) of the Sarbanes-Oxley Act

     •   Large Accelerated Filer as from Jan. 1, 2015
          •   Complying with the full Sarbanes-Oxley Act, including Section 404(b)

     S.E.C. reporting & Relationships
     •   A Foreign Private Issuer at the time of the IPO
          •   Reporting in Euros under IFRS
          •   Filing an Annual Report on Form 20-F and quarterly earnings releases on Form 6-K
     •   Now a U.S. domestic filer as from Jan. 1, 2016
          •   Reporting in USD under U.S. GAAP
          •   Filing an Annual Report on Form 10-K, quarterly reports on Form 10-Q and a full U.S. Proxy Statement

     •   Only 3 comment letters received from the S.E.C. since going public – Last one in Sept 2018 about the ITP impact

76
Track-record of execution
& Financials
We maintain high retention across our large client base

           Client Retention Rate1                                                                                                                                      Number of clients (in thousands)

          100%

           90%
                                                                                                                                                                             19.7        20.0     20.2
           80%                                                                                                                19.0        19.2        19.4        19.4
                                                                                                       18.1        18.5
                                                                                           17.3
           70%                                                                  16.4
                                                                    15.4
           60%                                          14.5
                                             12.9
           50%                   11.9
                     11.0
           40%

           30%

           20%

           10%

             0%
                   Q1 2016     Q2 2016     Q3 2016     Q4 2016    Q1 2017     Q2 2017     Q3 2017    Q4 2017     Q1 2018     Q2 2018    Q3 2018     Q4 2018     Q1 2019    Q2 2019     Q3 2019   Q4 2019

78   1   The retention rate represents the percentage of live clients during the previous quarter that continued to be live clients during the current quarter. For all solutions combined.
Key Figures – Q4 2019 | FY 2019

     • Revenue ex-TAC was $266 million | $947 million
       Adj. EBITDA was $109 million | $299 million
       Free Cash Flow was $42 million |$125 million

     • Revenue ex-TAC from new solutions represented 16% of total Revenue ex-TAC in Q4, growing 44% yoy,
       and represented 12% of total Revenue ex-TAC in FY 2019, growing 54% yoy

     • 20,000+ clients with retention at 90% for all solutions combined

     • Criteo Direct Bidder now deployed with 4,500+ direct publishers in web and apps

     • 2,750+ Criteo employees across 29 offices in 19 countries

79
Regional performance – Q4 2019 | FY 2019

                        Q4 2019 Revenue ex-TAC       FY 2019 Revenue ex-TAC
                             Mix by Region                Mix by Region
                              APAC                     APAC
                               22%                      24%
                                          Americas                     Americas
                                            44%                          39%

                              EMEA                      EMEA
                               34%                       37%

                        Q4 2019 Revenue ex-TAC       FY 2019 Revenue ex-TAC
                          Growth* by Region             Growth* by Region

                               -3% Americas             +0.2% Americas
                               +1% EMEA                 +1% EMEA
                               -2% APAC                 -1% APAC
80   * At constant currency
Key figures – Q4 2019
            REVENUE EX-TAC* ($M)                                          ADJUSTED EBITDA* ($M)                                           FREE CASH FLOW* ($M)

                        -1%**                                                          41%                                                             38%
               272                      266
                                                                             of Revenue ex-TAC                                                  of Adj. EBITDA

                                                                             105                       109

                                                                                                                                              40                           42

             Q4 2018                  Q4 2019                               Q4 2018                  Q4 2019
                                                                                                                                            Q4 2018                   Q4 2019

     * Revenue ex-TAC, Adjusted EBITDA, and Free Cash Flow are not measures calculated in accordance with U.S. GAAP. We have provided a reconciliation of those measures
81   to the most directly comparable GAAP measures, which is available in the Appendix slides.
     ** At constant currency
Key figures – FY 2019
            REVENUE EX-TAC* ($M)                                          ADJUSTED EBITDA* ($M)                                           FREE CASH FLOW* ($M)

               966     +0.3%**          947
                                                                                       32%                                                             42%
                                                                             of Revenue ex-TAC                                                  of Adj. EBITDA

                                                                             321
                                                                                                       299

                                                                                                                                              135                          125

             FY 2018                  FY 2019                               FY 2018                  FY 2019
                                                                                                                                            FY 2018                   FY 2019

     * Revenue ex-TAC, Adjusted EBITDA, and Free Cash Flow are not measures calculated in accordance with U.S. GAAP. We have provided a reconciliation of those measures
82   to the most directly comparable GAAP measures, which is available in the Appendix slides.
     ** At constant currency
Solid financial model: nearly doubled Adj. EBITDA margin since IPO

       As % of
                                         FY 2013             FY 2014              FY 2015              FY 2016              FY 2017              FY 2018              FY 2019
       Revenue ex-TAC
      Revenue ex-TAC                       100%                 100%                100%                 100%                 100%                 100%                 100%

      Other cost of
                                           7.9%                 6.6%                 6.1%                 6.4%                 6.9%                6.7%                 7.7%
      revenue*

      Gross margin                        92.1%                93.4%                93.9%                93.6%                93.1%                93.3%               92.3%

             R&D*                         14.9%                12.5%                13.4%                14.2%                14.7%               15.2%                14.6%

             S&O*                         43.6%                39.9%                39.8%                35.3%                34.8%               33.6%                34.0%

             G&A*                         16.0%                14.8%                13.8%                13.2%                10.7%                11.3%               12.1%

      Adjusted EBITDA                     17.5%                26.2%                26.9%                30.8%                32.9%                33.2%               31.6%

      Revenue ex-TAC
                                          40.3%                40.8%                40.4%                40.6%                41.0%                42.0%               42.0%
      margin**

     * Cost of revenue and operating expenses are expressed on a Non-GAAP basis, which excludes the impact of equity awards compensation expense, pension service costs, depreciation
83   and amortization, acquisition-related costs, restructuring and deferred price consideration.
     ** As a % of revenue
Robust operating cash flow enables smart investment

                                             PROFITS

                          SCALE                                  CASH
                                              SMART
                                            INVESTING

                                  DEVELOP
                                                        INVEST
                                   & GROW

84
Our financial structure offers significant flexibility

            Strong balance                                            Significant                                             Very low                    $419M
                sheet                                                  cash pile                                                debt                          cash
                                                                                                                                                         As of Dec 31, 2019

         Total assets (in $M)                         Cash & cash equivalents (in $M)                               Financial liabilities (in $M)
                                1,790                                                                                                                     €350M
                                                                                                                                                    committed financing
           1,597
                                                                                   ~25%
                                                                                 of assets

                                                                                                                                                          $100M
                                                                                       419
                                                                  364
                                                                                                                                                    equity raise capacity*

                                                                                                                          4              4          Share buyback
                                                                                                                                                       authorization**
        Dec 2018             Dec 2019                          Dec 2018             Dec 2019                          Dec 2018       Dec 2019

     * Based on a $1.0bn market capitalization, pursuant to the 2019 AGM authorization to issue up to 6.6m shares
85   ** For M&A and to satisfy employee equity plan vesting
Robust Free Cash Flow and strong conversion into Adj. EBITDA

                US$ ‘000

                     60,000                                                                                                                             100%
                                        53,526
                                                     51,960                                                                                             90%
                     50,000
                                                                                                                                                        80%
                                                                                                                 43,536
                                                                                                                                              41,839
                                                                                                40,192                                                  70%
                     40,000
                              33,954                                                                                                                    60%

                     30,000                                                                                                                             50%
                                                                     22,494
                                                                                      20,600                              20,172                        40%
                                                                                                                                    19,345
                     20,000
                                                                                                                                                        30%

                                                                                                                                                        20%
                     10,000
                                                                                                                                                        10%

                         -                                                                                                                              0%
                              Q3 2017   Q4 2017      Q1 2018         Q2 2018         Q3 2018    Q4 2018         Q1 2019   Q2 2019   Q3 2019   Q4 2019

                                                                               Free Cash Flow   Average Conversion

     FCF to Adjusted
     EBITDA conversion        43%       45%          67%             33%             30%        38%              63%      36%       30%       38%

                                           Average FCF to Adjusted                                 Free Cash Flow
                                           EBITDA conversion
86
Flexible capital allocation more geared to shareholder returns

                           •
      Organic growth       •

                       •
                       •
           M&A             –
                           –
                           –

           Share           •
        repurchase         •
          program          •

87
Investment thesis

           1                2                 3                    4                    5

       Compelling      Large market    Competitive moats                            Attractive
                                                                 Proven          financial profile
        Mission
                                         - Shopper Data       track-record
        Power the                          - Unmatched                                 - High
          world’s       $47B market                                              profitability and
                        opportunity           ID Graph         ~90% client
      marketers with                     - AI Technology                             growing
                         across the                          retention for all       - Strong
       trusted and                     - Large client base
                       open Internet                             solutions       balance sheet
        impactful
                                       - Consumer Reach         combined           & cash flow
       advertising

88
Investor Relations contacts
     IR@Criteo.com

     Edouard Lassalle         Friederike Edelmann              Clemence Vermersch
      VP, Market Relations      Director, Investor Relations    Associate, Investor Relations
          32, rue Blanche     387 Park Ave South, 12th Floor          32, rue Blanche
            75009 Paris            New York, NY 10016                   75009 Paris
         +33 1 7621 2166             +1 917 837 8617                 +33 6 7599 6751
      e.lassalle@criteo.com      f.edelmann@criteo.com           c.vermersch@criteo.com
89
Appendix

90
Revenue ex-TAC reconciliation

      ($ in thousands)      Q1’18            Q2’18            Q3’18          Q4’18      Q1’19          Q2’19     Q3’19     Q4’19

     Revenue                 564,164           537,185          528,869       670,096   558,123        528,147   522,606   652,640

            Less: Traffic
                             323,746           306,963          305,387       398,238   322,429        304,229   301,901   386,388
        acquisition costs

     Revenue ex-TAC          240,418           230,222          223,482       271,858   235,694        223,918   220,705   266,252

                            ($ in thousands)                                2018                2019

                            Revenue                                       2,300,314        2,261,516

                                    Less: Traffic acquisition costs       1,334,334        1,314,947

                            Revenue ex-TAC                                965,980           946,569

91
Adjusted EBITDA reconciliation
     ($ in thousands)              Q1’18       Q2’18       Q3’18       Q4’18       Q1’19       Q2’19       Q3’19       Q4’19       2017       2018      2019

     Net income                     21,090      14,707      17,948      42,134      21,401      12,537      20,557      41,474      96,659     95,879    95,969

     Adjustments:
     Financial (income) expense,
                                     1,325       1,006       1,007       1,746       1,974       1,354         900       1,521       9,534      5,084     5,749
     net

     Provision for income taxes     12,386       8,638       6,821      18,299      10,018       5,683       7,913      15,822      31,651     46,144    39,496

     Equity awards
                                    19,303      20,245      17,261      10,267      13,882      14,391      11,700       9,089      72,351     67,076    49,132
     compensation expense

     Pension service costs             434         419         419         419         394         391         388         383       1,231      1,691     1,556

     Depreciation and
                                    23,646      23,560      25,619      30,675      19,296      21,315      22,388      30,489      90,796    103,500    93,488
     amortization expense

     Acquisition-related costs             -           -       516       1,222             -           -           -           -          6     1,738          -

     Restructuring                   (252)         199             -           -     1,890         728         303      10,661       7,356       (53)    13,582

     Total net adjustments          56,842      54,067      51,643      62,628      47,454      43,862      43,662      68,025     212,925    225,180   203,003

     Adjusted EBITDA                77,932      68,774      69,591     104,762      68,855      56,399      64,219     109,499     309,584    321,059   298,972

92
Free cash flow reconciliation

     ($ in thousands)                                                                         FY 2018             FY 2019

     CASH FROM OPERATING ACTIVITIES                                                                 260,726             222,832

     Acquisition of intangible assets, property, plant and equipment                               (116,984)            (82,716)

     Change in accounts payable related to intangible assets, property, plant and equipment             (8,494)         (15,224)

     FREE CASH FLOW                                                                                 135,248             124,892

93
You can also read