Origin of the ring structures in Hercules A
←
→
Page content transcription
If your browser does not render page correctly, please read the page content below
Astronomy & Astrophysics manuscript no. main                                                                                       ©ESO 2021
                                               August 18, 2021

                                                                          Origin of the ring structures in Hercules A
                                                                            Sub-arcsecond 144 MHz to 7 GHz observations?
                                                R. Timmerman1,?? , R. J. van Weeren1 , J. R. Callingham1, 2 , W. D. Cotton3 , R. Perley4 , L. K. Morabito5, 6 , N. A. B.
                                               Gizani7 , A. H. Bridle3 , C. P. O’Dea8 , S. A. Baum8 , G. R. Tremblay9 , P. Kharb10 , N. E. Kassim11 , H. J. A. Röttgering1 ,
                                                        A. Botteon1 , F. Sweijen1 , C. Tasse12, 13 , M. Brüggen14 , J. Moldon15 , T. Shimwell1, 2 , and G. Brunetti16

                                                      1
                                                          Leiden Observatory, Leiden University, P.O. Box 9513, 2300 RA Leiden, The Netherlands
                                                      2
                                                          ASTRON, Netherlands Institute for Radio Astronomy, Oude Hoogeveensedijk 4, Dwingeloo, 7991 PD, The Netherlands
arXiv:2108.07287v1 [astro-ph.GA] 16 Aug 2021

                                                      3
                                                          National Radio Astronomy Obs, 520 Edgemont Rd., Charlottesville, VA 22903, USA
                                                      4
                                                          National Radio Astronomy Obs, P.O. Box 0, Socorro, NM 87801, USA
                                                      5
                                                          Centre for Extragalactic Astronomy, Department of Physics, Durham University, Durham DH1 3LE, UK
                                                      6
                                                          Institute for Computational Cosmology, Department of Physics, University of Durham, South Road, Durham DH1 3LE, UK
                                                      7
                                                          Hellenic Open University, School of Science & Technology, Parodos Aristotelous 18, Perivola Patron, Greece
                                                      8
                                                          Department of Physics & Astronomy, University of Manitoba, Winnipeg, MB R3T 2N2, Canada
                                                      9
                                                          Harvard-Smithsonian Center for Astrophysics, 60 Garden St., Cambridge, MA 02138, USA
                                                     10
                                                          National Centre for Radio Astrophysics, S. P. Pune University Campus, Post Bag 3, Ganeshkhind Pune 411 007, India
                                                     11
                                                          Remote Sensing Division, Naval Research Laboratory, Code 7213, 4555 Overlook Ave SW, Washington DC 20375, USA
                                                     12
                                                          GEPI & USN, Observatoire de Paris, CNRS, Université Paris Diderot, 5 place Jules Janssen, 92190 Meudon, France
                                                     13
                                                          Centre for Radio Astronomy Techniques and Technologies, Department of Physics and Electronics, Rhodes University, Graham-
                                                          stown 6140, South Africa
                                                     14
                                                          Hamburger Sternwarte, University of Hamburg, Gojenbergsweg 112, 21029 Hamburg, Germany
                                                     15
                                                          Instituto de Astrofísica de Andalucía (IAA, CSIC), Glorieta de las Astronomía, s/n, E-18008 Granada, Spain
                                                     16
                                                          INAF—Istituto di Radioastronomia, Via Gobetti 101, I-40129 Bologna, Italy

                                                     Received XXX; accepted YYY

                                                                                                                 ABSTRACT

                                                     The prominent radio source Hercules A features complex structures in its radio lobes. Although it is one of the most comprehensively
                                                     studied sources in the radio sky, the origin of the ring structures in the Hercules A radio lobes remains an open question. We present
                                                     the first sub-arcsecond angular resolution images at low frequencies (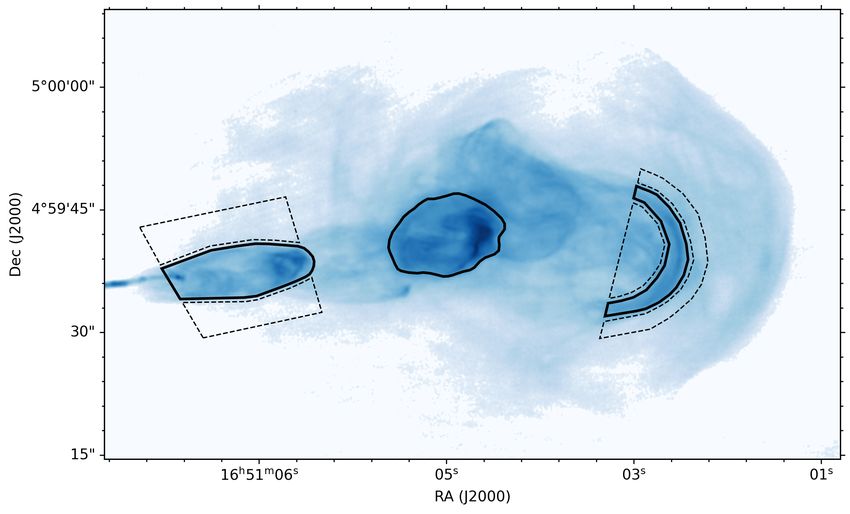
A&A proofs: manuscript no. main

Fig. 1. Radio images of Hercules A constructed from the LOFAR HBA (144 MHz, top panel), the VLA L band (1.5 GHz, middle panel), and VLA
C band (7 GHz, bottom panel). The scale bar in the bottom right corner of each panel measures 100 kpc at the redshift of Hercules A. The color
scale of each image goes from three times the rms noise level to the peak brightness. The synthesized beam sizes of the three images are indicated
by the white oval in the bottom left corner of each panel, and are summarized along with the rms noise levels in Table 1.

Article number, page 2 of 9
R. Timmerman et al.: Origin of the ring structures in Hercules A; sub-arcsecond 144 MHz to 7 GHz observations
sons, Hercules A is generally categorized as an intermediate FR particle acceleration, the steep spectrum of the outermost ring is
I/II source (e.g., Meier et al. 1991; Sadun & Morrison 2002; Sax- no longer problematic. However, this strong rim-brightening is
ton et al. 2002; Gizani & Leahy 2003). The eastern lobe is dom- generally not observed in lobes.
inated by a bright jet from the AGN that slowly diffuses into the Using new International LOFAR Telescope observations at
lobe, while the western lobe mainly shows a very distinct se- 144 MHz, and Karl G. Jansky Very Large Array (VLA) obser-
ries of three rings (Dreher & Feigelson 1984; Mason et al. 1988) vations in both the L and C bands, we aim to study the spectral
at projected distances of between 55 kpc and 230 kpc from the properties of Hercules A between 144 MHz and 7 GHz at sub-
host galaxy. The jets from the AGN produce Alfvénic pertur- arcsecond angular resolution. This wide range of observing fre-
bations that cross the relativistic plasma of the lobes and induce quencies provides an unparalleled data set to study the spectral
brightness fluctuations. Recent investigations by Gizani & Leahy properties of the source, and to test for any spectral turnovers due
(1999, 2003, 2004) used both radio observations from the Very to absorption mechanisms, which generally occur at frequencies
Large Array (VLA) and X-ray observations from the Röntgen- below 1 GHz. Furthermore, the unprecedented angular resolu-
satellit (ROSAT) to study Hercules A. They concluded, based on tion and sensitivity at low frequencies provide a large lever arm
the observed rotation measure features and an analytical model in frequency space, facilitating an investigation into the origin of
for the magnetic field strength, that the eastern jet is orientated the rings in the Hercules A lobes.
towards us while the western jet is receding from us at an in- In this paper we adopt a ΛCDM cosmology with a Hubble
clination angle of 50◦ relative to the line of sight. In addition, parameter of H0 = 67.4 km s−1 Mpc−1 , a matter density pa-
they suggested that the apparent absence of a jet structure in the rameter of Ωm = 0.315, and a dark energy density parameter of
western lobe could be due to Doppler dimming, which could be ΩΛ = 0.685 (Planck Collaboration 2020). We define our spec-
as strong as a factor of ∼ 20 (Gizani & Leahy 2003). Subsequent tral indices α according to S ∝ να , where S is flux density and ν
research by Gizani et al. (2005) at 74 MHz and 325 MHz using is frequency.
the VLA–Pie Town link (Lane et al. 2005) found that the spec-
tral differences between the jets and the lobes at these low fre-
quencies are smaller than those observed at higher frequencies 2. Observations and data reduction
(Gizani & Leahy 2003). Such spectral differences imply the pres-
2.1. LOFAR
ence of regions of various ages, thereby supporting the multiple
outbursts interpretation. Unfortunately, the limited angular reso- Hercules A was observed with LOFAR’s High Band Antennas
lution of the VLA–Pie Town link (∼ 10 arcseconds at 74 MHz) (HBA, Van Haarlem et al. 2013) at frequencies between 120 and
did not permit a detailed investigation of the rings. 168 MHz (PI: Timmerman, Project code: LC14-019). The data
Despite the many studies focused on understanding the struc- were recorded with spectral channels of 12 kHz to cover a total
ture of Hercules A, a few key features of the lobes remain a mys- bandwidth of 48 MHz and with a time resolution of 1 second
tery. Of particular interest for this paper is the origin of the rings per integration. The observation took place on 8 June 2020, for
present in the western lobe. Two models have been proposed a duration of 4 hours. The gain and bandpass calibrator source
(e.g., Mason et al. 1988; Meier et al. 1991; Morrison & Sadun 3C 295 was observed for 10 minutes before and after the target
1996; Saxton et al. 2002; Gizani & Leahy 2003): either the rings scan. The initial data reduction was performed using Prefactor
are caused by a series of shocks between the old lobe material (Van Weeren et al. 2016; Williams et al. 2016; de Gasperin et al.
and new material from jet outbursts or the rings form the surfaces 2019), which performed the initial flagging and used a model
of multiple inner lobes associated with separate AGN outbursts. of the calibrator source to derive the calibration solutions for
In the shock model, adiabatic compression and particle ac- the Dutch stations. In particular, Prefactor first derived the po-
celeration are assumed to be responsible for producing thin and larization alignment and Faraday rotation. Based on these so-
curved emission regions, which closely match the observed mor- lutions, it derived the bandpass calibration solutions. Next, the
phology of the rings. Although it is an idealized assumption that clock corrections were derived by clock-total electron content
the compression is adiabatic, this is a commonly employed as- (TEC) separation. These calibration solutions were then applied
sumption when studying shock models in Hercules A and other to the target data, after which the data were flagged again and
sources (e.g., Meier et al. 1991; Brüggen et al. 2007; Jubelgas averaged to a time resolution of 8 seconds and frequency chan-
et al. 2007). However, the shock model is difficult to match with nels of 98 kHz. Finally, a sky model of the target was obtained
the spectral indices of the rings, which are relatively flat com- from the TIFR GMRT Sky Survey (TGSS) and used to perform
pared to the lobes, even at low frequencies. This implies that the a phase-only calibration cycle.
shock wave induces a significant amount of particle acceleration. After this, the LOFAR-VLBI pipeline developed by Mora-
Although the observed spectral indices are not unusual for shock bito et al. (2021) was employed to perform the initial calibration
waves, it is peculiar that the outermost ring in the western lobe of the international LOFAR stations. This pipeline applied the
features a significantly steeper spectrum. Assuming that the lobe Prefactor solutions to the unaveraged data containing all sta-
spectrum evolves mainly due to aging, the spectral index of the tions. Then, the pipeline identified the best in-field calibrator
outermost ring could be obtained solely through adiabatic com- source from the Long Baseline Calibrator Survey (LBCS, Jack-
pression. In addition, the spectra of the rings have been found son et al. 2016, in prep.), and used this to derive the antenna
to be similar to that of the eastern jet, which would have to be delays by solving for the TEC. In the case of this observation,
merely a coincidence (Gizani & Leahy 2003). the target source Hercules A was used for this calibration step
In the second scenario the rings could be formed as the sur- due to its high flux density. Finally, these calibration solutions
face of inner lobes. As the jetted plasma decelerates, its beaming were applied to the data to obtain the final calibrated data set.
is reduced and its apparent brightness increases. This also pro- To further improve the quality of the calibration, we per-
vides an explanation for the lack of visible rings in the eastern formed phase and amplitude self-calibration on Hercules A us-
lobe, where this effect works in the opposite way. Time retar- ing the Default Preprocessing Pipeline (DPPP, Van Diepen et al.
dation between the two lobes due to their inclination to the line 2018) for deriving and applying updated calibration solutions
of sight can also break their symmetry. Without invoking any and wsclean (Offringa et al. 2014) for imaging. The final imag-
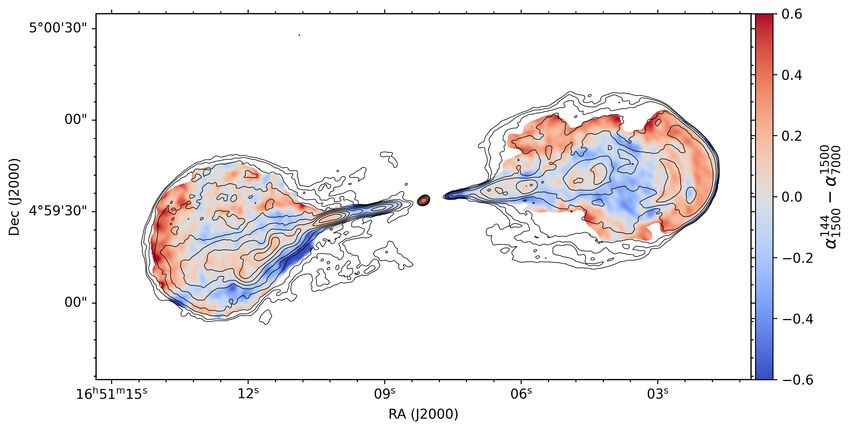
Article number, page 3 of 9A&A proofs: manuscript no. main Fig. 2. Spectral index maps of Hercules A between 144 MHz and 1.5 GHz (top panel), 144 MHz and 7 GHz (middle panel), and 1.5 GHz and 7 GHz (bottom panel). The contours indicate the L-band emission (1.5 GHz), and are drawn at [1, 2, 4, 8, ...] × 5σrms , where σrms = 224.2 µJy beam−1 . Article number, page 4 of 9
R. Timmerman et al.: Origin of the ring structures in Hercules A; sub-arcsecond 144 MHz to 7 GHz observations

Fig. 3. Spectral index curvature map of Hercules A. The spectral index curvature is calculated as the spectral index between 144 MHz and 1.5 GHz
minus the spectral index between 1.5 GHz and 7 GHz. The red regions indicate where the spectrum is steeper at high frequencies than at low
frequencies, whereas the blue regions indicate where the spectrum is flatter at high frequencies than at low frequencies. The contours indicate the
L-band emission (1.5 GHz), and are drawn at [1, 2, 4, 8, ...] × 5σrms , where σrms = 224.2 µJy beam−1 .

ing was performed using the Briggs weighting scheme (Briggs                set to the Perley & Butler (2017) scale, which is consistent with
1995) with a robust parameter of -1, according to the Com-                 the Scaife & Heald (2012) flux density scale to within 5%.
mon Astronomy Software Application (CASA; McMullin et al.                      The data reduction was performed using the Obit software
2007) definition. To calibrate the flux density scale, we scaled           package (Cotton 2008). First, the data was Hanning smoothed
the final image (see Fig. 1) to match the data from Kellerman              and flagged. Next, the parallactic angle corrections, the de-
et al. (1969), where we interpolated their flux density measure-           lay calibration solutions, and the bandpass calibration solutions
ments between the two nearest frequencies, which are 38 and                were determined. Using these solutions, the gains of the calibra-
178 MHz. The low-frequency measurements of Kellerman et al.                tor sources were derived based on source models and the flux
(1969) captured all of the flux density of Hercules A due to their         density scale of the phase reference source was determined. Fol-
low-resolution observations. A correction factor of 1.09 was ap-           lowing this calibration procedure the data was flagged again, and
plied to the data from Kellerman et al. (1969) to convert their            the entire calibration was repeated with all flags applied from
measurements to the Scaife & Heald (2012) flux density scale,              the start. Finally, the calibration solutions were applied to the
which is identical to the RCB flux density scale (Roger et al.             data. To improve the calibration, Hercules A and the calibrator
1973) at these low frequencies. We assume a 10% uncertainty                source, 3C 286, were both self-calibrated. Based on the refined
on the absolute flux scale due to intrinsic problems at low fre-           model of 3C 286, corrections to the amplitude calibration were
quencies.                                                                  derived and applied to Hercules A. Hercules A was first self-
                                                                           calibrated based on the individual data sets. Then, these data sets
                                                                           were combined based on their spectral bands, and finally self-
2.2. Karl G. Jansky Very Large Array                                       calibrated again. The imaging of the final data products was per-
                                                                           formed with multi-resolution CLEAN using the Briggs weight-
In addition to the LOFAR observations, Hercules A was ob-                  ing scheme with robust parameters of -2.5 (L band) and -1 (C
served with the VLA in the L band (1–2 GHz) and the C band (6–             band), according to the Astronomical Image Processing System
8 GHz) between September 2010 and September 2011 (Project                  (AIPS) definition. We assume a 5% uncertainty on the absolute
code: TDEM0011). The L-band observations were performed in                 flux scale in accordance with Perley & Butler (2017).
the A, B, and C configurations, while the C-band observations
were also performed in D configuration. The data were recorded
in full polarization mode, with spectral channels of 1 MHz for             3. Results
the L-band observations and 2 MHz for the C-band observa-
tions. To exploit the complete 4 GHz of bandwidth available in             To investigate the nature of the rings, spectral index maps were
the C band, the observations were performed separately for the             produced between all three observing bands, as shown in Fig. 2.
lower and upper halves of the C band. The lower half of the C-             To ensure a consistent sensitivity to the different spatial scales,
band data were recently presented by Wu et al. (2020), and the             upper and lower limits on the baseline length were applied to the
upper half of the C-band data are now presented along with the             LOFAR data to match both the L- and C-band VLA data. This
L-band observations for the first time. To calibrate both the flux         reduced the largest angular scale to which the data are sensitive
density scale and the bandpass, scans on 3C 286 were included in           to 4.2 arcminutes in the case of a match with the C-band data
the observations. PKS J1651+0129 was used for phase-reference              and 20 arcminutes in the case of a match with the L-band data,
calibration. The flux density scale of the VLA observations was            both of which exceed the maximum angular scale of Hercules A
                                                                                                                       Article number, page 5 of 9
A&A proofs: manuscript no. main
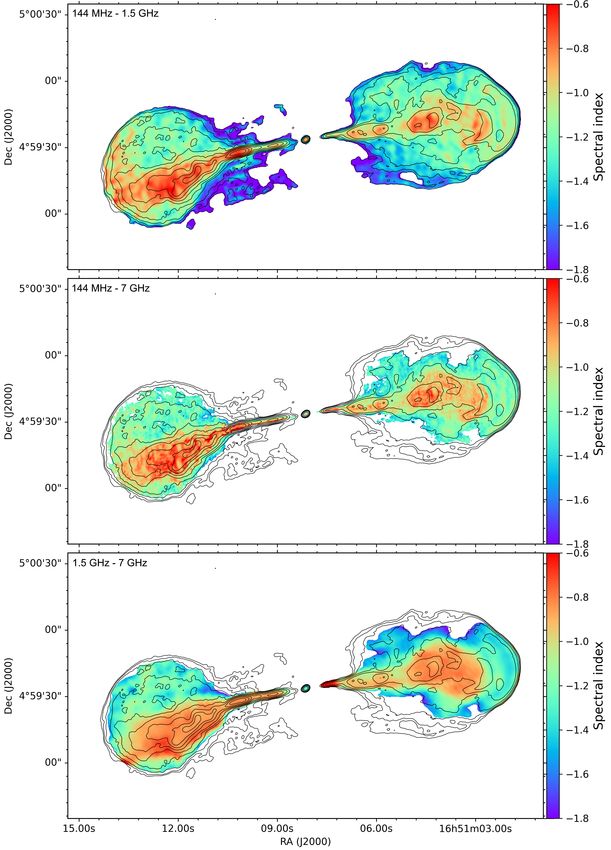
Fig. 4. VLA image of the western lobe of Hercules A in C band (7 GHz). The solid black regions indicate the regions used to measure the flux
density of the rings. The regions with the dashed black borders indicate the regions used to estimate the background surface brightness of the lobe
material at the position of the rings.
Table 1. Properties of the images shown in Fig. 1. 1.5 GHz, and 1.5 GHz and 7 GHz (Fig. 3). This difference al-
lows us to determine whether the spectral index is constant from
HBA L band C band low to high frequencies, or if the spectral index changes. This
Observatory LOFAR VLA VLA can be interpreted as a measure of the curvature of the spec-
Frequency (MHz) 144 1500 7000 trum. In the spectral curvature map, the red regions indicate that
Bandwidth (MHz) 48 1024 2048 the spectrum is steeper at high frequencies, whereas the blue re-
Total flux density (Jy) 474.7 51.5 11.2 gions indicate that the spectrum is steeper at low frequencies. In
Flux scale uncertainty 10% 5% 5% the western lobe, the three ring structures are distinguishable and
rms noise (µJy beam−1 ) 395.4 224.2 6.1 feature steepening spectra. Interestingly, each ring shows more
bmajor (") 0.547 2.085 0.396 steepening than the previous one, counting from the core. The
bminor (") 0.234 1.592 0.349 ring closest to the core shows an average spectral index curvature
bPA (deg. East of North) 1.602 -59.930 86.550 of 0.02 ± 0.07. The ring in the middle shows an average spectral
index curvature of 0.04 ± 0.07. Finally, the farthest ring from the
AGN shows an average spectral index curvature of 0.16 ± 0.07.
(190 arcseconds). The resulting images were convolved to the We note that the uncertainties on these measurements are domi-
same synthesized beam and confirmed to be aligned based on nated by systematic uncertainties, and are thus strongly spatially
the central compact source. Finally, all regions below a 5σ con- correlated.
fidence level in the spectral index map were masked out. Tests
were performed to ensure that bowl effects due to the lack of 4. Discussion
short baselines do not introduce significant features in the spec-
tral index maps. The origin of the ring structures in the western lobe has been one
In each of the spectral index maps, the jets are found to fea- of the main topics of debate regarding Hercules A since their
ture a spectral index of around α = −0.8 between the three discovery by Dreher & Feigelson (1984). Currently, the shock
bands, which is flatter than the typical values derived for the model (e.g., Mason et al. 1988; Meier et al. 1991) and inner-lobe
lobes. In the eastern lobe the flow of jetted plasma can be clearly model (e.g., Morrison & Sadun 1996) remain in consideration, as
traced by the gradual steepening of its spectrum as it ages and neither model could be easily given preference (Gizani & Leahy
merges into the lobe. The jet appears to slowly diffuse, and to 2003). However, our new observations extend the observed fre-
reach the outer edge of the lobe before diffusing into the lobe and quency range to much lower frequencies, while maintaining suf-
eventually sinking back towards the central galaxy. In the west- ficient angular resolution to clearly resolve the rings. This allows
ern lobe the jetted plasma can mostly be seen as a relatively flat- us to measure the spectral properties of the rings over more than
spectrum (α > −1) region in the center of the lobe. In addition, a decade of frequency, facilitating a comprehensive test of which
the rings are clearly distinguishable in the spectral index map be- model fits the data best.
tween 144 MHz and 1.5 GHz. The spectral index of the bridge The shock model provides one explanation for the morphol-
in between the two radio lobes remains poorly constrained, as ogy of the rings. In this model the rings are the shocks which
this structure is too faint in the VLA maps, but will, in any case, induce adiabatic compression and particle acceleration when ir-
have to be as steep as α = −1.8 or less to be consistent with a regularities in the jet pass through the lobe. This scenario is able
non-detection in the L-band image (1.5 GHz). to recover the observed structure in the eastern lobe (Gizani &
For use in the Discussion (Section 4), we calculate the dif- Leahy 2003). However, this model struggles to provide a com-
ference between the spectral index maps between 144 MHz and pelling explanation for the observed spectral indices of the rings
Article number, page 6 of 9R. Timmerman et al.: Origin of the ring structures in Hercules A; sub-arcsecond 144 MHz to 7 GHz observations
in the western lobe. First, the rings are found to have a rel- a synchrotron-emitting plasma, the higher-energy electrons ra-
atively flat spectral index. Between our two lowest frequency diate away their energy first, causing a break in the synchrotron
bands we observe spectral indices of the rings in the western spectrum (e.g., Scheuer & Williams 1968). As the plasma ages,
lobe of around α = −0.8, which is consistent with the spec- this break frequency shifts towards lower frequencies, leading to
tral index of the eastern jet. The true value is most likely flat- an increasingly steep spectrum at higher frequencies.
ter than this as the observed spectral index includes contribu- As presented in Fig. 3, we observe a trend where each con-
tions from the steeper-spectrum lobe material along the line of secutive ring, counting from the core, shows more spectral steep-
sight to the ring. Such flat spectral indices are unlikely to be ening. To exclude the possibility that the spectral curvature trend
produced merely through adiabatic compression, as adiabatic emerges due to variations in the lobe emission along the line of
compression can only straighten the spectrum towards the injec- sight, we also measured the spectral curvature by estimating the
tion spectral index (Enßlin & Gopal-Krishna 2001), and even the flux density contribution of the rings independent of the fore-
low-frequency spectral index of the lobe is about α = −1.2. In ground material (see Fig. 1). We did this by first measuring the
comparison, the spectra of the rings at high frequencies are flat- total flux density within the ring region, and then subtracting the
ter than the spectrum of the lobes at low frequencies, indicating flux density due to the background surface brightness of the lobe.
that particle acceleration is required as well. However, if particle The regions used for this measurement in the C band are shown
acceleration by shocks plays a role, then it is difficult to explain in Fig. 4. The background level is estimated as the mean surface
why the outermost ring in the western jet features the steepest brightness of two regions on opposite sides of the rings. We as-
spectrum. The outermost ring forms the bow shock ahead of the sume a 10% uncertainty on all flux density measurements. Using
western jet as it is caused by the frontal collision between the jet the total flux density measurements without background subtrac-
and the lobe. Therefore, it should be the strongest shock of the tion, we obtained spectral curvature values αcurv = α144 1500 − α7000
1500
set. To resolve this, the outermost ring requires a significantly of 0.04 ± 0.13, 0.09 ± 0.13, and 0.27 ± 0.13 for the inner, middle,
different Mach number and mixture between thermal and rela- and outer rings, respectively. For the background subtraction we
tivistic components compared to the other rings. excluded the middle ring from the analysis as the complex mor-
An alternative model posits that the rings in the western lobe phology of the ring and its environment prevent a reliable back-
are the surfaces of inner lobes created by the jet (Gizani & Leahy ground level from being estimated. This leaves only the inner
2003). As the western jet recedes away from us, the brightness and outer rings, for which we estimate background-subtracted
of this jet is strongly reduced by Doppler dimming. However, spectral curvatures of 0.15 ± 0.13 and 0.36 ± 0.13, respectively.
as the jets form inner lobes within the old plasma, the surface We measure an increasing spectral curvature of the rings be-
of this jetted plasma is decelerated, which reduces their Doppler fore and after background subtraction, implying that we are de-
dimming. This gives the surface of these inner lobes an appar- tecting the typical break in the synchrotron spectrum as a conse-
ent increase in brightness from our perspective. In the inner-lobe quence of aging. This is also consistent with the similar spectral
model, the bright rings are expected to be formed by the jetted curvature values we found between the inner and middle ring,
material, and should therefore be similar to the jet in terms of with the outer ring showing much stronger curvature. An illus-
spectral index, which is consistent with our observations. In par- tration of the complete spectrum of each of the rings is shown in
ticular, it is not problematic that the outer ring has the steepest Fig. 5. A Jaffe-Perola spectral model (Jaffe & Perola 1973) was
spectrum of the set due to radiative aging since particle acceler- fitted to the flux density measurements of each of the three rings
ation and adiabatic compression are not expected to contribute to derive their respective injection index and break frequency. In
significantly. However, the inner-lobe model does have difficulty the illustration, the break frequencies of the rings shift to lower
explaining the morphology of the rings. Inner lobes generally do frequencies the farther the rings are from the central AGN, caus-
not feature rim brightening, although this could at least partially ing the spectrum to steepen. We find relatively steep injection in-
be explained if the inner lobes are mainly filled with the Doppler- dices for the three rings of α = −0.75 up to α = −0.93. However,
beamed jetted stream (Gizani & Leahy 2003). The inner-lobe similar and steeper injection indices are not uncommon (e.g.,
model implies that the AGN experiences intermittent periods of Bîrzan et al. 2008; Harwood et al. 2013, 2015; Shulevski et al.
activity, similar to that observed in the Perseus cluster (Fabian 2015). Although this model is strongly based on Doppler effects,
et al. 2006), Hydra A (Wise et al. 2007), MS0735 (Vantyghem it should be noted that the spectra will be significantly redshifted
et al. 2014), some peaked-spectrum radio sources (Callingham and will undergo beaming effects. However, as the rings all have
et al. 2017), and the Phoenix cluster (Timmerman et al. 2021), a reduced Doppler factor due to the deceleration of the jetted
for instance. In the case of Hercules A evidence of such inter- plasma, the redshift of their spectra will be relatively low. This
mittency has already been provided by Gizani et al. (2002), who prevents the redshift of the rings from significantly affecting their
detect a possible pair of parsec-scaled radio jets from a new relative break frequencies.
outburst, and O’Dea et al. (2013), who suggest based on Hub- To investigate whether the observed amount of spectral cur-
ble Space Telescope observations that the AGN experienced an vature is realistic for Hercules A, we derived the magnetic field
episode of activity about 60 Myr ago, and that it restarted about strength in the jet required to produce such spectra. From our
20 Myr ago. observations, we measure angular distances between the three
Accurate spectral index measurements can provide valuable rings of about 24 arcseconds, with a distance between the core
information on the composition and physical conditions present of the AGN and the innermost ring of 37 arcseconds. This cor-
in the emission region. Our low-frequency data allow us to not responds to projected physical distances of 66 kpc between the
only accurately determine the overall spectral index, but also rings and 103 kpc between the core and the innermost ring. As-
detect curvature in the spectrum. In the shock model the rings suming an angle between the jets and the line of sight of 50 de-
are formed by adiabatic compression and particle acceleration in grees (Gizani & Leahy 1999) and a jet speed of β = 0.8 (Gizani
the lobe. Both of these mechanisms work to straighten out the & Leahy 2003), we find that the innermost, middle, and outer-
spectrum towards a single power-law model. On the other hand, most rings are composed of plasma with ages of approximately
the inner-lobe model predicts that the rings should feature the 550 kyr, 900 kyr, and 1250 kyr, respectively. Here, we assume
same spectral properties as the jet, which is subject to aging. In that the inner lobes propagate at the speed of the jets, which is
Article number, page 7 of 9A&A proofs: manuscript no. main
Fig. 5. Illustration of the spectral curvature of the rings in the western lobe, assuming a Jaffe-Perola model (Jaffe & Perola 1973). From left to
right, the three panels show the inner, middle, and outer rings with injection indices of αinj = −0.93, αinj = −0.75, and αinj = −0.83, respectively.
The hexagons indicate the total flux densities of the rings at the three different frequencies. The error bars on these measurements are drawn, but do
not extend beyond the marker. The solid lines show the spectra of the three rings with the amount of curvature as measured from the flux density
measurements without background subtraction. The dashed lines show the respective injection spectra without any curvature for comparison.
a rough approximation and is likely an upper limit to the true to be consistent with a non-detection in our L-band observations
speed. However, more accurate measurements are unavailable, (1.5 GHz).
and the main goal is only to test whether the approximate num- To study the nature of the rings in the lobes of Hercules A,
bers are sensible. Given these ages, and assuming a Jaffe-Perola we investigate whether our observations are consistent with a
spectral model, we derive magnetic field strengths in the jet of shock model or an inner-lobe model. Spectral index mapping be-
28 µG, 36 µG, and 45 µG for the innermost, middle, and outer- tween 144 MHz and 7 GHz reveals that the rings in the western
most rings, respectively. This trend in increasing magnetic field lobe feature spectral steepening at high frequencies. In particu-
strength could be an indication of a deviation in the age estimates lar, the spectral steepening increases as the rings are farther away
due to errors in the line-of-sight angle or jet speed, but it should from the central AGN. This suggests that the rings are subject to
be noted that there are also additional uncertainties due to the synchrotron aging, which is a clear prediction of the inner-lobe
assumption of a Jaffe-Perola model, the methodology of mea- model. Therefore, we conclude that the observations presented in
suring spectral curvature and the fact that there may be a small this paper are more consistent with the inner-lobe model where
amount of redshift due to the recession of the jet. However, the the jetted material from intermittent periods of AGN activity in-
approximate values of the magnetic field strength under the as- flates small lobes within the outer lobe, which appear as ring-like
sumption of an inner-lobe model are in accordance with typical structures. However, we do not exclude that adiabatic compres-
values derived for the jets of AGNs (e.g., Kataoka & Stawarz sion and particle acceleration contribute to the brightness of the
2005; Godfrey & Shabala 2013). rings as well, and we note that definitive evidence to settle this
In addition to the spectral steepening of the rings, we also debate remains yet to be found.
see that the environment of the jets shows spectral flattening at Even though this model contributes evidence in favor of the
high frequencies, as shown in Fig. 3. This could be produced, inner-lobe model, it still struggles to provide a complete ex-
for instance, by particle acceleration in regions that are opaque planation for the morphology of the rings. Supporting evidence
at low frequencies, or it could indicate a mismatch in the surface could likely be obtained through detailed magnetohydrodynam-
brightness sensitivities of LOFAR and the VLA. Such a discrep- ical (MHD) simulations. The jetted outflows can be simulated
ancy can emerge due to differences in the uv-coverage of the two based on our current understanding of the environment of Her-
arrays. LOFAR in particular suffers from a sparse uv-coverage at cules A. By replicating the observed ring-like structures, their
intermediate scales (1–2 arcsecond). However, the total flux den- exact nature can be confirmed. In particular, MHD modelling
sity of the source has been carefully calibrated across all three would have to focus on reproducing the observed morphology
frequencies and the consistent measurements obtained using dif- and spectral properties of the rings in the western lobe, and on
ferent methods indicate the validity of our results. the lack of ring structures in the eastern lobe.
Acknowledgements. RT and RJvW acknowledge support from the ERC Start-
ing Grant ClusterWeb 804208. JRC thanks the Nederlandse Organisatie voor
5. Conclusions Wetenschappelijk Onderzoek (NWO) for support via the Talent Programme Veni
grant. CO and SB acknowledge support from the Natural Sciences and Engineer-
In this paper we presented new LOFAR and VLA observations ing Research Council (NSERC) of Canada. AB acknowledges support from the
VIDI research programme with project number 639.042.729, which is financed
of Hercules A with the aim of investigating the nature of the ring by the Netherlands Organisation for Scientific Research (NWO). JM acknowl-
features seen in the radio lobes. Our LOFAR observations clearly edges financial support from the State Agency for Research of the Spanish MCIU
resolve the jet and ring structures in the lobes at 144 MHz, en- through the “Center of Excellence Severo Ochoa” award to the Instituto de As-
abling the lobes to be studied at low frequencies, for the first trofísica de Andalucía (SEV-2017-0709) and from the grant RTI2018-096228-B-
C31 (MICIU/FEDER, EU). This paper is based (in part) on data obtained with
time at a sub-arcsecond angular resolution. The bridge of emis- the International LOFAR Telescope (ILT) under project code LC14-019. LOFAR
sion in between the two lobes is only significantly detected at (Van Haarlem et al. 2013) is the Low Frequency Array designed and constructed
144 MHz, which implies a spectral index of α = −1.8 or steeper by ASTRON. It has observing, data processing, and data storage facilities in
Article number, page 8 of 9R. Timmerman et al.: Origin of the ring structures in Hercules A; sub-arcsecond 144 MHz to 7 GHz observations
several countries, that are owned by various parties (each with their own fund-
ing sources), and that are collectively operated by the ILT foundation under a
joint scientific policy. The ILT resources have benefitted from the following re-
cent major funding sources: CNRS-INSU, Observatoire de Paris and Université
d’Orléans, France; BMBF, MIWF-NRW, MPG, Germany; Science Foundation
Ireland (SFI), Department of Business, Enterprise and Innovation (DBEI), Ire-
land; NWO, The Netherlands; The Science and Technology Facilities Council,
UK; Ministry of Science and Higher Education, Poland. The National Radio As-
tronomy Observatory is a facility of the National Science Foundation operated
under cooperative agreement by Associated Universities, Inc.
References
Bîrzan, L., McNamara, B. R., Nulsen, P. E. J., et al. 2008, ApJ, 686, 859
Bolton, J. G. 1948, Nature, 162, 141
Briggs, D. S. 1995, PhD thesis, New Mexico Institude of Mining and Technology
Brüggen, M., Heinz, S., Roediger, E., et al. 2007, MNRAS, 380, L67
Callingham, J. R., Ekers, R. D., Gaensler, B. M., et al. 2017, ApJ, 836, 174
Cotton, W. D. 2008, PASP, 120, 439
de Gasperin, F., Dijkema, T. J., Drabent, A., et al. 2019, A&A, 622, A5
Dreher, J. & Feigelson, E. 1984, Nature, 308, 43
Enßlin, T. A. & Gopal-Krishna. 2001, A&A, 366, 26
Fabian, A. C., Sanders, J. S., Taylor, G. B., et al. 2006, MNRAS, 366, 417
Fanaroff, B. L. & Riley, J. M. 1974, MNRAS, 167, 31P
Gizani, N. A. B., Cohen, A., & Kassim, N. E. 2005, MNRAS, 358, 1061
Gizani, N. A. B., Garrett, M. A., & Leahy, J. P. 2002, PASA, 19, 69
Gizani, N. A. B. & Leahy, J. P. 1999, NAR, 43, 639
Gizani, N. A. B. & Leahy, J. P. 2003, MNRAS, 342, 399
Gizani, N. A. B. & Leahy, J. P. 2004, MNRAS, 350, 865
Godfrey, L. E. H. & Shabala, S. S. 2013, ApJ, 767, 12
Greenstein, J. L. 1962, ApJ, 135, 679
Harwood, J. J., Hardcastle, M. J., & Croston, J. H. 2015, MNRAS, 454, 3403
Harwood, J. J., Hardcastle, M. J., Croston, J. H., & Goodger, J. L. 2013, MN-
RAS, 435, 3353
Jackson, N., Tagore, A., Deller, A., et al. 2016, A&A, 2016, A86
Jaffe, W. J. & Perola, G. C. 1973, A&A, 26, 423
Jubelgas, M., Springel, V., Enßlin, T., & Pfrommer, C. 2007, A&A, 481, 33
Kataoka, J. & Stawarz, Ł. 2005, ApJ, 622, 797
Kellerman, K. I., Pauliny-Toth, I. I. K., & Williams, P. J. S. 1969, ApJ, 157, 1
Lane, W. M., Cohen, A. S., Kassim, N. E., & Lazio, T. J. W. 2005, in Astronom-
ical Society of the Pacific Conference Series, Vol. 345, From Clark Lake to
the Long Wavelength Array: Bill Erickson’s Radio Science, 203
Mason, A., Morrison, P., & Sadun, A. C. 1988, Nature, 333, 640
McMullin, J. P., Waters, B., Schiebel, D., Young, W., & Golap, G. 2007, in CASA
Architecture and Applications, Vol. 376, 127
Meier, D. L., Sadun, A. C., & Lind, K. R. 1991, ApJ, 379, 141
Morabito, L. K., Jackson, N. J., Mooney, S., et al. 2021, A&A, this issue
Morrison, P. & Sadun, A. 1996, MNRAS, 278, 265
O’Dea, C. P., Baum, S. A., Tremblay, G. R., et al. 2013, ApJ, 771, 38
Offringa, A. R., McKinley, B., Hurley-Walker, et al. 2014, MNRAS, 444, 606
Perley, R. A. & Butler, B. J. 2017, ApjS, 230, 7
Planck Collaboration. 2020, A&A, 641, A6
Roger, R. S., Costain, C. H., & Bridle, A. H. 1973, AJ, 78, 1030
Sadun, A. C. & Morrison, P. 2002, AJ, 123, 2312
Saxton, C. J., Bicknell, G. V., & Sutherland, R. S. 2002, ApJ, 579, 176
Scaife, A. M. M. & Heald, G. H. 2012, MNRAS, 423, L30
Scheuer, P. A. G. & Williams, P. J. S. 1968, ARA&A, 6, 321
Shulevski, A., Morganti, R., & Barthel, P. D. 2015, A&A, 583, A89
Timmerman, R., Van Weeren, R. J., McDonald, M., et al. 2021, A&A, 646, A38
Van Diepen, G., Dijkema, T. J., & Offringa, A. 2018, ASCL, ascl:1804.003
Van Haarlem, M. P., Wise, M. W., Gunst, A. W., et al. 2013, A&A, 556, A2
Vantyghem, A. N., McNamara, B. R., & Russell, H. R. 2014, MNRAS, 442,
3192
Van Weeren, R. J., Williams, W. L., Hardcastle, M. J., et al. 2016, ApJS, 223, 2
Williams, W. L., Van Weeren, R. J., Röttgering, H. J. A., et al. 2016, MNRAS,
460, 2385
Wise, M. W., McNamara, B. R., & Nulsen, P. E. J. 2007, ApJ, 659, 1153
Wu, L.-H., Wu, Q.-W., Feng, J.-C., et al. 2020, Res. Astron. Astrophys., 20, 122
Article number, page 9 of 9You can also read