CSHINE for studies of HBT correlation in Heavy Ion Reactions
←
→
Page content transcription
If your browser does not render page correctly, please read the page content below
CSHINE for studies of HBT correlation in Heavy Ion Reactions∗
                                                                   Yi-Jie Wang,1, † Fen-Hai Guan,1 Xin-Yue Diao,1 Qiang-Hua Wu,1 Xiang-Lun Wei,2 He-Run Yang,2
                                                                  Peng Ma,2 Zhi Qin,1 Yu-Hao Qin,1 Dong Guo,1 Rong-Jiang Hu,2 Li-Min Duan,2 and Zhi-Gang Xiao1
                                                                                          1
                                                                                              Department of Physics, Tsinghua University, Beijing 100084, China
                                                                                                   2
                                                                                                     Institute of Modern Physics, Lanzhou 730000, China
                                                                       The Compact Spectrometer for Heavy Ion Experiment (CSHINE) is under construction for the study of
                                                                    isospin chronology via the Hanbury Brown−Twiss (HBT) particle correlation function and the nuclear equation
                                                                    of state of asymmetrical nuclear matter. The CSHINE consists of silicon strip detector (SSD) telescopes and
                                                                    large-area parallel plate avalanche counters, which measure the light charged particles and fission fragments, re-
                                                                    spectively. In phase I, two SSD telescopes were used to observe 30 MeV/u 40 Ar +197 Au reactions. The results
                                                                    presented here demonstrate that hydrogen and helium were observed with high isotopic resolution, and the HBT
                                                                    correlation functions of light charged particles could be constructed from the obtained data.
arXiv:2101.07352v1 [physics.ins-det] 14 Jan 2021

                                                                    Keywords: Silicon strip detector, Telescope, HBT correlation function, Nuclear equation of state

                                                                           I.   INTRODUCTION                                        and performance of the SSD telescopes in CSHINE. Af-
                                                                                                                                    ter a brief introduction to the phase-I setup of CSHINE in
                                                      The two-particle small-angle correlation function at small                    Sect. II, the performance of the SSD telescopes in the source
                                                   relative momenta, originally developed by Hanbury Brown                          test and beam experiment are presented in Sect. III. Sec-
                                                   and Twiss (HBT) [1], is a useful method for studying the                         tion IV presents the α − α correlation function obtained in
                                                   space-time characteristics of the nuclear reaction zone and                      the beam experiment and possible future applications. Sec-
                                                   the emission order of particles in heavy ion reactions at in-                    tion V presents a summary.
                                                   termediate beam energies [2–5]. In recent decades, the HBT
                                                   correlations of intermediate mass fragments and light parti-
                                                   cles have been widely measured [6–8], revealing many inter-                             II.   CSHINE DETECTION SYSTEM AND BEAM
                                                   esting space-time features of heavy ion reactions. As demon-                                        EXPERIMENT SETUP
                                                   strated in many experimental studies in nuclear physics over
                                                   a wide energy range, the application of silicon strip detectors                     In phase I, two main types of detectors are installed on
                                                   (SSDs) greatly improves the detector granularity and momen-                      CSHINE: SSD telescopes for charged particle measurements
                                                   tum resolution and has enabled the output of numerous novel                      and parallel plate avalanche counters (PPACs) for fission frag-
                                                   and intriguing physical results [9–16]. Similarly, more pre-                     ment measurements, which deliver the reaction geometry by
                                                   cise measurement of the HBT correlation function using this                      folding angle reconstruction. In addition, three Au(Si) sur-
                                                   technique can be expected.                                                       face barrier telescopes are installed at large angles to measure
                                                      In addition, the isospin dynamics has attracted attention be-                 the evaporated particles. Each SSD telescope is a three-layer
                                                   cause it carries considerable information about the nuclear                      detector with a single-sided SSD (SSSD) to measure ∆E1
                                                   symmetry energy [17–22], which is important not only in                          (layer 1), a double-sided SSD (DSSD) to measure ∆E2 (layer
                                                   heavy ion reactions but also in processes involving dense stel-                  2), and a 3×3 CsI(Tl) array for residual energy measurements
                                                   lar objects, including neutron star merging [23, 24]. To de-                     (layer 3). Both the SSSD and DSSD are the BB7 type (2 mm
                                                   termine the isospin migration rate, which reflects the effect                    strip width, 32 strips per side) from MICRON Company. The
                                                   of the symmetry energy, it is necessary to measure the emis-                     nominal thicknesses of these two layers of the SSD are 65
                                                   sion rate as a function of time of light charged particles with                  and 1500 µm, respectively. Owing to the 2 mm strip width,
                                                   different N /Z values from the reactions. This measurement                       the angular resolution in the beam experiment, which is a key
                                                   reveals the isospin chronology and requires high-resolution                      parameter for the measurement of the small-angle correlation
                                                   determination of both the position and energy to reconstruct                     function, is better than 1◦ .
                                                   the HBT correlation function, which must be done before the                         Each CsI(Tl) crystal is a square pyramid with dimensions
                                                   isospin-dependent emission time constant can be derived. For                     of 23 × 23 mm2 on the front side and 27 × 27 mm2 on the
                                                   this purpose, position-sensitive detectors with high granular-                   rear side and a height of 50 mm. The well-polished CsI(Tl)
                                                   ity and particle identification, for example, SSDs, are desired.                 crystals are wrapped with Teflon for good light reflection.
                                                      To experimentally measure the isospin chronology, we                          The entrance face is covered by 2-µm-thick single coat of
                                                   built the Compact Spectrometer for Heavy Ion Experiments                         aluminized Mylar foil, and the other sides are packed with
                                                   (CSHINE). This paper discusses mainly the construction                           black tape for tight light shielding. At the rear end of each
                                                                                                                                    CsI(Tl) crystal, there is no wrapping material, and the crystal
                                                                                                                                    is directly coupled to a S3204 photodiode (Hamamatsu) by
                                                                                                                                    BC-630 optical grease (Saint-Gobain). Each SSD telescope
                                                   ∗   This work was supported by the National Natural Science Foundation of        is mounted in an aluminum frame. The structural framework
                                                       China (Nos. 11875174 and 11961131010).                                       of each SSD telescope is shown in Fig. 1.
                                                   †   Corresponding author, yj-wang15@mails.tsinghua.edu.cn                           Each SSD has an energy resolution of approximately 1%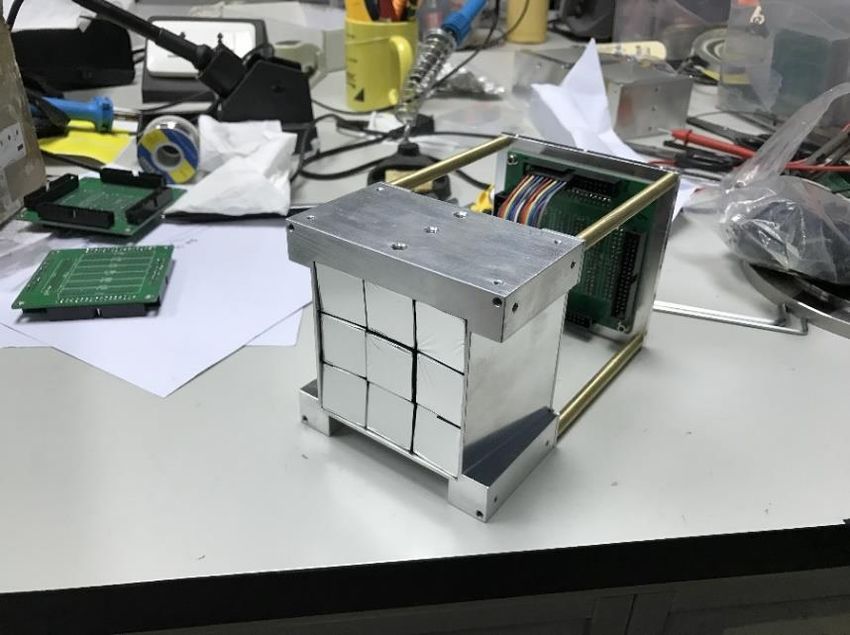
2

                                                                                  Beam Line I in Lanzhou (RIBLL1) at the Heavy Ion Re-
    SSSD                                                                          search Facility in Lanzhou, China. A 197 Au target with an
                                                           Cover plate
   DSSD                                                   Upper side plate        areal density of 1 mg/cm2 was bombarded with a 30 MeV/u
                                                                                  40
                                                          Upper cover plate          Ar beam. Although the entire CSHINE detection system
  CsI(Tl)
                                                          Trestle                 contains six SSD telescopes and three PPACs, in phase I, two
                                                                                  SSD telescopes and three PPACs were mounted for the beam
                                                          CsI shell
                                                                                  experiment. The SSD telescopes were installed at forward
                                                                                  angles to detect light particles at mid-rapidity in coincidence
                                                          CsI baseplate           with the fission fragments measured by the three PPACs. A
                                                                                  graph illustrating the CSHINE detection system geometry in
                                                          Side plate              the first experiment is shown in Fig. 2. Table 1 lists the dis-
                                                         Pillar                   tance d from the center of each detector to the target, the polar
                                                           Adapter plate          angle θ, the azimuthal angle φ, and the sensitive area S of the
                                                         Baseplate                two SSD telescopes and three PPACs in the experiment.
                                                                                     Each SSD telescope consists of one SSSD, one DSSD, and
                                                                                  one CsI(Tl) hodoscope containing 3 × 3 CsI(Tl) crystal units.
  Fig. 1. (Color online) Structural framework of SSD telescope.                   The SSSD has 32 readout strips on the front side, whereas
                                                                                  the DSSD has 32 readout strips on two sides perpendicular
                                                                                  to each other. A total of 96 individual silicon strips and 9
(full width at half-maximum, FWHM) for 5.15 MeV α parti-                          CsI(Tl) crystals require readout electronics. In a simple read-
cles, and the CsI(Tl) detector has an energy resolution of ap-                    out scheme, a compact pre-amplifier (MPR-16, Mesytec) and
proximately 20% (FWHM) for this α source. The other type                          main amplifier (MSCF-16, Mesytec) were used. The pulse
of detector, the PPAC, is a gas detector with a large sensitive                   height of the signals carrying the energy information was dig-
area (240 × 280 mm2 ), a two-dimensional position resolu-                         itized by a 12-bit analog-to-digital converter (ADC) (V785,
tion of approximately 1.35 mm, and a time resolution of less                      CAEN), and the timing information was digitized by a 12-bit
than 300 ps. These PPAC detectors were described in detail                        time-to-digital converter (V775, CAEN). Finally, all the digi-
in Ref. [25].                                                                     tal signals were recorded on a hard disk event-by-event using
                                                                                  a data acquisition system based on the VME standard. Fig. 3
       (a)                                        (b)                             presents the data flow of the SSD telescopes.
  SSD telescope              Si+Si+CsI                                               The CSHINE trigger system was designed for both the
                                                                                  beam experiment and calibration. Fig. 4 presents a diagram
   PPAC                                                                           of the trigger circuit. The timing signals of the PPACs were
                  Target
                                                                                  discriminated by a CF8000 module and logically calculated
                                                                                  by a CO4020 module to generate the PPAC inclusive signals
              CSHINE -I
                                                                                  and PPAC two-body coincidence signals. The logic hit sig-
       (c)                                        (d)                             nals of the SSD telescopes were obtained by the front side of
              SSD1                                               PPAC3            the DSSD (∆E2) and discriminated by the MSCF-16 mod-
                                                  PPAC1
          SSD2                                                                    ule, which generated an analog Multi-Trig signal proportional
                                                                 PPAC2            to the number of fired strips in this module (16 channels) and
                                                                                  sent it to the output on the rear panel. The Multi-Trig sig-
                                                                                  nals from all the MSCF-16 modules then proceeded to an
                                                                                  analog fan-in module (N625, CAEN) to form a summation
Fig. 2. (Color online) CSHINE detection system in phase I. (a)                    signal, the height of which represents the total multiplicity of
Sketch of CSHINE detection system. (b) Photograph of CSHINE                       the fired strips in the SSD telescopes. Then, both inclusive
detection setup in actual experiment. (c) Angular coverage of SSD                 and exclusive logic signals were generated by the discrimina-
telescopes. (d) Angular coverage of PPACs.                                        tor (CF8000 module) at different threshold settings. The logic
                                                                                  hit signals of the Au(Si) telescopes were generated from the
                                                                                  Au(Si) surface barrier detector in layer 2 and logically added
                                                                                  by an LF4000 module to create the inclusive signal of the
             TABLE 1. Experimental geometry parameters                            Au(Si) telescopes. After the width and time delay of every
  Detector                 d (mm)        θ (◦ )         φ (◦ )         S (mm2 )   logic signal were adjusted, the trigger signal for the experi-
  SSD-Tele1                161.9         50.7           81.7            64 × 64   ment was constructed. The trigger signal contains the coinci-
  SSD-Tele2                221.9         22.3           64.5            64 × 64   dence of the PPAC two-body and SSD light charged particle
  PPAC1                    427.5         50             0             240 × 280   inclusive events and the SSD two-body events for data acqui-
  PPAC2                    427.5         40             180           240 × 280   sition in the beam experiment. In addition, the inclusive trig-
  PPAC3                    427.5         95             180           240 × 280   ger for each detector was also constructed and was optionally
                                                                                  turned on for detector calibration before or after beam data
  The beam experiment was performed at Radioactive Ion                            acquisition.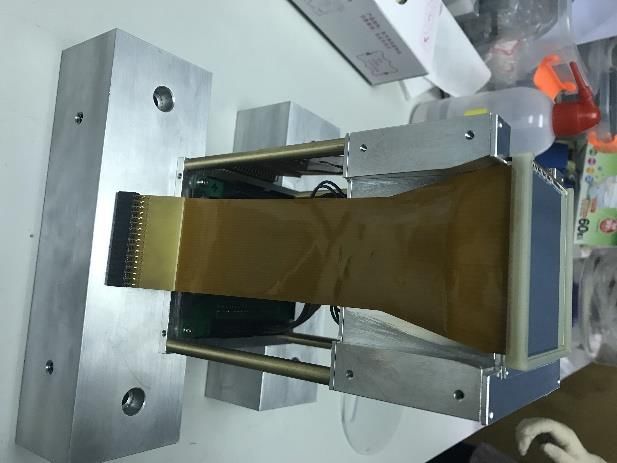
3
Pre-Amplifier Main-Amplifier Shaper Out
ADC_V785
SSD_Telescope (MPR-16) (MSCF-16)
Pre-Amplifier Main-Amplifier
(MPR-16) (MSCF-16) ADC_V785
Layer1-32CH Pre-Amplifier Main-Amplifier
(MPR-16) (MSCF-16) TDC_V775
Layer2
F-32CH
Pre-Amplifier Vacuum Main-Amplifier
(MPR-16) adapter flange (MSCF-16) Delay Timing
B-32CH
Pre-Amplifier Main-Amplifier
Layer3-9CH (MPR-16) (MSCF-16) ADC_V785
Pre-Amplifier Main-Amplifier
(MPR-16) (MSCF-16) ADC_V785
Pre-Amplifier Main-Amplifier
(MPR-16) (MSCF-16)
Fig. 3. Schematic of SSD telescope signal data flow.
Fig. 4. Diagram of CSHINE trigger system.
241
III. PERFORMANCE OF SSD TELESCOPES AND Am, respectively) can be separated clearly. Figure 5 (c)
PARTICLE IDENTIFICATION shows the position of the main peak of the α source for all the
strips in this telescope. The energy responses are distributed
A. Energy resolution of SSDs and CsI(Tl) in α source test
in a range corresponding to 120–180 ADC channels and show
significant variation. Although the variation in the peak po-
sition is quite large, the energy resolution of all the strips re-
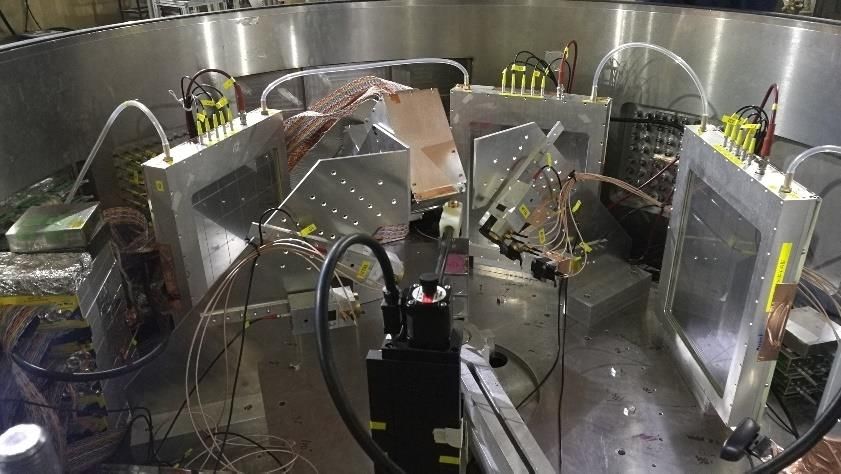
Figure 5 presents the structure of the DSSD and its per- mains uniform at approximately 1% (FWHM), as shown in
formance during a test using a 5.15 MeV α source for SSD Fig. 5 (d). The performance of this DSSD, which is installed
telescope 1. Figure 5 (a) presents a photograph of the tele- at a large angle, remains stable before and after the beam ex-
scope during assembly. Fig. 5 (b) shows the energy spectrum periment. Note, however, that the performance of the other
of the α source for a single strip. Because the energy loss DSSD, which is located near the beam axis and receives more
of light charged particles in the DSSD will be much larger in irradiation, gradually deteriorated, as reflected by the increas-
the beam experiment than that of 5.15 MeV α particles, low ing leakage current. To solve this problem, our experience
amplification was used so that the α peak appeared in low with a recent experiment indicates that it is necessary to cool
channels. The two peaks at 5.15 and 5.49 MeV (239 Pu and the detector using an alcohol refrigerator so that both the leak-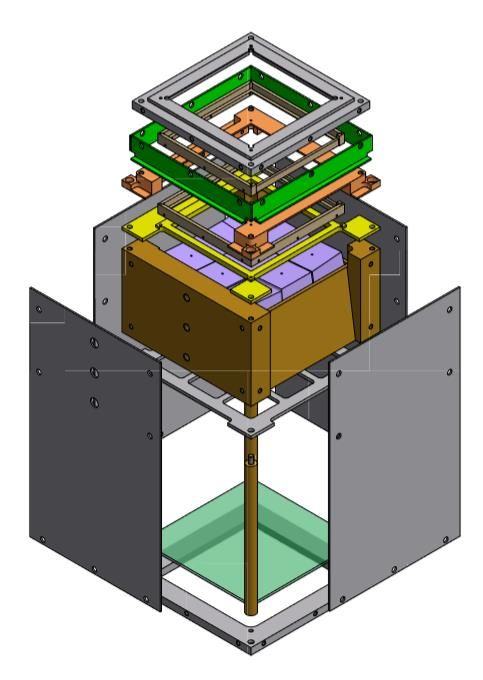
4

age current and the resolution remain unchanged during the                                                   B.   Signal sharing in SSD
beam experiment.
                                                                               Signal sharing is not negligible when the SSDs are used
                                                                            because the interstrip distance is only 0.1 mm. When an inci-
                              (a)                                     (c)
                                                                            dent particle strikes one strip in the detector, the neighboring

                                     Peak value
                                                                            strips are likely to deliver a signal including a certain portion
                                                                            of the total charge produced by ionization. The proportion of
                                                                            signal sharing events affects the efficiency of particle identi-
                                                                            fication. Taking the 65 µm SSSD as an example, Figure 7
                                                    Strip number            (a) shows the energy correlation spectrum in two neighboring
                              (b)                                           strips in the α source test. Most events are recorded by one
                                                                      (d)
                                                                            strip; the amplitude of the signal is located at the full energy
                                                                            position, and the signal of the neighboring strip is located in
                                                                            the pedestal, as indicated by the two rectangles in the plot. In
                                                                            addition, some events are located in the center of the coinci-
                                                                            dent plot connecting the two main peaks, where the sum of
                    channel                         Strip number            the energy of the two strips has a constant value correspond-
                                                                            ing to the full energy of the incident α particle. Figure 7 (b)
Fig. 5. (Color online) Energy resolution of DSSD with α source. (a)         presents the distribution of only signal-sharing events.
Photograph and sketch of DSSD. (b) Energy spectrum of α source
in a single strip. (c) Position of the main peak of the α source for
all strips in this telescope. (d) Energy resolution of all strips in this
telescope.                                                                                            3000                 3000
                                                                              Strip17 (ADC channel)

                                                                                                                           (a)                   (b)
   Figure 6 presents the same results, but for the 3 × 3 CsI(Tl)                                      2000                 2000      Sharing signal
array and the 5.15 MeV α source during offline calibration.
The energy resolution is only approximately 20% (FWHM)
[Fig. 6 (d)]. One possible reason for the low energy resolu-                                          1000                 1000
tion of the CsI(Tl) array is that the α particle is stopped at
a depth of 27 µm in the CsI(Tl) material (as calculated by
LISE++ [26]), which is much less than the total length of the                                            0                       0
                                                                                                             1000 2000               1000 2000
CsI(Tl) crystal (50 mm). The light response is significantly                                                        Strip16 (ADC channel)
suppressed, and the light transport efficiency is low. During
the beam experiment, the energy resolution for particles with
a larger stopping depth will be much higher (see text below).
                                                                            Fig. 7. (Color online) Energy correlation spectrum between two
                                                                            neighboring strips of the 65 µm SSSD for all (a) and only signal-
                               (a)                                    (c)   sharing (b) events.
                                       Peak value

                                                                               Figure 8 (a) presents the multiplicity of the firing strips in
                                                                            the α test after a pedestal cut, Mstr , is applied. Most of the
                                                                            events satisfy Mstr = 1 or 2, and the latter are contributed
                                                    Detector number         mainly by signal sharing in neighboring strips. By counting
                                                                            the events above the pedestal cut in the individual strips and
                               (b)                                    (d)
                                                                            the signal-sharing events of neighboring strips, the ratio of
                                                                            signal-sharing events on each strip is found to be less than 1%,
                                                                            as shown in Fig. 8 (b). This ratio is used as a reference value
                                                                            in the data analyses of the particle identification efficiency.

                    channel                         Detector number
                                                                                                             C.   Particle identification
Fig. 6. (Color online) Energy resolution of CsI(Tl) array with α
source. (a) Photograph of CsI(Tl) array. (b) Energy spectrum of                Figure 9 shows the scattering plot of the energy loss ∆E
α source in a single CsI(Tl) crystal. (c) Position of main peak of α        in the DSSD transmission detector in layer 2 versus the en-
source for all CsI(Tl) crystals in this telescope. (d) Energy resolution
                                                                            ergy E deposited in the CsI(Tl) crystal in the 30 MeV/u 40 Ar
of all CsI(Tl) crystals in this telescope.
                                                                            +197 Au reaction. In the beam experiment, we focused on the
                                                                            measurement of light charged particles; therefore, the energy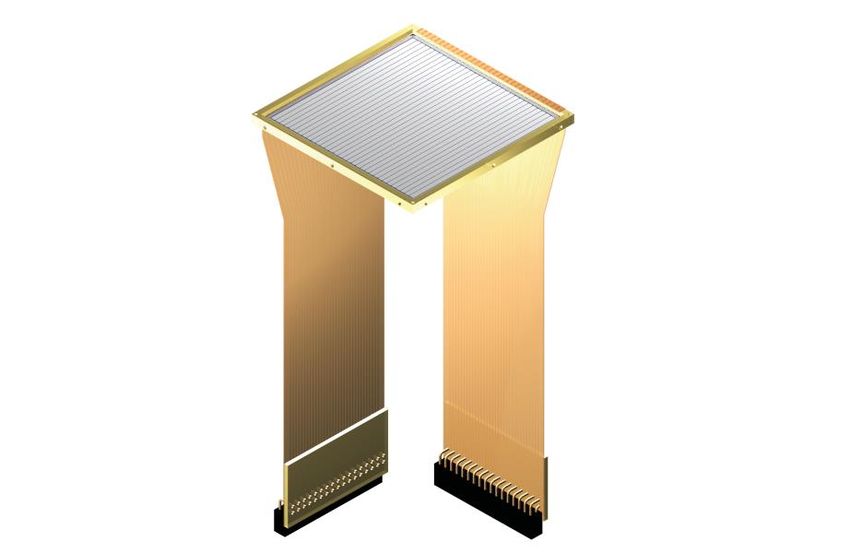
5

                                                                                                       Z=1       (a)                   Z=2       (b)
                               (a)                                          (b)

                                                    Every channel counts

                                     Counts
Counts

                                                    Signal-sharing counts

         Total fire strip number                       Strip number
                                                                                      Fig. 10. Mass spectra of Z = 1 (a) and Z = 2 (b) isotopes.

Fig. 8. Multiplicity Mstr of the firing strips after pedestal cut (a) in α        stopping depth of the 5.15 MeV α particles is very small at
test. Full energy counts and signal-sharing counts in each strip (b).             the surface. Because the data points are located around the
                                                                                  trend curve, as shown in Fig. 9, the bandwidth is attributed
                                                                                  to the finite energy resolution of the SSDs and CsI(Tl) array.
in layer 1 is very small and is not presented here. The spec-                     To extract the energy resolution of the CsI(Tl) array and the
trum shows that the isotopes of Z = 1 and 2 elements are                          DSSD, a Monte Carlo simulation was conducted. By varying
clearly separated in the entire measuring energy range. The                       the energy resolution of both units [∆E for the DSSD and E
mass resolution was obtained using the linearization method.                      for CsI(Tl)], different broadening of the mass spectrum can be
Briefly, the band of each isotope can be described by a trend                     simulated, and the mass resolution can be derived. This pro-
curve obtained by fitting manually chosen marker points with                      cedure can be performed in a divided range on the ∆E − E
a 14-parameter function. Each curve represents the mass of                        plot. Fig. 11 presents the experimental mass spectrum (a) and
the corresponding isotope. Then, during data sorting, for each                    ∆E − E plot (b), which are compared to the MC simulations
particle with a given (∆E - E) value, the vertical distances                      in (c) and (d), respectively. The σ value from the Gaussian fit
between the point (∆E - E) and the two neighboring curves                         of the α mass distribution is used to estimate the energy res-
define the experimental mass number. Figure 10 presents the                       olution. By comparing the width of the simulated mass peak
mass number spectra for Z = 1 (a) and Z = 2 (b) isotopes.                         with the experimental results, one can estimate the energy res-
By fitting each peak with a Gaussian function, the mass reso-                     olutions of both units, which are found to be correlated.
lution can be derived. As shown in Fig. 10 (b), a mass resolu-
tion of ∆M = 0.1 can be obtained for α particles. The acqui-
sition of a full scattering plot with high efficiency requires a                                           (a)                             (c)
sophisticated pattern recognition algorithm. The entire proce-                                   Experiment                    MC_Simulation
dure for determining the tracks using the event-by-event logic
for events with a total multiplicity of M = 1 and 2 will be re-
ported elsewhere.

                                                                                                           (b)                             (d)

                                              4He
                                                                                                 Experiment                    MC_Simulation

                           pd
                              t                                                   Fig. 11. (Color online) Comparison of experimental and MC sim-
                                                                                  ulation results in an E range from 500 to 1500 ADC channels. (a)
                                                                                  Mass distribution from experimental data and Gaussian fit of peak
                                                                                  for A = 4, (b) experimental ∆E − E scattering plot, (c) mass distri-
                                                                                  bution generated by MC simulation with energy resolution of 1.1%
                                                                                  (1σ) for ∆E and 2% for E (1σ) and Gaussian fit of peak for A = 4,
                                                                                  (d) simulated ∆E − E scattering plot.
Fig. 9. (Color online) Two-dimensional scattering plot of energy loss
∆E in SSD layer 2 versus the deposited energy E in one CsI(Tl)                       Figure 12 presents the contour of the mass resolution as
unit.                                                                             a function of the resolution ∆E of the DSSD and E of the
                                                                                  CsI(Tl) array in three E ranges. As both parameters increase,
   From the mass resolution, one can deduce the energy res-                       the variation in the mass distribution increases. The slopes
olution of the CsI(Tl) detector, which is expected to be better                   of the contour curves are different because of the bending
in the beam experiment than in the α source test because the                      of the ∆E − E band, as shown in Fig. 9. Thus, the en-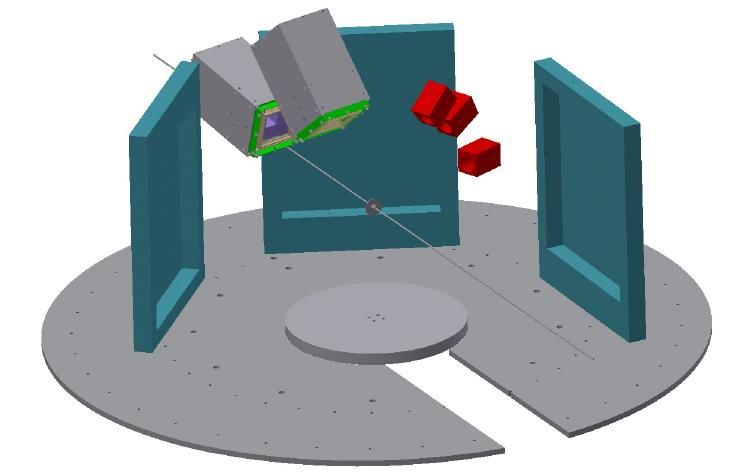
6

                                                                                                                                      (a)                               (b)
            0.012 (a)                         0.012
                                           0.095
                                                      (b)                  0.012    (c)

            0.011                   0.087                                                 0.08 0.094
                                                                         0.095
                                                                 0.084
     σ∆ E

                                                            0.075                                      0.11
             0.01                              0.01                          0.01

                                   0.075
                                                       0.065                              0.07
            0.009
                           0.065

            0.008                            0.008                         0.008

                    0.01     0.02            0.03 0.01         0.02        0.03 0.01         0.02      0.03
                                                             σE                                               Fig. 13. (Color online) CsI(Tl) energy calibration for Z = 1 (a) and
                                                                                                              Z = 2 (b) isotopes.

Fig. 12. (Color online) Monte Carlo simulation results of the total                                           gies E (MeV) in the CsI(Tl) can be computed for all points
mass resolution as a function of energy resolution ∆E for DSSD
                                                                                                              using the LISE++ code [26]. The relationship between the
and E for CsI(Tl) in three E ranges (in units of ADC channels) of
500 − 1500 (a), 1500 − 2500 (b), and 2500 − 3500 (c). The number                                              ADC channel number and the energy deposited (MeV) in
near the curve is the total mass resolution obtained in the simulation.                                       CsI(Tl) can be established. Figure 13 presents the energy cal-
The dashed curves correspond to the mass resolution obtained from                                             ibration of Z = 1 isotopes (a) and Z = 2 isotopes (b) for
the experimental data in each interval.                                                                       CsI(Tl). The response of CsI(Tl) is nonlinear and moderately
                                                                                                              dependent on the charge and mass of the light charged par-
                                                                                                              ticles. Moreover, a change in the nominal thickness of the
ergy resolutions of the DSSD and CsI(Tl) contribute different                                                 DSSD by a few percent has a very insignificant effect on the
weights to the total mass resolution in each range. The dashed                                                CsI(Tl) calibration.
curves in the plot represent the approximate total experimen-
tal mass resolution in the selected E range. A comparison
of Figs. 12 (a), (b), and (c) reveals that the experimental en-                                               IV.   APPLICATION OF SSD TELESCOPES AND FUTURE
ergy resolution of the DSSD, including the intrinsic energy                                                                    USES OF CSHINE
resolution and hit pattern recognition error, is approximately
σ∆E = 1.1% (1 σ), which is consistent with the result of                                                         SSD telescopes have been used mainly to measure the HBT
the α source test, whereas the energy resolution of CsI(Tl)                                                   correlation functions of light charged particles in the reaction
in the beam experiment is approximately σE = 2% (1σ), as                                                      30 MeV/u 40 Ar + 197 Au. The α − α correlation function can
indicated by the green bands. These results for the energy                                                    be used to check the performance and calibration of the de-
resolution of the SSD and CsI(Tl) are essential for physical                                                  tector. There are three peaks in the relative momentum spec-
analyses of the HBT correlation function.                                                                     trum of α pairs, which originate mainly from the decay of
                                                                                                              the resonant states of 8 Be and 9 Be. The malfunctioning of
                                                                                                              the telescope would result in an incorrect α − α correlation
                       D.      CsI(Tl) energy calibration                                                     function.
                                                                                                                 Figure 14 shows the α − α correlation function obtained
   The calibration of the CsI(Tl) unit is an important issue in                                               by the two SSD telescopes. Various peaks are expected to
the application of SSD telescopes [27]. The energy response                                                   appear in the correlation function. The peaks at 20 and 100
of the SSD is linear and independent of the particle species,                                                 MeV/c correspond to the decay of the unstable ground state
and it can be calibrated using an α source and a precision                                                    and 3.04 MeV excited state of 8 Be, respectively, whereas the
pulse generator. However, the signal response of the CsI(Tl)                                                  peak at 50 MeV/c corresponds to the decay of the 2.43 MeV
scintillators is nonlinear and depends on the particle charge                                                 excited state of 9 Be [28]. The positions of the three peaks are
and mass. Ideally, the absolute energy calibration of CsI(Tl)                                                 in agreement with the theoretical predictions, suggesting that
detectors requires various particle species with well-defined                                                 the performance of the SSD telescopes is acceptable.
charges, masses, and energies, which can be obtained using                                                       Isospin dynamics are very important for understanding the
the primary beam delivered by an accelerator.                                                                 effect of nuclear symmetry energy in nuclear collisions. By
   However, because accelerator time is costly, we use a sim-                                                 using the SSD telescopes in CSHINE, the correlation func-
pler method that is widely employed. The CsI(Tl) signal re-                                                   tions of different particle pairs can be measured to extract the
sponses are calibrated with the deposited particle energies us-                                               emission time constant and emission hierarchy of the species.
ing the ∆E − E plot. Because the SSD is well-calibrated,                                                      In addition, the isotope-resolved particles in coincidence with
from the plot one can read multiple points on the curve fol-                                                  the fission fragments measured using the PPACs in CSHINE
lowing each isotope, where ∆E is calibrated in MeV and E                                                      also carry information on the reaction dynamics. Thus, the
is calibrated using the raw ADC channel number. Given the                                                     CSHINE detection system is a useful tool for research on
nominal value of the thickness of the DSSD from the manu-                                                     the reaction dynamics and thermodynamics of nuclear matter
facturer and ∆E (MeV), the total energies and residual ener-                                                  produced in heavy ion collisions in the Fermi energy regime.
7
8Be
were used to construct the HBT correlation functions for light
ground state
charged particles. The performance was evaluated using the
α − α correlation function, and the three resonant states of
8
Be and 9 Be were correctly identified. CSHINE can be ex-
pected to offer opportunities for experimental studies of the
9Be* (2.43MeV) collision dynamics and nuclear equation of state in heavy ion
8Be* (3.04MeV) reactions at Fermi energies.
ACKNOWLEDGMENTS
We acknowledge the crystal group from IMP, CAS for pro-
Fig. 14. (Color online) α – α correlation function for 30 MeV/u viding the CsI(Tl) detectors, the RIBLL group for offering
40
Ar + 197 Au reaction. local help with the experiment, and the machine staff for de-
livering the argon beam.
V. SUMMARY
In summary, phase I of the CSHINE detection system, AUTHORS’ CONTRIBUTIONS
which consists of two SSD telescopes, three PPACs, and
three Au(Si) telescopes, was mounted and operated in the 30 All authors contributed to the study conception and de-
MeV/u 40 Ar + 197 Au reaction. The data analysis focusing on sign. Material preparation, data collection and analysis
the SSD telescopes demonstrated that hydrogen and helium were performed by Yi-Jie Wang, Fen-Hai Guan and Xin-Yue
isotopes were clearly identified using the ∆E − E method. Diao. The first draft of the manuscript was written by Yi-
The interstrip signal sharing in the SSSD is below 1%. The Jie Wang and all authors commented on previous versions
energy resolutions of the DSSD and CsI(Tl) are found to be of the manuscript. All authors read and approved the final
approximately 1% and 2%, respectively. The SSD telescopes manuscript.
[1] R. Hanbury Brown and R. Q. Twiss, A test of a new type of at 35 MeV/u. Phys. Lett. B 639, 436–440 (2006).
stellar interferometer on Sirius. Nature 178, 1046 (1956). DOI: https://doi.org/10.1016/j.physletb.2006.06.076
10.1038/1781046a0 [9] M.S. Wallace, M.A. Famiano, M.J. van Geothem et al., The
[2] Y. D. Kim, de Souza RT, D.R. Bowman, et al., Time scale for high resolution array (HiRA) for rare isotope beam exper-
emission of intermediate-mass fragments in 36Ar+197Au col- iments. Nucl. Instrum. Methods A 583, 302–312 (2007).
lisions at E/A=35 MeV. Phys. Rev. Lett. 67, 14-17 (1991). DOI: https://doi.org/10.1016/j.nima.2007.08.248
doi: 10.1103/PhysRevLett.67.14 [10] B. Davin, R.T de Souza, R. Yanez et al., LASSA: a large
[3] G. Verde, A. Chbihi, R. Ghetti et al., Correlations and char- area silicon strip array for isotopic identification of charged
acterization of emitting sources. Eur. Phys. J. A 30, 81-108 particles. Nucl. Instrum. Methods A 473, 302–318 (2001).
(2006). https://doi.org/10.1140/epja/i2006-10109-6 https://doi.org/10.1016/S0168-9002(01)00295-9
[4] D.Q. Fang, Y.G. Ma, X.Y. Sun et al., Proton-proton corre- [11] Q. Liu, Y.L. Ye, Z.H. Li et al., Investigation of the
lations in distinguishing the two-proton emission mechanism thickness non-uniformity of the very thin silicon-strip de-
of 23 Al and 22 Mg. Phys. Rev. C 94, 044621 (2016). DOI: tectors. Nucl. Instrum. Methods A 897, 100–105 (2018).
10.1103/PhysRevC.94.044621 https://doi.org/10.1016/j.nima.2018.04.041
[5] L. Zhou, D.Q. Fang, Effect of source size and emission [12] F. F. Duan, Y.Y. Yang, B.T. Hu et al., Silicon detector ar-
time on the p–p momentum correlation function in the two- ray for radioactive beam experiments at HIRFL-RIBLL. Nucl.
proton emission process. Nucl. Sci. Tech. 31, 52 (2020). DOI: Sci. Tech. 29, 165 (2018). https://doi.org/10.1007/s41365-018-
10.1007/s41365-020-00759-w 0499-5
[6] Z.Y. Li, G.M. Jin, Z.Y. He et al., A BGO detector ar- [13] G.L. Zhang, Y.J. Yao, G.X. Zhang et al., A detector setup for
ray and its application in intermediate energy heavy ion ex- the measurement of angular distribution of heavy-ion elastic
periments. Nucl. Instrum. Methods A 373, 198-201 (1996). scattering with low energy on RIBLL. Nucl. Sci. Tech. 28, 104
https://doi.org/10.1016/0168-9002(96)00007-1 (2017). https://doi.org/10.1007/s41365-017-0249-0
[7] Z.Y. He, L.M. Duan, G.M. Jin et al., The correlation func- [14] X.X. Xu, Fanurs C.E. Teh, C.J. Lin et al., Characteriza-
tions and emission time scales for light particlesand light tion of CIAE developed double-sided silicon strip detec-
fragments in Ar-40+Au-197 reactions 25 MeV/nucleon. Nucl. tor for charged particles. Nucl. Sci. Tech. 29, 73 (2018).
Phys. A 620, 214–228 (1997). https://doi.org/10.1016/S0375- https://doi.org/10.1007/s41365-018-0406-0
9474(97)00161-9 [15] S. Wang, W. Chen, J.H. Guo, Design and testing of a minia-
[8] Z.G. Xiao, R.J. Hu, H.Y. Wu et al., System dependence ture silicon strip detector. Nucl. Sci. Tech. 31, 7 (2020).
of the correlation function of IMFs in 36 Ar +112,124 Sn https://doi.org/10.1007/s41365-019-0714-z8
[16] D. X. Wang, C.J. Lin, L. Yang et al., Compact 16- Nucl. Sci. Tech. 31, 71 (2020). https://doi.org/10.1007/s41365-
channel integrated charge-sensitive preamplifier module for 020-00779-6
silicon strip detectors. Nucl. Sci. Tech. 31, 48 (2020). [23] B. P. Abbott et al. for LIGO collaboration. GW170817: Obser-
https://doi.org/10.1007/s41365-020-00755-0 vation of gravitational waves from a binary neutron star inspi-
[17] B.A. Li, L.W. Chen, C.M. Ko, Recent progress ral. Phys. Rev. Lett. 119, 161101 (2017). DOI: 10.1103/Phys-
and new challenges in isospin physics with Heavy- RevLett.119.161101
Ion Reactions. Phys. Rept. 464, 113-281 (2008). [24] B. P. Abbott et al. for LIGO collaboration. GW170817:
https://doi.org/10.1016/j.physrep.2008.04.005 Measurements of neutron star radii and equation
[18] B.A. Li, P.G. Krastev, D.H. Wen et al., Towards understanding of state. Phys. Rev. Lett. 121, 161101 (2018).
astrophysical effects of nuclear symmetry energy. Eur. Phys. J. DOI:https://doi.org/10.1103/PhysRevLett.121.161101
A 55, 117 (2019). DOI: 10.1140/epja/i2019-12780-8 [25] X.L. Wei, F.H. Guan, H. Yang et al., Development of par-
[19] Y. Zhang, J.L. Tian, W.J. Cheng et al., Long-time allel plate avalanche counter for heavy ion collision in ra-
drift of the isospin degree of freedom in heavy dioactive ion beam. Nucl. Eng. Technol. 52, 575-580 (2019).
ion collisions. Phys. Rev. C 95, 041602(R) (2017). https://doi.org/10.1016/j.net.2019.08.020
DOI:https://doi.org/10.1103/PhysRevC.95.041602 [26] O.B.Tarasov, D. Bazin, LISE++: Exotic beam pro-
[20] F. Zhang, J. Su, Probing neutron–proton effective mass split- duction with fragment separators and their design.
ting using nuclear stopping and isospin mix in heavy-ion col- Nucl. Instrum. Methods B 376, 185–187 (2016).
lisions in GeV energy region. Nucl. Sci. Tech. 31, 77 (2020). https://doi.org/10.1016/j.nimb.2016.03.021
https://doi.org/10.1007/s41365-020-00787-6 [27] D. Dell’Aquila, S. Sweany, K.W. Brown et al., Non-uniformity
[21] H. Yu, D.Q. Fang, Y.G. Ma, Investigation of the symme- effects on the light-output calibration of light charged particles
try energy of nuclear matter using isospin-dependent quan- in CsI (Tl) scintillator crystals. Instrum. Methods A 929, 162–
tum molecular dynamics. Nucl. Sci. Tech. 31, 61 (2020). 172 (2019). https://doi.org/10.1016/j.nima.2019.03.065
https://doi.org/10.1007/s41365-020-00766-x [28] J. Pochodzalla, C.K. Gelbke, W.G. Lynch et al. Two particle
[22] G.F. Wei, Q.J. Zhi, X.W. Cao et al., Examination of an correlations at smallrelative momenta for 40 Ar-induced reac-
isospin-dependent single-nucleon momentum distribution for tions on 197 Au at E/A=60 MeV. Phys. Rev. C 35, 5 (1987).
isospin-asymmetric nuclear matter in heavy-ion collisions. DOI: 10.1103/PhysRevC.35.1695You can also read