DAE : Discriminatory Auto-Encoder for multivariate time-series anomaly detection in air transportation
←
→
Page content transcription
If your browser does not render page correctly, please read the page content below
Noname manuscript No.
                                        (will be inserted by the editor)

                                        DAE : Discriminatory Auto-Encoder for multivariate
                                        time-series anomaly detection in air transportation
                                        Antoine Chevrot · Alexandre Vernotte · Bruno Legeard
arXiv:2109.04247v1 [cs.LG] 8 Sep 2021

                                        Received: date / Accepted: date

                                        Abstract The Automatic Dependent Surveillance-Broad-         1 Introduction
                                        cast protocol is one of the latest compulsory advances
                                        in air surveillance. While it supports the tracking of the   Over the past ten years, air traffic control has faced a
                                        ever-growing number of aircraft in the air, it also intro-   growing number of users and the traffic load keeps grow-
                                        duces cybersecurity issues that must be mitigated e.g.,      ing steadily. With an increasingly congested airspace,
                                        false data injection attacks where an attacker emits fake    numerous new issues are appearing such as flight de-
                                        surveillance information. The recent data sources and        lays. This increases the overall cost of the flights and
                                        tools available to obtain flight tracking records allow      exacerbates an already existing tendency for air com-
                                        the researchers to create datasets and develop Machine       panies to close down1 in favour of low-cost companies.
                                        Learning models capable of detecting such anomalies          In another vein, congestioned airports imply that the
                                        in En-Route trajectories. In this context, we propose a      planes stay longer in taxiways which is where they are
                                        novel multivariate anomaly detection model called Dis-       the least efficient (Polishchuk et al., 2019), increasing
                                        criminatory Auto-Encoder (DAE). It uses the baseline         their fuel consumption as well as their particle emis-
                                        of a regular LSTM-based auto-encoder but with several        sions (Zhang et al., 2019).
                                        decoders, each getting data of a specific flight phase           To tackle these new challenges, Air Traffic Control
                                        (e.g. climbing, cruising or descending) during its train-    (ATC) needs improved surveillance technologies sup-
                                        ing. To illustrate the DAE’s efficiency, an evaluation       porting the constraints in terms of simultaneously han-
                                        dataset was created using real-life anomalies as well as     dled aircraft as well as overall accuracy. The Automatic
                                        realistically crafted ones, with which the DAE as well       Dependent Surveillance-Broadcast (ADS-B) protocol is
                                        as three anomaly detection models from the literature        currently being deployed world-wide in an effort to im-
                                        were evaluated. Results show that the DAE achieves           prove flights management. ADS-B requires participat-
                                        better results in both accuracy and speed of detec-          ing aircraft to broadcast their information periodically
                                        tion. The dataset, the models implementations and the        in an encoded message, like a beacon.          This tech-
                                        evaluation results are available in an online repository,    nology embodies the shift from independent and non-
                                        thereby enabling replicability and facilitating future ex-   cooperative surveillance technologies, historically used
                                        periments.                                                   for aircraft surveillance, to dependent and cooperative
                                                                                                     technologies. In this new context, ground stations need
                                                                                                     aircraft to cooperate and are dependent on aircraft’s
                                        Keywords Anomaly Detection · Multivariate time
                                                                                                     Global Navigation Satellite System (GNSS) capabilities
                                        series · ADS-B · DAE · Air traffic security
                                                                                                     to determine their position.
                                                                                                         Nonetheless, ADS-B is not a new protocol. The ICAO
                                        A. Chevrot, A. Vernotte, B. Legeard
                                                                                                     (International Civil Aviation Organization) issued a plan
                                        DISC/FEMTO-ST Institute, UBFC, CNRS
                                        Besançon, France                                              1 https://www.nbcnews.com/news/world/british-travel-
                                        Tel.: +333-81-66-20-87                                       firm-thomas-cook-collapses-stranding-hundreds-thousands-
                                        E-mail: name.lastname@femto-st.fr                            n1057456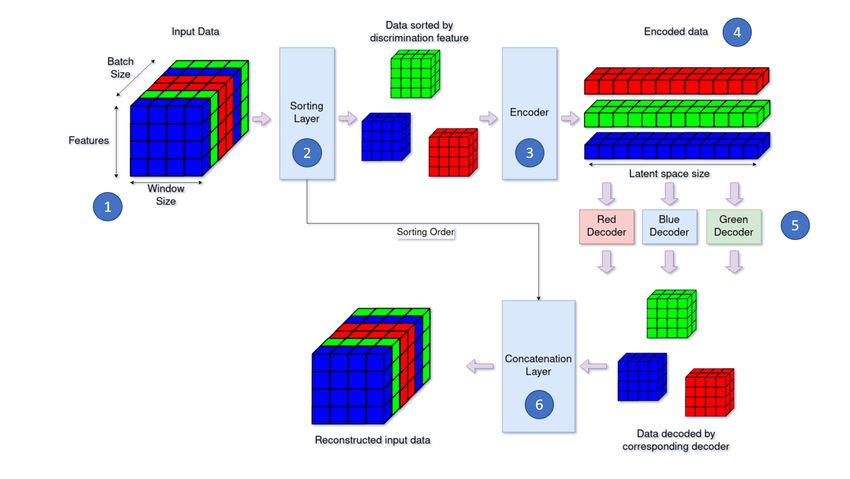
2                                                                                               Antoine Chevrot et al.

in 2002 2 recognizing ADS-B as an emerging technol-          en-route trajectory anomalies (Olive and Basora, 2019)
ogy for dissemination of aircraft position information.      or spoofing attempts (Ying et al.).
In 2021, ADS-B is now compulsory in most air-spaces              This paper presents a novel type of auto-encoder to
but the protocol itself stayed sensibly the same as it was   use for anomaly detection in ADS-B. The main contri-
imagined twenty years ago and the security was not in        butions of this work is listed hereafter:
the highest priority. As a result, anyone with the proper
equipment can receive and create messages freely. This       (i) The DAE –Discriminatory auto-encoder–, a novel
liberty in both emission and reception make ADS-B                asymetric auto-encoder addressing fluctuations in
vulnerable to spoofing, and more precisely to attacks            time series. To the best of our knowledge, this is
called FDIA — False Data Injection Attack — which                the first time auto-encoders are used with a single
purpose is to create fake surveillance messages respect-         encoder connected to several decoders for anomaly
ing conscientiously the protocol in order to dupe the air        detection in time-series.
traffic controllers to believe in an abnormal situation.    (ii) The full data framework using existing tools includes
                                                                 the data cleaning, the feature extraction and the
                                                                 data serialization for model training. Emphasis is
    Although ADS-B is not the only protocol used for
                                                                 made on replicability through a code repository pub-
flights tracking – e.g radar technologies –, it is, as of
                                                                 licly accessible.
today, a central brick in the means of surveillance used
                                                           (iii) Realistic and replicable validation scenarios are cre-
by public air transportation. In this context, there has
                                                                 ated using an alteration tool to experiment with dif-
been a growing interest for conducting research on anomaly
                                                                 ferent types of anomalies. It results in a dataset also
detection systems that address these new threats (Strohmeier
                                                                 available online to compare future models and pro-
et al., 2015b). Among the different existing solutions,
                                                                 vide a common base for benchmarks and studies.
some are based on Machine Learning (ML) anomaly de-
                                                           (iii) Experimental results using the abovementioned val-
tection models. These models already find applications
                                                                 idation scenarios to compare the different existing
in many different domains like power systems (Wang
                                                                 solutions of ML anomaly detection showing that the
et al., 2018) or sensor networks (Malhotra et al., 2016)
                                                                 DAE performs well overall.
and are found quite popular in recent years. One down-
side of these models is their need for consequent data           To present the model and the different results achieved
availability to achieve meaningful results. It is indeed     with it, this paper has been organized as follows:
critical for ML researchers to have access to reliable and       Section 2 provides a basis for understanding the
genuine data sources to train their models. Thankfully,      ADS-B protocol, an explanation on FDIAs and the risks
for ADS-B data, the OpenSky Network (Schäfer et al.,        associated with it. Section 3 presents previous works
2014) is one of the references in terms of accessibil-       done on anomaly detection for the ADS-B with an em-
ity and data history in air transportation, and one can      phasis on Machine Learning based techniques. Section 4
easily obtain surveillance data from almost anywhere         introduces the novel anomaly detection model devel-
on the globe. This access to genuine data and the lacks      oped in this paper by detailing its architecture. Sec-
of anomalous ones in comparison favours one particular       tion 5 details the process of data gathering and pro-
architecture of ML model called auto-encoders.               cessing to obtain proper training data for the model.
    Auto-encoders are unsupervised ML models often           Section 6 presents the evaluation of this paper, show-
used for anomaly detection and can be found in the           casing the data used and the different results obtained
literature in many different forms. These models use         using different anomaly detection models. Follow some
a first network called the encoder which encodes the         discussions about implementation and caveats in Sec-
input data into a latent representation which is then        tion 7. Section 8 concludes this paper.
decoded by a second network called the decoder. The
discrepancies between the input data and the output
ones are then used to detect anomalies in the origi-         2 Background
nal data. They can be coupled with Recurrent Neural
Networks - RNN - to address the temporality of the           2.1 ADS-B overview
data (Malhotra et al., 2016). Shown to be quite effec-
tive, they have already been used in the past to detect      Communication via ADS-B consists of aircraft using
different types of anomalies in the ADS-B protocol like      a Global Navigation Satellite System (GNSS) to de-
                                                             termine their position and broadcasting it periodically
  2 https://www.icao.int/publications/Documents/9750_        without solicitation (a.k.a beacons or squitters), along
2ed_en.pdf                                                   with other information obtained from on-board systems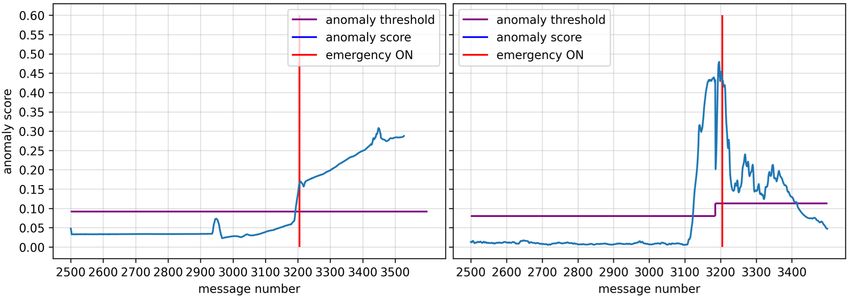
DAE : Discriminatory Auto-Encoder for multivariate time-series anomaly detection in air transportation                3

such as altitude, ground speed, aircraft identity, head-       valuable network resources, or even physical damage.
ing, etc. Ground stations pick up on the squitters, pro-       Active research regarding FDIAs has been conducted
cess them and send the information out to the ATC              in the power sector, mainly against smart grid state es-
system. The ADS-B data link is generally carried on            timators (Dan and Sandberg, 2010; Liu et al., 2011).
the 1090MHz frequency. ADS-B is therefore a coop-              It shows that these attacks may lead to power black-
erative (aircraft need a transponder) and dependent            outs but can also disrupt electricity markets (Xie et al.,
(on aircraft data) surveillance technology, which con-         2010), despite several integrity checks.
stitutes a fundamental change in ATC. It means for                 FDIAs also exist in the domain of air traffic surveil-
instance that not only ground stations with antennas           lance. Because surveillance relies on the information
positioned at the right angle and direction can receive        provided by aircraft’s transponders to ground stations,
position information. Aircraft can now receive squitters       aircraft transponders are equivalent to nodes from a
from other aircraft, which notably improves cockpit sit-       wireless network, and ground stations are equivalent to
uational awareness as well as collision avoidance.             base stations. Although in the ATC domain, there is no
    The introduction of ADS-B also provides controllers        real effort to penetrate the sensor network, as all com-
with improved situational awareness of aircraft posi-          munications are unauthenticated and in clear text. Still,
tions in En-Route and TMA (Terminal Control Area)              performing FDIAs on surveillance communications re-
airspaces, and especially in NRAs (Non Radar Areas).           quires a deep understanding of the system, its proto-
It theoretically gives the possibility of applying much        col(s) and its logic, to covertly alter the surveillance
smaller separation minima (e.g., from 80NM longitu-            flow. These attacks are much more complex to achieve
dinal separation to just 5 NM in NRAs) than what               than e.g., jamming, because the logic of the commu-
is presently used with current procedures (Procedural          nication flow must be preserved and the falsified data
Separation) (51, 2005). It has a much greater accuracy         must appear probable.
and update rate, with a smaller latency. The major                 The means of the attacker to conduct FDIAs against
drawback of the technology lies in its lack of encryption      ADS-B communications have already been detailed in
and authentication, which is discussed in the following        previous work (Strohmeier, 2016; Manesh and Kaabouch,
section.                                                       2017). Considering the attacker has the necessary equip-
                                                               ment, they can perform three malicious basic opera-
                                                               tions:
2.2 False Data Injection Attacks
                                                               (i) Message injection which consists of emitting non-
The progressive shift from independent and non-co-                 legitimate but well-formed ADS-B messages.
operative technologies (PSR/SSR (Skolnik, 2008)) to           (ii) Message deletion which consists of physically delet-
dependent and cooperative technologies (ADS-B) has                 ing targeted legitimate messages using destructive
created a strong reliance on external entities (aircraft,          or constructive interference. It should be noted that
GNSS) to estimate aircraft state. This reliance, along             message deletion may not be mistaken for jamming,
with the introduction of air-to-ground data links via              as jamming blocks all communications whereas mes-
Modes A/C/S and the broadcast nature of ADS-B, has                 sage deletion drops selected messages only.
brought alarming cyber security issues. Extensive re-        (iii) Message modification which consists of modifying
search can be found in the literature that discuss these           targeted legitimate messages using overshadowing,
issues (Schäfer et al., 2013; Zhang et al., 2017; Wesson          bit-flipping or combinations of message deletion and
et al., 2014; Strohmeier et al., 2017), stressing that the         message injection.
introduction of ADS-B has enabled a class of attack
referred to as False Data Injection Attacks (FDIAs).
    FDIAs were initially introduced in the domain of               One can sense the potential for disaster if one of
wireless sensor networks (Ma, 2008). A wireless sen-           these operations was to be executed successfully. It is
sor network is composed of a set of nodes (i.e. sen-           of the utmost importance that none of the scenarios
sors) that send data report to one or several ground           represent a real threat to such a critical infrastructure
stations. Ground stations process the reports to reach         with human lives on the line. However, because of the
a consensus about the current state of the monitored           inherent properties of the ADS-B protocol, current so-
system. A typical scenario consists of an attacker who         lutions for securing ADS-B communications are only
first penetrates the sensor network, usually by compro-        partial or involve an unbearable cost Strohmeier et al.
mising one or several nodes, and thereafter injects false      (2017). Therefore, ATC systems must become robust
data reports to be delivered to the base stations. This        against FDIAs, i.e. being capable of automatically de-
can lead to the production of false alarms, the waste of       tecting any tempering with the surveillance communi-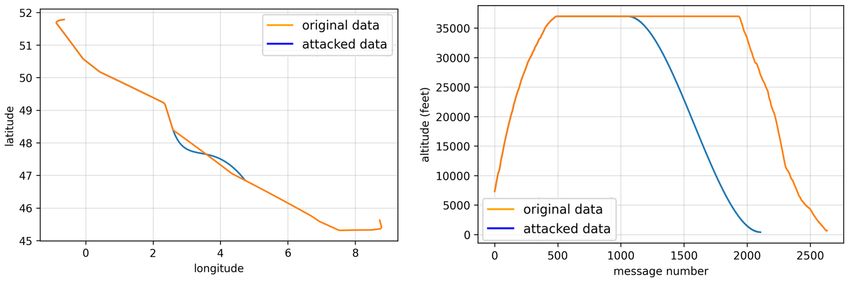
4                                                                                                 Antoine Chevrot et al.

cation flow while being able to maintain the infrastruc-      work to encrypt the ADS-B. Similarly, Cook (2015) uses
ture in a working state.                                      Public Key Infrastructure (PKI) to try and secure ADS-
                                                              B but it either suppresses the open characteristics of
                                                              ADS-B or requires a change in the protocol itself. Fur-
3 Related Work                                                ther discussion and analysis can be found in a survey
                                                              by Strohmeier et al. (2015b).
Several takes on improving the security of the ADS-
B protocol can be found in the literature. These ef-
forts often fall under several categories but for clarity’s   3.2 Machine Learning based anomaly detection
sake, these have been separated into two main cate-           techniques
gories here: one grouping technologies like multilater-
ation or encryption to name a few and the other one           It is quite common for anomaly detection approaches
grouping Machine Learning based techniques.                   to rely on multiple sources of data that each represents
                                                              one aspect of the environment it characterizes, in order
                                                              to find hidden/complex relationships between sources
3.1 Security solutions for ADS-B protocol                     and rely on these to identify abnormal situations. As
                                                              an example, one can use satellite images to check real
Many works on securing the ADS-B protocol using dif-          positions of aircraft to confront them against received
ferent technologies already exist with different degrees      ADS-B data (Kastelic and Pers, 2019).
of feasibility. First, multilateration techniques or MLAT         In the air surveillance domain, there are multiple
can be used to determine an aircraft position based on        surveillance mechanisms (ADS-B, but also legacy radar
measures of time of arrivals (TOAs) of radio feeds. Each      technologies, multilateration, voice communication, etc)
ADS-B message is timestamped and broadcast by air-            working simultaneously so that air traffic controllers get
craft. If several radars with synchronized clocks and         the clearest possible air situation picture. But there are
known positions received the same ADS-B feed, then            many areas of the world where most mechanisms could
it is possible to calculate the position of the aircraft      not be deployed, and the sole automated technology
based on the differences of TOAs. MLAT can be used            that could is ADS-B (e.g., in the center of Australia, or
to detect ADS-B anomalies (Monteiro et al., 2015) and         anywhere offshore). Therefore, one of the goals of this
has the advantage to be very accurate. Recent work            work is to find out whether ADS-B alone is enough data
from Zhao et al. (2020) also use MLAT to improve the          to train machine learning models toward the detection
ADS-B protocol accuracy as well as increasing the ro-         of false data reports.
bustness of the surveillance systems. Fute et al. (2019)          Multivariate time series anomaly detection is an ac-
show experimentally that FDIAs can also be created to         tive topic in the Machine Learning community. Super-
attack multilateration systems assuming an organized          vised learning methods (Karam et al., 2020) require the
attacker with several devices to emit fake ADS-B prov-        training data to be labeled and thus can only identify
ing that MLAT can have ultimately similar issues as           anomalies found in said data. As a result, supervised
ADS-B w.r.t. FDIAs.                                           models have limited usability here and unsupervised
    Regarding the use of the physical layer informa-          approaches are preferred.
tion, Strohmeier et al. (2015a) create an intrusion de-           Several efforts toward securing ADS-B using unsu-
tection system based on the strength of the signals           pervised Machine Learning techniques can be found in
they received from 2 different sensors. Similarly, Schäfer   the literature. Li et al. (2020) use an hidden Markov
et al. (2016) use the Doppler shift measurements to ver-      model to predict hidden states of the ADS-B protocol
ify the En-Route positions of aircraft over time. Using       and uses them to analyze the deviations during attacks
the clocking system of the Mode-S sensors, Leonardi           to detect them. Its results however did not show any
(2019) manages to obtain similar results to multilat-         advantages compared to other Machine Learning solu-
eration systems regarding on-board anomalies without          tions like Recurrent Neural Network (RNN) based mod-
the hassle of having at least 4 different sensors. Yang       els in terms of accuracy or false positive rate (FPR).
et al. (2019) used Machine Learning methods such as           Auto-encoders (AE) are a deterministic family of un-
Gradient Boosting or Support Vector Machine to suc-           supervised machine learning anomaly detection models
cessfully flag anomalies on the PHY-layer features of         often used in the latest publications concerning ADS-
ADS-B.                                                        B security. Often coupled with RNNs like LSTM or
    On another level, several solutions were proposed         GRU (Malhotra et al., 2016), they have shown good ac-
for encrypting ADS-B. Based on the identity of air-           curacy to detect coarse anomalies (Habler and Shabtai,
craft, Baek et al. (2017) describe a confidentiality frame-   2018), or more specific behaviours (Olive et al., 2018;
DAE : Discriminatory Auto-Encoder for multivariate time-series anomaly detection in air transportation 5
M ×N
Olive and Basora, 2019). Li et al. (2019) use LSTM- N ), i.e. xt = [x1t , x2t , . . . , xM
t ] such that x ∈ R .
based auto-encoders in a generative adversarial network The dimension M represents the number of features in
(GAN) as a mean to avoid an anomaly threshold selec- an observation xt . In the domain of anomaly detection
tion but misses proper metrics like recall or precision to in time series, the goal is to find out if an observation xt
correctly prove the efficiency of this method. Akerman is anomalous or not. However, time windowsare usually
et al. (2019) use similar LSTM-AE along with convo- preferred to single observations in order to get a better
lutional networks to provide images of the traffic and understanding of the evolution of the data over time.
the anomalies to improve the user experience of such A Time window Wt−T:t ∈ RM ×(T +1) is a set of T + 1
solution. observations {xt−T , xt−T+1 , . . . , xt } from time t − T
A stochastic variation of the auto-encoder called to t. The goal is then to determine if a particular time
variational auto-encoder (VAE) are shown to be us- window is anomalous or not.
able on detecting anomalies in time-series like in the Even though time windows always come from the
works of Park et al. (2018). Unlike a traditional auto- same time series, some external contextual factors may
encoder, which maps the input onto a latent vector, alter the shape of the time windows over time. For in-
a VAE maps the input data into the parameters of a stance, Figure 1 clearly shows that ADS-B time win-
probability distribution, such as the mean and variance dows created out of a single flight will have signifi-
of a Gaussian. Applied to the anomaly detection for cant differences depending on the phases they are taken
ADS-B, Luo et al. (2021) uses an LSTM-VAE model from. Hence, every time window Wt−T:t is associated
coupled to a support vector data description (SVDD) with a discrimination feature Dt−T:t to address these
model to automatically generate its anomaly threshold discrepancies. The goal of this feature is to mark dif-
showing good results on similar coarse anomalies in- ferences between time windows whether it is time wise,
troduced by Habler and Shabtai (2018). However, as nature wise etc. This can be seen as a static feature
pointed by Su et al. (2019), simply coupling LSTM and that is used by the model in the likes of Miebs et al.
VAE together ignores the temporal dependence for the (2020) but which is not a part of the training per se.
stochastic variables. It also assumes a gaussian distri- For instance the flight phases from which ADS-B time
bution of the z-space of the ADS-B data which can lead windows are taken are used as discrimination feature in
to mediocre results depending on the given data. this paper.
Compared with the presented models, the approach
developed in this paper is a deterministic uneven auto-
encoder using a single encoder to create a latent repre-
sentation of the ADS-B data linked to several decoders,
each getting different data chosen thanks to a discrimi-
nating feature. This idea was used by Yook et al. (2020)
to separate the sound received by speakers placed dif-
ferently but to the best of our knowledge, was never
used in the anomaly detection field. As a result, the
latent space created from the single encoder well rep-
resents the ADS-B data while the different specialized
decoders well capture the information, addressing the
variability of the time series over certain period of time,
resulting into better detection.
Fig. 1: The 3 different phases of a flight used as
discriminating feature
4 DAE : Discriminatory auto-encoder
4.1 Problem statement
The task of detecting abnormal ADS-B messages falls 4.2 Model architecture
into the category of anomaly detection in multivari-
ate time-series. A time series contains successive ob- The basis of the DAE model itself uses the architecture
servations which are usually collected at equal-spaced of a classic auto-encoder model (Liou et al., 2014) made
time-stamp. A multivariate time series x of length N of an encoder and a decoder. The main difference is its
is defined as x = {x1 , x2 , . . . , xN }, where an observa- unbalanced numbers of encoder and decoder depending
tion xt ∈ x is an M -dimensional vector at time t(t ≤ on the discriminating feature presented previously. This6 Antoine Chevrot et al.
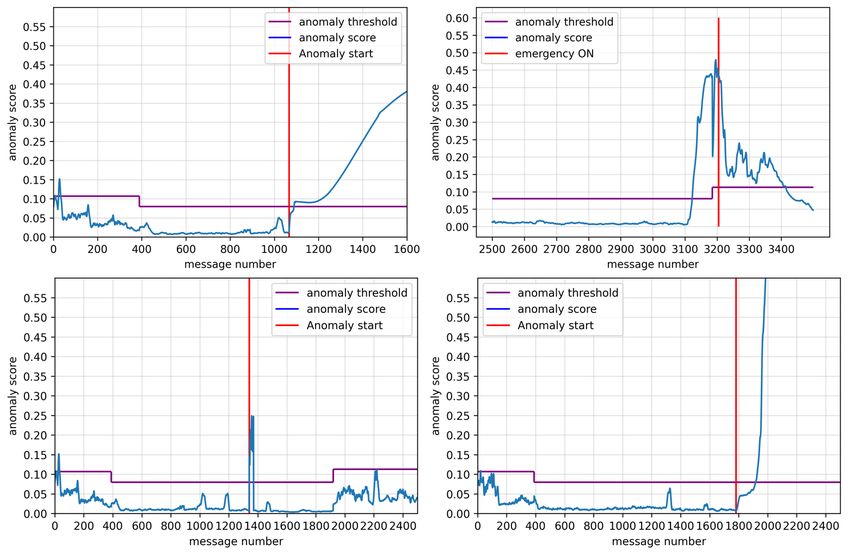
Fig. 2: Architecture of the DAE model
section explains the different parts of the model that this time span. Alternatives to RNNs are LSTMs and
can be found in the Figure 2. more recently the GRU, which do not suffer from the
vanishing gradient problem thanks to a system of gat-
1 Input Data: The input data are constituted of
ing units. In most cases these variants perform equally,
2 parts. On one hand, the multivariate time-windows
and while GRU can have less parameters on smaller
are the actual data entering the model. These are 3-
dataset, LSTMs having a separate update gate and for-
dimensional arrays, shaped to be used in RNN layers.
get gate can be more effective on longer sequences than
On the other hand, the discriminating data is a one-
the GRU. To add up additional context to the latent
dimensional array which associate each time-window to
representation of the ADS-B time windows, a bidirec-
a discriminant feature.
tional mechanism is added in the encoder layer in order
2 Sorting Layer: The sorting layer separates the to use both close past and future to encode the data.
batches of windows into mini-batches according to the 4 Latent Space: The latent representation captures
discrimination feature. Each mini-batch is then encoded the normal patterns of the ADS-B multivariate time
seamlessly. The sorting layer sends the order of the dif- series, considering their time dependence thanks to the
ferent windows to reconstruct the batch as is to the LSTM used in the encoding network. The dimension
concatenation layer. The number of mini-batch depends of this vector is important in the DAE as a small value
on the number of values the discriminant can take. For would likely underfit the input time series while a larger
instance, the discriminating feature used in the evalua- one would increase drastically the training time of the
tion of this paper is the phase of the flight which is set model. The dimension is usually smaller than the orig-
to 3 (ascending, cruising and descending). inal number of features found in the input data but in
3 Encoder: One can use recurrent neural networks the case of the DAE, the time dependency itself need to
(RNN) to address the time aspect of the data. The be taken into account, explaining a larger size dimen-
main problem of classic RNNs is their struggle to learn sion in the latent space than the input. Precise dimen-
the long-term dependencies in a sequence because of sion used during experimentation is showcased in the
the gradient vanishing during learning. ADS-B time Section 6
windows can be up to 60 seconds long and the model 5 Discriminated Decoders: The decoding part of
must remember what the state of the aircraft was in the DAE is mainly what makes it different from a reg-DAE : Discriminatory Auto-Encoder for multivariate time-series anomaly detection in air transportation 7
ular auto-encoder. While the encoder encodes all the using a mix of positive and negative to make it more
mini-batches yield by the sorting layer seamlessly at the robust to outliers contained in the training set. Un-
same time, the decoding part is carried out by several fortunately, in the case of ADS-B, not only real life
decoders, one per mini-batch. This leads to specialized anomalous examples are scarse, but the data also tend
decoders depending on the data they received during to contain outliers due to already discussed problems
their training. Compared to the encoder, the decoders which make an SVDD hard to use successfully on real
are composed only of a single LSTM layer and not a Bi- not-over-processed data.
LSTM as it was not deemed important for the decoding For simplicity and efficiency, the 3-sigma rule is used
since the information was already included in the latent to calculate the threshold for the DAE. Considering
representation. As a result, the DAE is asymmetrical each decoder has its own output distribution, the cal-
in two ways: the numbers of encoders and decoders are culation for the threshold is done on the training data
different and the encoder is overall bulkier than the de- for each one of them. The threshold τ is defined as
coders. This is justified by the importance of the quality τ = µ + 3σ where µ is the mean of the anomaly score
of the encoder knowing it is alone to complete its task. distribution of one decoder and σ is its standard vari-
6 Concatenation Layer: this layer uses the order ation. This results in having a threshold value being
kept in memory by the sorting layer to reconstruct the different depending on the decoder the data went in.
data w.r.t. its original order. It is solely used for the The distribution of the anomaly scores, which roughly
training due to the use of different thresholds for each following a normal distribution (see Figure 3), assures
decoder for the anomaly detection, making this con- the 3-sigma rule to yield a low false positive rate while
catenation layer obsolete once training is over. being sensitive enough to flag anomalies.
4.3 The thresholds calculation and the anomaly
detection
Once the data is reconstructed by the decoders, the in-
put and the output are compared to calculate a similar-
ity score. The higher this score is, the better the model
managed to recreate the input time series. Here, each
time window Wt−T:t gets its own reconstruction score
calculated by, for instance, a mean squared error. Af-
ter training, instead of using directly the reconstruction
score, an anomaly score is defined as: Fig. 3: The anomaly score’s distributions of the training
data for each phase along with its calculated thresholds
n
1X
Anomaly(Wt−T:t ) = 1 − (xi − x̂i )2 (1)
n i=0 5 Dataset creation and pre-processing
This score is compared against a threshold to deter- Apart from the DAE, another contribution of this pa-
mine if the window associated to it contains an anomaly per is the availability of a dataset to train and eval-
or not. As discussed in the previous section, the model uate multivariate anomaly detection models. This sec-
has different decoders trained on different data. As a tion presents the different tools used for the creation of
result, the loss of each decoder is going to be different, the dataset as well as the pre-processing to obtain the
leading to anomaly scores not being equivalent across final data.
the different decoders. In this context, having the same
anomaly threshold for all the decoders would be coun-
terproductive and lead to mediocre metrics.
Calculating the threshold can be done in several
ways. Luo et al. (2021) uses support vector data de-
scription (SVDD) to determine automatically the best
threshold to use. SVDD is an unsupervised model that
creates boundaries around the training dataset that is
then used on testing data to determine whether they
are out of bounds (i.e. anomalous). It is usually trained8 Antoine Chevrot et al.
Fig. 4: The data architecture used for gathering consist of series of messages, once decoded, can be sep-
and processing ADS-B messages into training arated into well defined flights.
data. As mentioned earlier, the relevant ADS-B messages
are sent from position, velocity and identification mes-
sages. These messages are, according to the ADS-B
5.1 Global architecture specification, sent by the transponder every half-second
for the position and velocity messages and once ev-
In Figure 4 is described the overall architecture used to ery five seconds for the identification ones. This very
train the DAE. After retrieving data from the Open- short timeframe between receptions leads to a conse-
sky Network, the data pre-processing cleans the data, quent amount of data with a non-negligible redundancy.
getting rid of aberrations caused by decoding errors or Traffic allows for the downsampling and the concatena-
sensor inaccuracy and then creates the different fea- tion of the different messages. The original timeseries
tures needed for training. Through serialization, the are then transformed from several messages per seconds
processed data are then sent to the Model training block down to one every two seconds. This has the clear ad-
which creates the windows and standardizes the data vantage of reducing the size of the dataset without los-
inside the Tensorflow’s data.io framework to stream the ing meaningful data due to the high redundancy implied
data directly during the training using tfrecord format. by the high-rated emissions. Another valuable gain from
The model learns the normal patterns of flights through this reduction of messages is the amount of informa-
regular historical data and outputs an anomaly score tion contained into a time window. Indeed, without the
for each time windows. These normal anomaly scores re-sampling, a time window of 30 messages would be
are then used to determine a threshold which separate equivalent to around 13 seconds of recording. Chang-
normal data from anomalous ones using the 3-sigma ing the original rate of messages to 2 seconds bring the
rule. The model can then be used on unseen data to 30 messages window to a full minute of recording. This
determine their nature by calculating its score. If the strongly impacts both the training time of the model
score is under the threshold, then the time window is as well as its accuracy as it improves the time depen-
considered normal, else, it is considered abnormal. dencies developed by the RNN layers.
3 Scifly is a toolbox additional to Traffic3 developed
in the context of the current work. Despite using data
5.2 Data acquisition
from a well-covered area like Europe, errors in decod-
ing the data or approximation from sensors still happen
1 Opensky Network is an online flight tracking net- which often result in big leaps of the aircraft during a
work which provide access to data collected by cooper- flight. These corrupted data are undesired in training
ative ground stations. The large-scale dataset of this dataset and would result in lower quality models. To
evaluation is historical data extracted from their his- filter out these blatant outliers, we check the distance
torical database. in kilometers between close neighbour messages (con-
2 Traffic (Olive, 2019) is an open-source Python- secutive ones) and separated messages.
based tool allowing users to query the Opensky Network The other use of Scifly is to export the ADS-B data
historical database. It simplifies the data gathering by in TFRecord. TFRecord format uses protocol buffers 4
aggregating the different types of ADS-B messages (po- to serialize data making it available to a large share of
sition, velocity and identification) as well as making machine learning algorithms. It also have the advantage
the data cleaning less cumbersome. The Opensky Net- to allow to shard the data in multiple files to parallelize
work data comes in two main different forms available the input data for optimize training. Lastly, Scifly al-
to the user : one in a form of already processed and lows the exporting and importing of data to and from
cleaned data called state-vectors and the other in raw FDI-T, our anomaly creation platform.
messages in BEAST format. While the former would
be a time-saver, it would not yield full control over the
data preparation. On the other hand, getting the raw 5.3 FDI-T
transmission not only gives more freedom to the user
FDI-T is a testing framework that we developed (Ver-
but also allows experiments using directly an ADS-B
notte et al., 2021) jointly with Smartesting (https:
feed delivered by a private antenna. With recent itera-
//www.smartesting.com) and Kereval (https://www.
tions of Traffic, the processing of raw data has become
much easier. With the implementation of a clustering 3 https://github.com/Wirden/scifly
algorithm used by Sun et al. (2017), the raw data which 4 https://developers.google.com/protocol-buffers/DAE : Discriminatory Auto-Encoder for multivariate time-series anomaly detection in air transportation 9
kereval.com/). It allows ATC experts to design FDIA but most are filtered out from the data cleaning pro-
scenarios to alter (i.e. create, modify and delete) recorded cessing explained above.
legitimate ADS-B surveillance messages. The altered – Tracking Delta. Difference between the tracking
recordings can then be played back (w.r.t. time re- received through ADS-B and the ideal tracking cal-
quirements) onto real surveillance systems or can be culated from the position of the aircraft and the
exported e.g. to train and/or validate Machine Learning position of the arrival airport.
models. The goal is to simulate an attacker tampering – Vertical Rate in feet/mn. Represents the aircraft’s
with the surveillance communication flow. vertical speed – the positive or negative rate of al-
The types of alteration to apply are specified through titude change with respect to time.
the definition of alteration scenarios, of which the de- – Groundspeed in knots. Represents the speed over
sign is textual-based via a Domain Specific Language ground.
(DSL). Once designed, the scenarios are automatically – Phases. Categorical feature used as the discrimi-
applied on source recordings of air traffic surveillance nating feature to choose the decoder. The fuzzy logic
communications, thanks to a dedicated alteration en- developed by Sun et al. (2017) is used to automat-
gine (Cretin et al., 2020). Alteration scenarios have ically determine the phase a window is originated
various parameters, such as a time window, list of tar- from. In addition, a rule has been added forcing the
geted aircraft, triggering conditions, and others param- cruising phase when the flight is over 300 kilome-
eters related to the alteration’s type. All parameters ters away from the departure or arrival airport. This
are recording agnostic, meaning that scenarios can be helps when the fuzzy logic labels a crash as a simple
applied to multiple recordings regardless of their na- descending maneuver. Figure 1 shows the different
ture. All these features truly make the creation of ML phases of a flight automatically determined by the
dataset a fast albeit precise procedure. Scifly algorithm.
Concretely, FDI-T was used in this study to create
It is worth noting that some base features of ADS-B
many of the scenarios that constitute the evaluation
like the tracking, the latitude and the longitude are not
dataset.
directly used in the dataset. Concerning the tracking,
the feature being a cyclic feature in degree, experiments
were made using the sine and cosine component to avoid
5.4 Training data the discontinuity implied by having a heading varying
between 0 and 360 when 0 and 360 being de facto the
The different flight routes used for the training can same angle. Unfortunately, having two features for the
be visualized in Table 1. It compiles together 15 flight heading instead of one doubled its impact on the model
routes for a total of 1008 flights. The training dataset is and created some unbalance hence the choice for the
exclusively focused on internal European flights. This heading delta feature presented earlier.
choice is motivated, mainly, by the excellent land cover- In a similar fashion, the latitude and longitude also
age of the Opensky Network in this area. This ensures being cyclical data were turned into the consecutive
good quality data without major discrepancies due to delta feature. Another reason for this change is the will
low quality ground station or non-covered area. The to make the model area-agnostic which would have been
dataset is composed of both long and short flights, as impossible with the coordinates as is as features. This
well as flights traveling in different directions to ensure will improve the accuracy of the models on data they
data diversity. From the data gathered through the de- have not seen during their training, as shown by Fried
scribed architecture, only some features of ADS-B mes- and Last (2021).
sages are kept and fed to the model:
– Altitude in feet given by the airborne position mes- 5.5 Evaluation Data
sages.
– Consecutive Delta in kilometers. This is the Vin- The evaluation dataset is composed of different scenar-
centy distance between two consecutive messages ios to test different situations an anomaly detection
calculated from the latitudes and longitudes. This model could be used in. It is a mix of regular data
distance is bound to change from 2 main factors. taken from real life and anomalies created or not using
The first one is the change of speed of the aircraft the FDI-T framework. All the anomalies, except the
and the second one is the absence of messages picked one already found in real data, are applied on all the
up by the OpenSky Network. The third reason would flights found in the training dataset found in Table ??
be errors in decoding or from sensor malfunctions from January 2021 instead of the last 3 months of 2020:10 Antoine Chevrot et al.
Departure airport Arrival airport Number of flights Duration (hours)
Athens (LGAV) London (EGGW) 56 3.6
Berlin (EDDB) Kiev (UKBB) 33 1.6
Budapest (LHBP) Dublin (EIDW) 43 2.8
Frankfurt (EDDF) Lisbon (LPPT) 68 2.5
Hamburg (EDDH) Barcelona (LEBL) 29 2.0
Kiev (UKBB) Paris (LFPG) 83 3.3
London (EGGW) Milan (LIMC) 46 1.6
Madrid (LEMD) Moscow (UUEE) 59 4.2
Malaga (LEMG) Frankfurt (EDDF) 81 2.9
Manchester (EGCC) Istambul (LTFJ) 75 3.8
Munich (EDDM) Lisbon (LPPT) 68 3.3
Paris (LFPG) Oslo (ENGM) 34 1.9
Stockholm (ESSA) Barcelona (LEBL) 25 3.2
Vienna (LOWW) Copenhagen (EKCH) 83 1.3
Zurich (LSZH) London (EGLL) 225 1.2
Hamburg (EDHI) Hawarden (EGNR) 45 1.5
London (EGLL) Moscow (UUEE) 184 4.0
Table 1: Flights used for the training of the different models presented. 15 flight routes data taken
from September to December 2020 for training and 2 flight routes taken in January 2021 for
validation.
Fig. 5: Constant position offset attack
World Data (WORLD) – As the training dataset 25 feet, the second will be lowered by 50, etc. The Fig-
is exclusively composed of data from European flights, ure 6 shows a velocity drift used during the evaluation
including regular data from other parts of the world in
the testing dataset allows for checking the genericity Made-up Crashes (CRASH) – Using FDI-T, life-
of the approach. It includes flights from the european like crashes scenarios can be created combining an al-
airspace, american airspace – e.g. Dallas to Louisville – titude drift, a negative vertical rate, and a reduction of
or australian airspace – e.g. Camberra to Perth –. groundspeed – not to be mistaken with airspeed –. The
signal is then stopped once the aircraft lands. Figure 7
shows some of the features modified during a CRASH
Gradual Drift (DRIFT) – Anomalies that con- attack.
sist of simulating an altitude drift or a velocity drift.
The altitude or velocity messages on the attacked time Ryanair Hijack (HJK) – Constituted of the Ryanair
window are all raised/lower by an increasing/decreasing flight 4978 from Athens to Vilnius which was forcibly
multiple of n feet. So, if the first message is lowered by diverted to Minsk after entering the Belarus airspaceDAE : Discriminatory Auto-Encoder for multivariate time-series anomaly detection in air transportation 11
Fig. 6: Velocity drift attack
Fig. 7: Crash attack. Latitude / longitude on the left and the altitude on the right.
Other features like vertical speed or track are also modified realistically.
on the 23rd of May 20215 . It is to be noted that the 6 Experimental Evaluation
emergency was turned on by the crew 2 minutes after
the flight started to change its course. For the evalua- This section presents the experimental evaluation of the
tion, the labels have been set to 1 from the beginning model presented above. It also display the differences
of the emergency till the landing. in performance between the DAE and other anomaly
detection methods.
Constant position offset (OFFSET) – This ano-
maly, when toggled takes the real data of a flight and
adds an offset of 1 in both the latitude and the lon-
6.1 Model training specifications
gitude (see Figure 5). This offset represents a distance
of around 132 kilometers between the original and the The DAE model was trained with the training dataset
anomalous trajectory. above-mentioned which represent 336 Mo of data sep-
arated into 15 tfrecord files. Tensorflow interleaves the
data contained in these files to feed it to the model
during the training avoiding risks of memory overflows.
5 https://www.flightradar24.com/blog/ryanair-flight- The training was made on the Mésocentre de Calcul
4978-to-vilnius-forcibly-diverted-to-minsk/ de Franche-Comté using a Tesla V100 performing at12 Antoine Chevrot et al.
7.8 TeraFLOPS. The training on average was taking line dataset for future models in the growing field of
around 26 minutes per epoch. In Figure 8 a difference anomaly detection in ADS-B data.
in loss between the training set and the validation set
can be observed. It is due to a few outliers in the train-
6.2 Compared Results against other ML methods
ing set which make the average training loss way higher
than its validation counterpart.
To show the overall performance of the DAE, it is com-
pared with 3 other unsupervised approaches for anomaly
detection in ADS-B time-series : a regular Isolation For-
est (Liu et al., 2008) model, an LSTM-auto-encoder (Habler
and Shabtai, 2018), and a VAE-SVDD (Luo et al., 2021).
Table 2 shows the accuracy, the recall, the FPR and the
F1 score on the different dataset for each model. For the
VAE-SVDD, the method to choose the anomaly thresh-
olds is already given in the paper and the F1 score
is calculated accordingly. For the other models, the 3-
sigma ruled is applied on the training data to choose
the threshold meaning that approximately 99.7% of the
training data anomaly score are under this value. Over-
all, these experimentation results demonstrate the su-
periority of the DAE compared with the state-of-the-art
approaches in ADS-B anomaly detection. Indeed the
F1 score on the Total Dataset is more than 20% over
the second best performing model (not considering the
Fig. 8: The training loss per epoch. In blue is the
IForest for the reasons explained later). It is to be noted
training loss, in pink the validation loss
that the WORLD dataset does not have any true pos-
To train the DAE of which the results can be found itives nor false negatives which automatically set the
in the following section, windows of 30 messages have Recall to Nan (division by zero) and the F1 to 0. Next,
been used. The batch-size is 256. The number of units we analyze the performance of the different methods in
in the encoder’s BiLSTM is 32 which is then flattened detail.
to feed a Dense layer reducing the dimension to 10, the LSTM-AE is a sequence to sequence model based on
chosen latent space size. The different decoders each a encoder-decoder reconstruction used by Habler and
embed a single LSTM layer with 32 units. For the other Shabtai (2018) for anomaly detection in ADS-B time-
models found in the evaluation, the features, the hyper- series. This simple deterministic model well manages
parameters and the threshold selection method found to capture the ADS-B normal behaviour in its latent
in their respective papers were used if provided. space showing very low FPR using a 3-sigma threshold
In order to properly evaluate and compare the differ- as well as decent results on the Velocity Drift dataset.
ent models performance, accuracy (ACC), Recall (R), Its very low F1 score on the Made-up Crash dataset can
False be explained by the data resembling a regular descent
Positive Rate (FPR) and F1-score (F1) are used: trajectory which leads the decoder to reconstruct the
TP+TN
Acc = TP+TN+FP+FN
R = TP
data as is. Lowering the threshold to a 2-sigma could
TP+FN help raising the F1 score but would result to a FPR
FP
FPR = FP+TN being way too high for anomaly detection. From the
2TP metrics alone, the DAE seems to be under-performing
F =
1 2TP+FP+FN
where TP, FP, FN and TN being the values found in a compared to the LSTM-AE for the hijack anomaly. This
regular 2x2 contingency table. can be explained by looking at Figure 9 which compares
All the results and implementation of this paper the anomaly score over the message windows for both
are accessible on the Scifly 6 Github repository. The models. One can observe that for the DAE, the anomaly
full dataset used for the different models can also be is set off before the actual emergency due to its delay
found at this address. This is made as an effort to im- with the diversion of the flight. It explains the FPR
prove the replicability of the presented evaluation as being way higher than the other models and displays
well as proposing a non-exhaustive, upgradable base- the reactivity of the DAE in such circumstances. On
the other hand, the low recall is due to the score going
6 https://github.com/Wirden/scifly back to a normal value after some time which meansDAE : Discriminatory Auto-Encoder for multivariate time-series anomaly detection in air transportation 13
Evaluation Dataset Evaluation metric LSTM-AE IForest VAE-SVDD DAE
World Data Accuracy 0.994 0.687 0.899 0.989
Recall NaN NaN NaN NaN
FPR 0.006 0.313 0.101 0.011
F1 score 0 0 0 0
Ryanair Hijack Accuracy 0.946 0.890 0.722 0.847
Recall 0.637 1 0.227 0.301
FPR 0.001 0.129 0.231 0.017
F1 score 0.778 0.729 0.152 0.439
Velocity drift Accuracy 0.933 0.944 0.949 0.961
Recall 0.809 0.957 0.930 0.912
FPR 0.001 0.063 0.043 0.012
F1 score 0.886 0.937 0.926 0.939
Constant position offset Accuracy 0.519 0.709 0.541 0.526
Recall 0.033 0.491 0.077 0.053
FPR 0.001 0.073 0.046 0.004
F1 score 0.060 0.598 0.107 0.097
Made-up Crash Accuracy 0.506 0.919 0.710 0.962
Recall 0.003 0.922 0.426 0.929
FPR 0.001 0.084 0.037 0.004
F1 score 0.005 0.925 0.573 0.955
Total Accuracy 0.780 0.830 0.764 0.857
Recall 0.371 0.843 0.415 0.549
FPR 0.002 0.132 0.092 0.010
F1 score 0.544 0.797 0.440 0.738
Table 2: Comparison of the different models evaluated
the DAE does not label the end of the flight as abnor- a Gaussian qnet being too simple to properly recon-
mal from its ADS-B data. struct ADS-B information coming from other parts of
the world, negating the advantages of having such an
architecture.
VAE-SVDD is a variationnal auto-encoder (VAE)
coupled with a support vector data description model
(SVDD) to automatically determine its threshold. A Isolation Forest is an anomaly detection algorithm
VAE is a deep Bayesian model which represents an in- using an ensemble of isolation trees to differentiate nor-
put xt to a latent representation zt with a reduced di- mal data from anomalies. It has the advantage of being
mension, and then reconstructs xt by zt . The main dif- fast, light-weight and can be quickly implemented. The
ference with a regular auto-encoder is that the latent model yields good results when compared to the other
variable zt is sampled from a probability distribution, models, which is explained by the evaluation dataset
such as a Gaussian distribution with the mean and the being based on the same flights as the training data but
standard variation being outputs of the encoder net- one month later. The IForest manages to flag anomalies
work. This stochastic approach could explain the bet- on flights it has already seen or in the vicinity of these
ter results compared to the regular LSTM-AE on the said flights – for instance, the Ryanair Hijack – with-
Made-up Crash and Velocity drift dataset. Luo et al. out any trade-off except its FPR. Indeed, the FPR is on
(2021) combine LSTM and VAE by replacing the feed- average almost ten times higher than the DAE’s which
forward network in a VAE to GRU but do not include makes it hard to use as a reliable anomaly detector. It
information from zt − 1 into zt in the likes of Su et al. would even be completely pointless on flights in part of
(2019). That might explain the issues the VAE-SVDD the world it did not see during its training.
has to properly represent the distributions of the in- Summary. Compared to the LSTM-AE with a sin-
put data, leading to high FPR compared to the other gle decoder, the DAE, thanks to its specialized de-
methods. All in all, the VAE-SVDD, while performing coders, manages to discriminate anomalous situations
well on coarse anomalies like the velocity drift and to like crashes from regular descent operations while keep-
some extents the Made-up Crash thanks to its stochas- ing a very similar low FPR overall. Compared to the
ticity, fails to reconstruct properly ADS-B data leading VAE-SVDD, the DAE performs better on all dataset
to high FPR on new data and mediocre results over- except on the constant position offset where all mod-
all. This could be explained by the limitation of having els perform poorly due to the scenario’s very nature.14 Antoine Chevrot et al.
Fig. 9: Anomaly score for the LSTM-AE on the left and the DAE on the right for the
Ryanair hijack flight.
Fig. 10: DAE anomaly scores for a flight taken randomly from the different evaluation dataset. The
top-left figure is from the CRASH dataset, the top-right is from the Ryanair hijack, the bottom-left
is from the constant position offset and the bottom-right is from the velocity drift dataset
Indeed, the small offset added to the latitude and lon- being cost-effective and accurate on the few flights it
gitude is not enough to trigger alarms leading to ex- has seen during its training, is not as dependable as
tremely low F1 scores. This anomaly can only be de- the LSTM-AE or the DAE, limiting its usage in real-
tected by the LSTM or GRU based models when the life applications.
values are changed. Finally, the IForest model, despiteDAE : Discriminatory Auto-Encoder for multivariate time-series anomaly detection in air transportation 15
7 Discussion airport including congestion management and level
flight. These results could be improved by adding
The DAE model shows good results on the chosen eval- other decoders taking level phase data or conges-
uation dataset compared to other ADS-B anomaly de- tion management data.
tection models. Here are some discussion points and – In this experiment, all the decoders of the DAE have
caveats for using and improving the model in future the same hyper-parameters and the same architec-
works: ture. One could decide to make one decoder bulkier
or smaller depending on the data fed to it. In the
– The first assumption made for the usability of these
case of the ADS-B, the climbing and the descend-
models is the authenticity of the data used dur-
ing data being more complex, it would make sense
ing the training. If data sources like sensors or the
to have deeper or bigger decoders.
Opensky-Network were to be attacked, the models
– Having a FPR higher than zero can be a problem
trained from these corrupted sources would not be
in the air traffic management as it would trigger
able to detect ADS-B anomalies properly.
unnecessary measures to take care of false alarms.
– Flight trajectories, while being overall linear over
Unfortunately, it is not easy task to create a model
the same routes, can have inconsistent trajectories,
sensitive enough to detect all kind of anomaly with-
mainly due to fluctuating weather or congestion prob-
out ever have false positives. On Figure 10, the false
lems. This results in ADS-B time-series having a tol-
positives observed barely exceed the threshold while
erance margin when used to train ML models. This
the anomaly scores like the one on the Ryanair hi-
means that all attacks made within this margin will
jack will almost reach five times the threshold value.
likely end up not being detected if the attacker care-
Adding other soft thresholds – e.g. four or five sigma
fully conforms to the ADS-B protocol and to the
rule – to determine the gravity of the anomaly could
flight plan.
help discarding the false alarms in most cases and
– The DAE in its current state does not support on-
on the other hand could raise emergencies if the
line learning and therefore cannot be updated to
anomaly score would go too high, disregarding en-
the latest ADS-B data. However, all the data used
tirely the rest of the flight. This strategy would help
in the evaluation dataset are from 2021 while the
in the case of anomaly spikes like in the constant po-
training data were from 2020 showing no significant
sition offset.
differences between them. This result only has two
explanations: either the data does not change sig-
nificantly enough over time to make a difference or
8 Conclusions and Future Work
the model is robust enough to not be disturbed by
small changes. Only future data will give proper in- Detecting anomalies in the ADS-B protocol can greatly
sight to answer this. In addition, the low FPR on the improve the monitoring and troubleshooting of the airspace
world dataset shows that the model is area-agnostic for the air traffic managers in a timely manner. In this
thanks to the features and the data-processing used paper, we introduced the DAE, a novel auto-encoder ar-
for the data. This avoid the training of different chitecture to detect anomalies in ADS-B multivariate
models for specific regions. time-series which work efficiently in any ADS-B cov-
– One of the downside of the creation of realistic sce- ered area, with low chances of false alarms. Thanks to
narios through a framework like FDI-T is the intro- a complete data acquisition framework and tools avail-
duction of a tool bias which could lead to the de- able online, a baseline dataset was created to train, val-
tection of anomalies being eased. While this would idate and evaluate machine learning models implemen-
question a supervised approach being trained using tation, also fully open-accessible. The results presented
said data, for the unsupervised approach, it only on this dataset show that the DAE model perform as
shows that models are able to detect these abnormal well or better than other comparable anomaly detection
scenarios. If coupled with a few real life examples of models and can be more reactive on emergencies.
anomaly situation, it only constitutes contents to Potential future work following these results can be
prove the robustness of the models. separated in two main areas:
– The Ryanair anomaly is detected the quickest by the
DAE but it is also the model where the anomaly dis- – First, strong beliefs upon the re-usability of this ar-
appear once the main change in track is over. This chitecture will be audited in the ATC domain using
can be explained by the switch to the DESCENT de- other discriminating features like the type of aircraft
coder which is less sensitive to changes in track due or the kind of sensors used to gather the ADS-B
to the flight activity when approaching the arrival data. Other data could also complement the currentYou can also read