Debonding and fracture of ceramic islands on polymer substrates
←
→
Page content transcription
If your browser does not render page correctly, please read the page content below
Debonding and fracture of ceramic islands on polymer substrates
Jeong-Yun Sun, Nanshu Lu, Juil Yoon, Kyu-Hwan Oh, Zhigang Suo et al.

Citation: J. Appl. Phys. 111, 013517 (2012); doi: 10.1063/1.3673805
View online: http://dx.doi.org/10.1063/1.3673805
View Table of Contents: http://jap.aip.org/resource/1/JAPIAU/v111/i1
Published by the American Institute of Physics.

Related Articles
The tensile strengths of heterogeneous interfaces: A comparison of static and dynamic first-principles
calculations
J. Chem. Phys. 135, 244706 (2011)
Temperature-induced anomalous brittle-to-ductile transition of bulk metallic glasses
Appl. Phys. Lett. 99, 241907 (2011)
Size effects on the fatigue behavior of bulk metallic glasses
J. Appl. Phys. 110, 113507 (2011)
Mechanical response of nanometer thick self-assembled monolayers on metallic substrates using classical
nanoindentation
J. Appl. Phys. 110, 114301 (2011)
How does spallation microdamage nucleate in bulk amorphous alloys under shock loading?
J. Appl. Phys. 110, 103519 (2011)

Additional information on J. Appl. Phys.
Journal Homepage: http://jap.aip.org/
Journal Information: http://jap.aip.org/about/about_the_journal
Top downloads: http://jap.aip.org/features/most_downloaded
Information for Authors: http://jap.aip.org/authors

             Downloaded 10 Jan 2012 to 146.6.102.180. Redistribution subject to AIP license or copyright; see http://jap.aip.org/about/rights_and_permissions
JOURNAL OF APPLIED PHYSICS 111, 013517 (2012)

Debonding and fracture of ceramic islands on polymer substrates
          Jeong-Yun Sun,1,2 Nanshu Lu,2 Juil Yoon,3 Kyu-Hwan Oh,1 Zhigang Suo,2 and
          Joost J. Vlassak2,a)
          1
           Department of Material Science and Engineering, Seoul National University, Seoul 151-742, South Korea
          2
           School of Engineering and Applied Sciences, Harvard University, Cambridge, Massachusetts 02138, USA
          3
           Department of Mechanical Systems Engineering, Hansung University, Seoul 136-792, South Korea
          (Received 29 September 2011; accepted 6 December 2011; published online 10 January 2012)
          We perform in-situ uniaxial tensile tests on polyimide substrates with patterned ceramic islands.
          The islands fail by either channel cracking or debonding from the substrate, depending on island
          size and thickness. To understand why different failure modes occur, we have analyzed the fracture
          and debonding of stiff islands on deformable substrates. Using finite element simulations, we find
          that the maximum tensile strain in the islands increases with island size, but decreases with island
          thickness. The maximum energy release rate for island=substrate debonding, in contrast, increases
          with both island size and thickness. Assuming that the islands do not fracture if the maximum
          tensile strain in the islands is lower than a critical value and that no debonding occurs if the
          maximum energy release rate is smaller than the interfacial toughness, the critical substrate strains
          for island fracture and debonding can be calculated. If the islands are thick and small, the critical
          debonding strain is small, and the islands fail by debonding. If the islands are large and thin, the
          critical fracture strain is small, and the islands fail by channel cracking. When the two critical
          strains are similar, debonding and cracking are expected to co-exist. Experimental observations
          confirm these findings. VC 2012 American Institute of Physics. [doi:10.1063/1.3673805]

I. INTRODUCTION                                                                              multiple times the film thickness.17 Moreover, the steady-
                                                                                             state energy release rate increases significantly as the film-
     Flexible electronic devices are key components of a
                                                                                             to-substrate stiffness ratio becomes large.14 Since the sizes
number of important technologies.1–6 These devices often
                                                                                             of preexisting flaws in a film are often on the order of the
integrate a deformable polymer substrate to support inor-
                                                                                             film thickness, the steady-state energy release rate can be
ganic functional materials, including semiconductors, met-
                                                                                             used as the driving force for the initiation of channel cracks
als, and ceramics. Although the polymer substrate can
                                                                                             in films on stiff substrates, but not on compliant substrates.
undergo large deformation, the inorganic materials usually
                                                                                                   For film=substrate interface debonding, Hutchinson and
fracture at strains below 1%.7 One approach to reduce the
                                                                                             Suo15 provided an analytical formula for the steady-state
strain in the inorganic components is to fabricate them into
                                                                                             energy release rate as a function of the film-to-substrate stiff-
isolated islands on top of the polymer substrate.7–11 Stretch-
                                                                                             ness and thickness ratios. He et al.16 derived an analytical so-
ability as large as 25% has been demonstrated using particle
                                                                                             lution for the so-called convergent debonding case, where
desorption mass spectrometry (PDMS)-supported SiNx
                                                                                             the length of the bonded interface is much smaller than the
islands.7,11 Several failure modes are observed for these
                                                                                             film thickness. Yu et al.18 first investigated the effect of an
polymer-bonded ceramic islands. For example, SiNx islands
on polyimide (PI) substrates have been reported to either                                    interior edge on the delamination behavior of a patterned
crack12 or debond10 when subjected to uniaxial tension.                                      film. Lu et al.19 modeled periodic stiff islands on a compliant
Therefore, a reliability analysis of an array of islands sup-                                substrate and showed that the energy release rate peaks at a
ported by a polymer substrate must involve a consideration                                   debonding length much smaller than the film thickness and
of both failure modes. Given proper failure criteria, there                                  that it drops off immediately thereafter because of the large
exists a critical failure strain for each failure mode and the                               elastic mismatch and the finite size of the islands. The peak
smaller of these strains represents the critical strain for the                              energy release rate can thus be used as a conservative crite-
structure. If the strain applied to the substrate exceeds this                               rion for island=substrate debonding.
limit, the failure mode with the smaller critical failure strain                                   The goal of this paper is to combine the analysis of
occurs.                                                                                      cracking and debonding of stiff islands patterned on soft sub-
     Cracking and debonding of substrate-bonded thin films                                   strates to provide an explanation for the different failure
have been studied systematically. Channel cracks in thin                                     modes observed experimentally. For a given island configu-
films bonded to a rigid substrate approach a steady state at                                 ration, one can predict the critical substrate strain below
crack lengths on the order of the film thickness.13 However,                                 which the islands are safe from either cracking or debonding.
when the substrate is much more compliant than the film, a                                   Equivalently, if the substrate strain is prescribed, the critical
steady state cannot be reached until the crack length exceeds                                island geometry can be determined.
                                                                                                   The plan of this paper is as follows. In Sec. II, we eluci-
a)
 Electronic mail: vlassak@seas.harvard.edu.                                                  date the experimental details of the fabrication of SiNx island

0021-8979/2012/111(1)/013517/7/$30.00                                           111, 013517-1                                           C 2012 American Institute of Physics
                                                                                                                                        V

                  Downloaded 10 Jan 2012 to 146.6.102.180. Redistribution subject to AIP license or copyright; see http://jap.aip.org/about/rights_and_permissions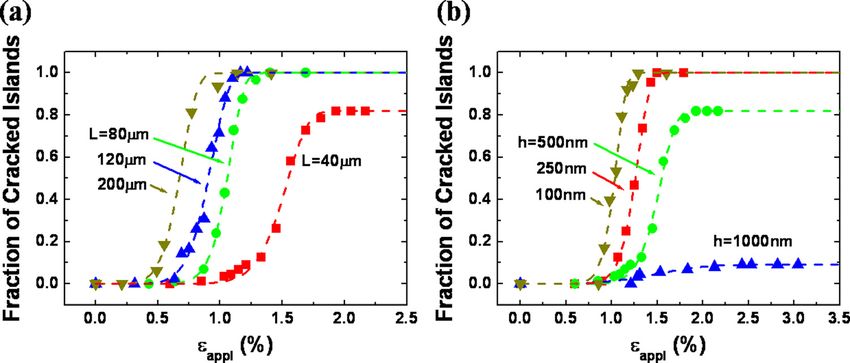
013517-2      Sun et al.                                                                                                                    J. Appl. Phys. 111, 013517 (2012)

                                                                                                                                        FIG. 1. (Color online) SiNx islands on
                                                                                                                                        PI substrate stretched horizontally.
                                                                                                                                        Island thickness h and island size L are
                                                                                                                                        shown at the upper left corner of each
                                                                                                                                        micrograph. The substrate elongation
                                                                                                                                        eappl is given at the lower left corner. For
                                                                                                                                        islands with h ¼ 0.3 lm (a)–(c), debond-
                                                                                                                                        ing and cracking coexist when L ¼ 20
                                                                                                                                        lm. When L > 20 lm, only channel
                                                                                                                                        cracking occurs. For islands with h ¼ 1
                                                                                                                                        lm (d)–(f), debonding and cracking
                                                                                                                                        coexist when L ¼ 40 lm. When L < 40
                                                                                                                                        lm, only debonding occurs; when
                                                                                                                                        L > 40 lm, only cracking takes place.

arrays on PI substrates and the in-situ uniaxial tensile tests.                              mW=cm2 (I-line) and 59.1 mW=cm2 (G-line) through a chro-
Experimental results are given in Sec. III, including the vari-                              mium reticule using an MJB4 mask aligner (SUSS Micro-
ous failure modes for different island configurations and the                                Tec). The samples were developed in a MF-319 photoresist
corresponding failure strains. In Sec. IV, we describe the fi-                               developer (Microposit), rinsed in DI water for 1 min, and
nite element simulations used to calculate the driving forces                                dried with N2 gas. The PI substrates were then cut into 7
for island cracking and debonding, and we compare the sim-                                   mm  60 mm rectangular strips while still attached to the Al
ulation results with our experimental observations. Conclud-                                 plates. Next, SiNx films were deposited by chemical vapor
ing remarks are given in Sec. V.                                                             deposition (CVD) in a NEXX system with a base pressure of
                                                                                             5  106 Torr. The depositions were performed at a working
II. EXPERIMENTAL                                                                             pressure of 10 mTorr with a flow of 40 sccm Ar—3% SiH4,
                                                                                             5.8 sccm N2, and 20 sccm Ar. The microwave power was
      Periodic SiNx islands were fabricated on 25 lm thick PI                                265 W, and the substrate temperature was kept at 22  C.
substrates (Upilex-S, UBE Industries) using the following                                    Finally, the SiNx coatings were patterned by stripping the
lift-off procedure: The PI substrates were ultrasonically                                    photoresist along with the extra SiNx in acetone. Square
cleaned using methanol and acetone and attached to a 3 mm                                    islands of width L ranging from 10 lm to 120 lm and thick-
thick aluminum (Al) plate using double-sided tape. The                                       ness h ranging from 100 nm to 1 lm were prepared. The
PI=Al assemblies were kept in a vacuum chamber for 24 h to                                   island spacing S normalized by the island width, S=L ¼ 1.5,
eliminate any air bubbles. A 3.2-lm-thick positive photore-                                  was held constant for all specimens.
sist (S1818, Microposit) was then spin-coated on top of the                                       After detaching the samples from the Al plate, they
PI substrates. The coated substrates were baked for 2 min at                                 were uniaxially stretched in a homemade screw-driven ten-
115  C and exposed for 3 s to light intensities of 28.9                                     sile device. A 5 mm  5 mm square lattice of islands was
                                                                                             placed half way between the two grips to achieve a uniform
                                                                                             tensile state. All tensile tests were performed in-situ under an
                                                                                             optical microscope with a CCD camera. Applied strains
                                                                                             were measured directly on the recorded micrographs.

                                                                                             III. EXPERIMENTAL RESULTS
                                                                                                  Figure 1 shows typical micrographs of the deformed
                                                                                             islands. All samples were stretched in the horizontal direc-
                                                                                             tion. Different failure modes can be identified for different
                                                                                             island configurations. Figures 1(a) to 1(c) show islands of
                                                                                             the same thickness, h ¼ 0.3 lm, but of different size: L ¼ 20
                                                                                             lm, 40 lm, and 80 lm, respectively. Large islands fail by
                                                                                             channel cracking, as shown in Figs. 1(b) and 1(c). Parallel
                                                                                             channel cracks run across the islands in the direction perpen-
FIG. 2. (Color online) Summary of the failure modes for different island
configurations. C—only cracking occurs. D—only debonding takes place.
                                                                                             dicular to the applied load. When the island size decreases to
M—debonding and cracking coexist (the numbers indicate the proportion of                     20 lm, however, some islands also debond as indicated by
cracked islands).                                                                            the brightened areas in Fig. 1(a). A similar situation is

                  Downloaded 10 Jan 2012 to 146.6.102.180. Redistribution subject to AIP license or copyright; see http://jap.aip.org/about/rights_and_permissions
013517-3 Sun et al. J. Appl. Phys. 111, 013517 (2012)
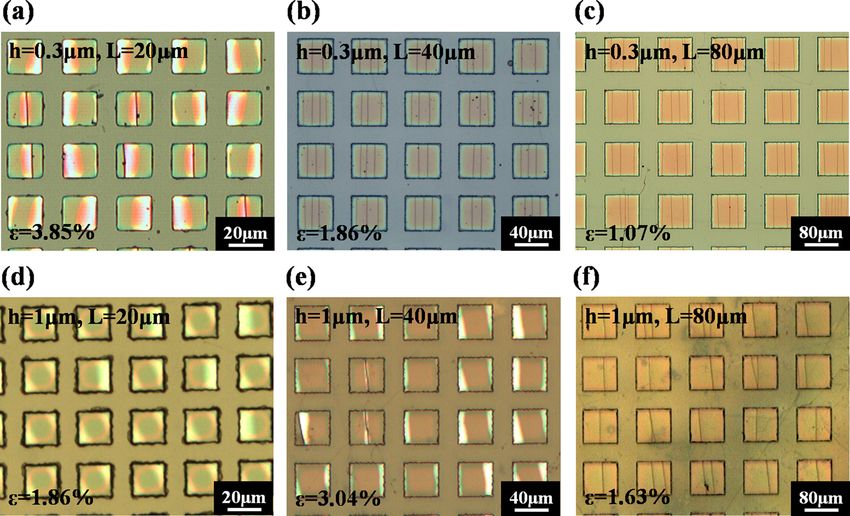
FIG. 3. (Color online) The accumulated
fraction of cracked islands is plotted as a
function of the applied strain. The exper-
imental observations are plotted as dots
and the Weibull distributions are plotted
as dashed lines. (a) Island size is varied
with fixed island thickness (h ¼ 500 nm).
(b) Island thickness is varied with fixed
island size (L ¼ 40 lm). If cracking and
debonding coexist, the curve cannot
reach unity because debonded islands do
not crack.
observed for 1-lm-thick islands (Figs. 1(d)–1(f)). Islands given island size, the failure mode changes from cracking to
with a size of 80 lm fail by channel cracking (Fig. 1(f)), debonding as the island thickness increases.
whereas 40-lm-large islands can either fracture or debond Island dimensions also affect the failure strain. Figure 3
(Fig. 1(e)). When islands become even smaller, i.e., L ¼ 20 plots the accumulated fraction of fractured islands as a func-
lm, only debonding is observed (Fig. 1(d)). When compar- tion of the strain applied to the substrate. From 50 to 88
ing micrographs in each column, it is evident that thicker islands are explored for each case, and the accumulated frac-
islands are more prone to debonding for a given island size. tion of fractured islands are fitted using Weibull distribution,
In Figs. 1(a) and 1(e), individual islands either fracture or j
debond from the edges of the islands, although in some cases FðxÞ ¼ A 1 eðx=kÞ ; (1)
fracture is followed by debonding from the fractured edge.
The reverse is never observed. All channel cracks run imme- where A, j, and k are fitting parameters. In the context of
diately across the entire island, i.e., fracture is an almost in- this paper, we define the fracture strain, ef, as the substrate
stantaneous process. By contrast, it is possible to observe strain at which 1% of the islands are fractured, i.e.,
partial interfacial cracks indicating that interfacial debonding F(ef)=A ¼ 0.01. For islands with a fixed thickness of 500 nm,
is a quasi-static process. As the applied strain increases and the fracture strain increases as the island size decreases, as
debonding progresses, the energy release rate is reduced and shown in Fig. 3(a). For islands with a fixed size of 40 lm,
eventually approaches zero. Consequently, fully debonded the fracture strain increases as the island thickness increases,
islands were not observed in our experiments. as shown in Fig. 3(b). Some of the curves do not reach
The failure modes for all island configurations are sum- 100%, indicating that not all islands fracture: Indeed some
marized in Fig. 2. The horizontal axis represents island size islands debond first. The strain in these islands is released
and the vertical axis the island thickness. We create a failure and channel cracks cannot form. Similar cumulative distribu-
mode map by designating the experimentally observed fail- tion functions are shown in Fig. 4 with an emphasis on
ure modes as follows: C indicates that all islands showed debonding. The accumulated fraction of debonded islands is
channel cracking for a given combination of island size and plotted as a function of the applied strain for different sizes
thickness; D is used when only island debonding is observed, (Fig. 4(a)) and different thicknesses (Fig. 4(b)), along with
while M denotes a mixed failure mode where some islands the Weibull fit. Similar to the fracture case, the debonding
debond and others fracture. It is clear from the figure that for strain, ed , is defined as the substrate strain at which 1% of the
a given island thickness, the failure mode changes from islands are debonded. When the island thickness is fixed at
debonding to channel cracking as island size increases. For a 250 nm, the debonding strain increases with decreasing
FIG. 4. (Color online) The accumulated
fraction of debonded islands is plotted as
a function of the applied strain. The ex-
perimental observations are plotted as
dots and the Weibull distributions are
plotted as dashed lines. (a) h ¼ 250 nm is
fixed, island size is varied. (b) L ¼ 20
lm is fixed, island thickness is varied. If
cracking and debonding coexist, the
curve cannot reach unity because
cracked islands do not debond from the
edge of the island.
Downloaded 10 Jan 2012 to 146.6.102.180. Redistribution subject to AIP license or copyright; see http://jap.aip.org/about/rights_and_permissions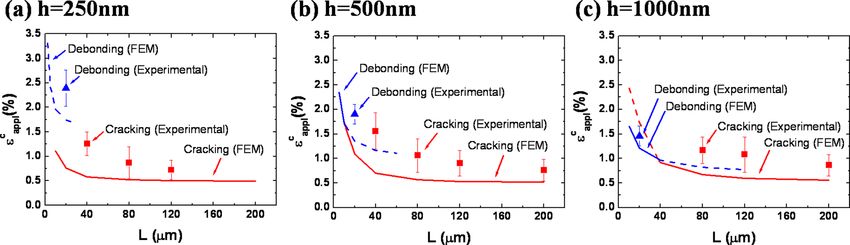
013517-4     Sun et al.                                                                                                                   J. Appl. Phys. 111, 013517 (2012)

                                                                                                                                      FIG. 5. (Color online) Schematics of the
                                                                                                                                      3D finite element model of a unit cell:
                                                                                                                                      (a) top view and (b) side view. S=L ¼ 1.5
                                                                                                                                      is fixed in all the experiments and simu-
                                                                                                                                      lations. Due to the symmetry, only the
                                                                                                                                      shaded quarter in (a) is modeled. The
                                                                                                                                      maximum tensile strain is found at the
                                                                                                                                      root of the center of the edge, as marked
                                                                                                                                      by emax .

island size, as shown in Fig. 4(a). For a given island size of                             eappl , the strain in the island and the segment of the substrate
20 lm, the debonding strain increases with decreasing island                               covered by the island is e1 , while the strain in the segments
thickness. We will analyze these trends using mechanics in                                 of bare substrate is e2 . Considering that each segment of the
Sec. IV A.                                                                                 structure carries the same force, it follows that

IV. SIMULATION AND ANALYSIS                                                                                           Ef he1 þ Es He1 ¼ Es He2 :                           (2)

A. Fracture analysis                                                                            The total elongation of the structure under eappl consists
     Using the commercial finite element code ABAQUS                                       of two parts
6.7-1, we established a three-dimensional model of a unit
cell of the periodic island lattice. Schematics of the top and                                                        eappl S ¼ e1 L þ e2 ðS  LÞ:                         (3)
side views of the model are shown in Fig. 5. Because of the                                A combination of Eqs. (2) and (3) gives the strain in the
four-fold symmetry, only one quarter of the unit cell was                                  island, e1
modeled, as represented by the shaded area in Fig. 5(a). We
modeled the islands and the substrate as homogeneous, iso-                                                              e1         1
tropic linear elastic materials with Young’s moduli                                                                         ¼             :                              (4)
                                                                                                                       eappl 1 þ 1  L Ef h
                                                                                                                                     S Es H
ESiN ¼ 200 GPa and EPI ¼ 9.2 GPa, and with Poisson’s ratios
 ¼ 0.3 for both SiNx and PI. The lattice periodicity was                                  This one-dimensional model is in good qualitative agreement
fixed at S=L ¼ 1.5 for all simulations. A uniform displace-                                with the trends observed in Figs. 3(a) and 3(b).
ment uappl was applied to the substrate in the x1-direction,                                    To provide a more quantitative relationship between the
corresponding to a strain of eappl ¼ 2uappl =S. We used 3D                                 experimental fracture strain and the calculated maximum
brick elements to mesh both the island and the substrate. Ten                              strain, we adopt a simple failure criterion. The criterion is
elements were assigned across the island thickness. A refined                              based on the assumption that an islands fractures when the
mesh was used to confirm that there was no mesh depend-                                    maximum strain in the islands reaches a critical value,
ence of the strain field across the island thickness.                                      emax ¼ ec , or equivalently that the size distribution of pre-
     The maximum tensile strain in the island, emax , occurs at                            existing flaws in the islands is independent of island size or
the root of the center of the island edge, as labeled in Fig.                              thickness. The experiments and calculations are then related
5(a). Figure 6(a) plots the maximum strain normalized by the                               through
applied substrate strain as a function of island size for vari-
ous island thicknesses. It demonstrates that smaller islands                                                   ec emax         L H
experience smaller strains for a given island thickness. For a                                                   ¼       ¼m ;         ;               (5)
                                                                                                               ef eappl         h h
given island size, thicker islands experience somewhat
smaller strains. A simple one-dimensional model to estimate                                where m is a strain concentration factor that depends on geom-
the strain in the islands is considered. Under an applied strain                           etry and H denotes the substrate thickness. Equation (5) can

                                                                                                                                      FIG. 6. (Color online) (a) FEM results of
                                                                                                                                      normalized maximum strains in the island
                                                                                                                                      and (b) critical strain-to-rupture calcu-
                                                                                                                                      lated by Eq. (4), as functions of island
                                                                                                                                      size with various island thicknesses.

                Downloaded 10 Jan 2012 to 146.6.102.180. Redistribution subject to AIP license or copyright; see http://jap.aip.org/about/rights_and_permissions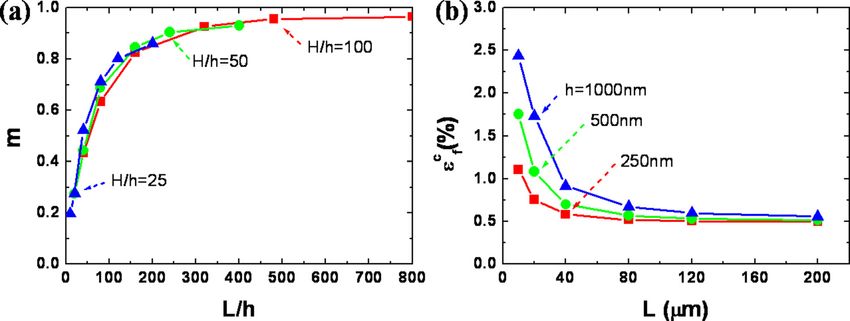
013517-5 Sun et al. J. Appl. Phys. 111, 013517 (2012)
TABLE I. Critical local rupture strain, ec, calculated from Eq. (4) using the TABLE II. Interfacial toughness Ci, calculated from Eq. (7) using the meas-
measured strain-to-fracture, ef, and Fig. 6(a) for various island ured strain-to-debond, ed, and Fig. 7(a) for various island configurations.
configurations.
h (nm) L (lm) Ci (J=m2)
h (nm) L (lm) ec (%)
250 10 11.3
100 20 0.57 250 20 9.4
100 40 0.80 500 20 9.6
250 40 0.65 1000 20 7.3
250 80 0.50 1000 40 6.0
250 120 0.49
500 40 0.78
500 80 0.62
500 120 0.48
1000 80 0.58 Ef e2appl h a L H
G¼ f ; ; ; (6)
1000 120 0.55 2 h h h
where a represents crack length, Ef ¼ E=ð1 Vf2 Þ, and f rep-
resents a dimensionless function that can be determined from
be used to determine ec from the experimental fracture strain,
finite element simulations. The calculated energy release rate
ef, and the simulation results for m shown in Fig. 6(a). Table I
for a given island configuration reaches a maximum at a very
lists the critical strain ec calculated from Eq. (5) using the
small value of a=h and decreases almost linearly immedi-
measured fracture strain. Evidently, there is some variation in
ately thereafter (not shown). Consequently, interfacial cracks
the values of ec due to the statistical nature of preexisting
arrest when the energy release rate drops below the interfa-
flaws. If we take the critical island strain equal to the smallest
cial toughness resulting in partially debonded islands as
experimental value, ec ¼ 0:48%, we obtain a conservative
shown in Figs. 1(a), 1(d), and 1(e). Unlike channel cracks,
failure criterion for the SiNx islands in this study. With this
which propagate quickly across an island, debonding cracks
value for ec , Eq. (5) can be used to predict the critical substrate
grow in a stable fashion with increasing substrate deforma-
strain ecf for any island. Figure 6(b) plots ecf as a function of
tion. The maximum energy release rate Gmax can be written
island size and island thickness using the values of m provided
as a function of L=h and H=h,
in Fig. 6(a). More than 99% of the islands of given size and
thickness will be safe from fracture as long as the strain
Ef e2appl h L H
applied to the substrate is smaller than ecf . Gmax ¼ g ; ; (7)
2 h h
B. Debonding analysis where g is a dimensionless function plotted in Fig. 7(a) for
We now develop a criterion for island debonding. various values of L=h and H=h. It is evident from the figure
Debonding of a periodic array of stiff islands on polymer that, if the film is much thinner than the substrate, g is a func-
substrates has been analyzed by Lu et al.19 They performed tion of L=h only. In that case, g increases with increasing
plane-strain finite element simulations of islands with inter- island size and decreasing island thickness.
facial cracks emanating from both edges of the islands. The Taking Gmax ¼ Ci as the criterion for island debonding,
energy release rate was found to peak at a crack length on where Ci denotes the interfacial toughness, we find from
the order of 0.1h and to drop rapidly as the cracks propagate. Eq. (7)
Evidently, if the maximum energy release rate is smaller sffiffiffiffiffiffiffiffiffiffi
than the interfacial toughness island=substrate debonding 2Ci
ecd ¼ ; (8)
cannot occur. We adopt this approach to analyze the debond- Ef hg
ing observed in our experiments. Dimensional considerations
dictate that the energy release rate should take the following where ecd is the substrate strain at which debonding occurs.
form: Similar to Sec. IV A, we use the experimental values of ecd to
FIG. 7. (Color online) (a) FEM results
of the normalized maximum energy
release rate and (b) critical applied
strain-to-debond calculated by Eq. (7),
as a function of island size for various
island thicknesses.
Downloaded 10 Jan 2012 to 146.6.102.180. Redistribution subject to AIP license or copyright; see http://jap.aip.org/about/rights_and_permissions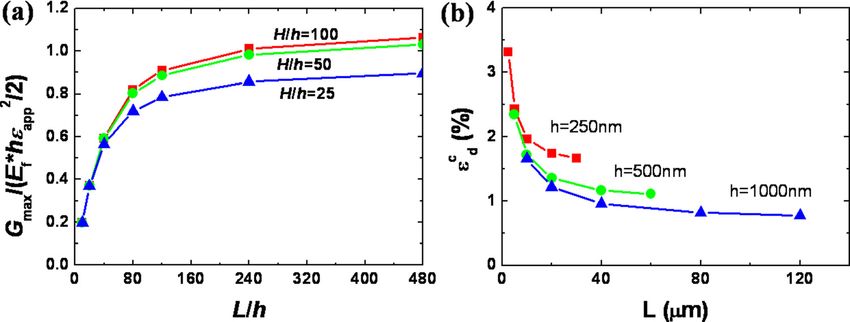
013517-6        Sun et al.                                                                                                                   J. Appl. Phys. 111, 013517 (2012)

FIG. 8. (Color online) Combining Figs. 6(b) and 7(b), the critical applied strains to debond or to rupture are plotted as functions of island size for various
island thicknesses: (a) h ¼ 250 nm, (b) h ¼ 500 nm, and (c) h ¼ 1000 nm. The measured strain-to-rupture and strain-to-debond are plotted as square and triangu-
lar symbols, respectively, to compare with the theoretical prediction. For a given island configuration, the failure mode with the lower critical applied strain is
predicted to occur.

calculate Ci and then take this Ci as an interfacial property to                              debonding of islands is observed within the same array of
predict the critical debonding for different island geometries.                               islands, as shown in Figs. 1(a) and 1(e). When the islands are
Table II lists the Ci obtained using different island configura-                              larger still, the critical fracture strain drops below the critical
tions. There is some variation in the values of Ci due to the                                 debonding strain and all islands fail by channel cracking, as
statistical nature of preexisting flaws. Using the smallest                                   observed in Figs. 1(b), 1(c), and 1(f).
interfacial toughness value Ci ¼ 6:0J=m2 in Eq. (8), we                                            The experimental fracture and debonding strains are
obtain a conservative criterion for delamination of the                                       plotted as dots in Fig. 8. Since we used conservative failure
islands. The results are depicted in Fig. 7(b). As expected,                                  criteria to predict the critical strains, the calculated critical
the critical debonding strain decreases with increasing island                                strains can be regarded as lower bounds to the experimental
size or thickness. An applied strain smaller than the critical                                failure strains as defined in this paper. The integrity of the
value will cause fewer than 1% of the islands to debond.                                      islands can be guaranteed if the applied substrate strain is
Alternately, if a maximum substrate deformation is specified,                                 kept below the critical strains. In summary, Fig. 8 can be
we can use the criterion to predict the island size or thick-                                 used in prediction of failure or design of islands, depending
ness, below which no debonding will occur.                                                    on the need. For a given island structure, the critical fracture
                                                                                              and debonding strains are given by Fig. 8. To keep the
                                                                                              islands intact, the applied strain cannot exceed either of the
C. Determination of the critical loading and the failure                                      critical failure strains.
mode
     By combining the results from Secs. IV A and IV B, it is                                 V. CONCLUSIONS
now possible to predict which failure mechanism will occur
                                                                                                   When subject to uniaxial stretching, ceramic islands on
for a given island geometry. Figure 8 shows the combined
                                                                                              polyimide substrates exhibit different failure modes: smaller
results from Figs. 6(b) and 7(b), i.e., the critical substrate
                                                                                              and thicker islands tend to fail by debonding, whereas larger
strains for debonding and fracture. If the applied strain is
                                                                                              and thinner islands are more prone to channel cracking. For
lower than either strain for a given island configuration, nei-
                                                                                              intermediate island geometries, both channel cracking and
ther island debonding nor fracture will occur. If the substrate
                                                                                              debonding are observed. By assuming simple fracture and
strain is increased, the islands will eventually crack or
                                                                                              debonding criteria and by combining these with finite ele-
delaminate depending on which critical strain is smaller.
                                                                                              ment simulations to calculate the driving forces for island
Taking islands with h ¼ 500 nm and L ¼ 40 lm for example,
                                                                                              fracture and debonding, we have obtained the critical sub-
Fig. 8(b) provides a critical fracture strain of 1.05% and a
                                                                                              strate strains for channel cracking and debonding. These crit-
critical debonding strain of 1.40%. Evidently these islands
                                                                                              ical strains are in good agreement with our experimental
will fail by channel cracking instead of delamination.
                                                                                              observations.
     The effects of island geometry on failure mode can be
understood by examining the three pairs of curves shown in
                                                                                              ACKNOWLEDGMENTS
Fig. 8, which share very similar features. When islands are
small, the critical debonding strain is lower than the critical                                    This work is supported by the National Science Founda-
fracture strain. Therefore, at small island size, debonding is                                tion (NSF) under Grant CMS-0556169, and by the Materials
the predicted failure mechanism and it is the only failure                                    Research Science and Engineering Center (MRSEC) at
mode observed, as confirmed by Fig. 1(d). When islands are                                    Harvard University. It was performed in part at the Center for
of some intermediate size, the values of the two critical                                     Nanoscale Systems (CNS), a member of the National
strains are similar. In this case, both channel cracking and                                  Nanotechnology Infrastructure Network (NNIN), which is

                   Downloaded 10 Jan 2012 to 146.6.102.180. Redistribution subject to AIP license or copyright; see http://jap.aip.org/about/rights_and_permissions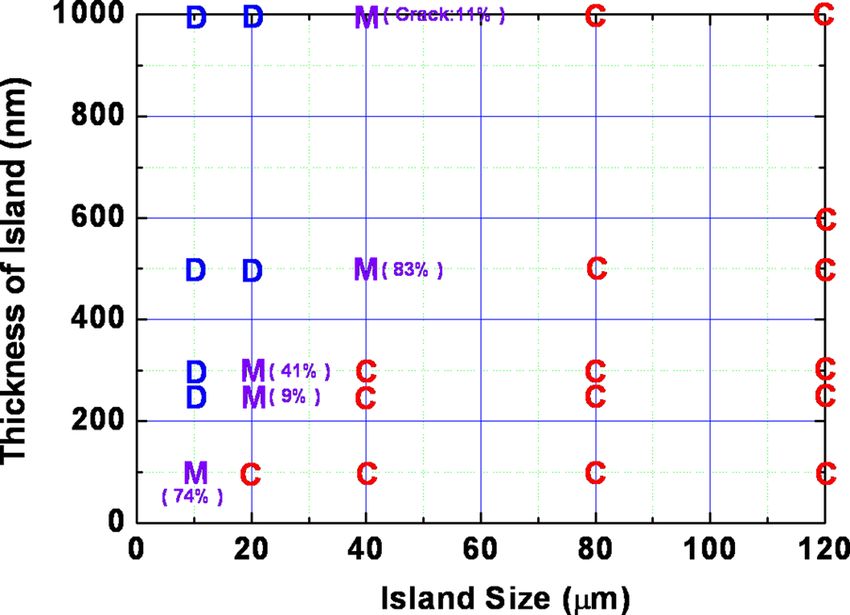
013517-7      Sun et al.                                                                                                                    J. Appl. Phys. 111, 013517 (2012)

                                                                                              6
supported by the National Science Foundation under NSF                                          H. C. Ko, M. P. Stoykovich, J. Song, V. Malyarchuk, W. M. Choi, C.-J.
Award No. ECS-0335765. CNS is part of the Faculty of Arts                                       Yu, J. B. Geddes III, J. Xiao, S. Wang, Y. Huang, and J. A. Rogers, Nature
                                                                                                454, 748 (2008).
and Sciences at Harvard University. KHO is grateful for the                                   7
                                                                                                S. P. Lacour, S. Wagner, R. J. Narayan, T. Li, and Z. Suo, J. Appl. Phys.
support from the Information Technology Research Center                                         100, 014913 (2006).
                                                                                              8
(ITRC) granted by the Korea government (2011-0001460). JY                                       P. I. Hsu, M. Huang, Z. Xi, S. Wagner, Z. Suo, and J. C. Stum, J. Appl.
                                                                                                Phys. 95, 705 (2004).
is grateful for support from the National Research Foundation                                 9
                                                                                                S. Wagner, S. P. Lacour, J. Jones, P. I. Hsu, J. C. Sturm, T. Li, and Z. Suo,
of Korea (KRF-2011-0003476).                                                                    Physica E 25, 326 (2005).
                                                                                             10
                                                                                                R. Bhattacharya, A. Salomon, and S. Wagner, J. Electrochem. Society
1
  J. A. Rogers, Z. Bao, K. Baldwin, A. Dodabalapur, B. Crone, V. R. Raju,                       153, G259 (2006).
                                                                                             11
  V. Kuck, H. Katz, K. Amundson, J. Ewing, and P. Drzaic, Proc. Natl.                           J.-Y. Sun, N. Lu, J. Yoon, K.-H. Oh, Z. Suo, and J. J. Vlassack, J. Mater.
  Acad. Sci. U.S.A. 98, 4835 (2001).                                                            Res. 24, 3338 (2009).
2                                                                                            12
  E. Bonderover and S. Wagner, IEEE Electron Device Lett. 25, 295                               H. Gleskova, S. Wagner, and Z. Suo, Appl. Phys. Lett. 75, 3011 (1999).
                                                                                             13
  (2004).                                                                                       T. Nakamura and S. Kamath, Mech. Mater. 13, 67 (1992).
3                                                                                            14
  C. J. Brabec, Sol. Energy Mater. Sol. Cells 83, 273 (2004).                                   J. L. Beuth, Int. J. Solids Struct. 29, 1657 (1992).
4                                                                                            15
  E. Abad, S. Zampolli, S. Marco, A. Scorzoni, B. Mazzolai, A. Juarros, D.                      J. W. Hutchinson and Z. Suo, Adv. Appl. Mech. 29, 63 (1992).
                                                                                             16
  Gómez, I. Elmi, G. C. Cardinali, J. M. Gómez, F. Palacio, M. Cicioni, A.                    M. Y. He, A. G. Evans, and J. W. Hutchinson, Acta Mater. 45, 3481 (1997).
                                                                                             17
  Mondini, T. Becker, and I. Sayhan, Sens. Actuator B 127, 2 (2007).                            R. Huang, J. H. Prevost, Z. Y. Huang, and Z. Suo, Eng. Fract. Mech. 70,
5
  T. Someya, Y. Kato, T. Sekitani, S. Iba, Y. Noguchi, Y. Murase, H.                            2513 (2003).
                                                                                             18
  Kawaguchi, and T. Sakurai, Proc. Natl. Acad. Sci. U.S.A. 102, 12321                           H. H. Yu, M. Y. He, and J. W. Hutchinson, Acta Mater. 49, 93 (2001).
                                                                                             19
  (2005).                                                                                       N. Lu, J. Yoon, and Z. Suo, Int. J. Mater. Res. 98, 717 (2007).

                  Downloaded 10 Jan 2012 to 146.6.102.180. Redistribution subject to AIP license or copyright; see http://jap.aip.org/about/rights_and_permissions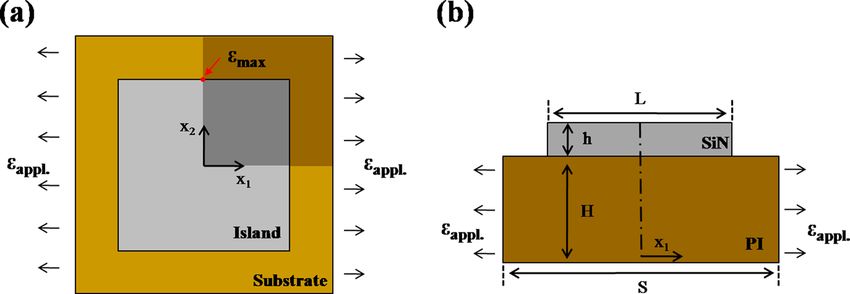
You can also read