Deep Learning-Based Computed Tomography Images for Quantitative Measurement of the Correlation between Epicardial Adipose Tissue Volume and ...
←
→
Page content transcription
If your browser does not render page correctly, please read the page content below
Hindawi
Scientific Programming
Volume 2021, Article ID 9866114, 9 pages
https://doi.org/10.1155/2021/9866114

Research Article
Deep Learning-Based Computed Tomography Images for
Quantitative Measurement of the Correlation between Epicardial
Adipose Tissue Volume and Coronary Heart Disease

 Han Wang ,1 Hui Wang ,2 Zhonglve Huang ,2 Huajun Su ,2 Xiang Gao ,2
 and Feifei Huang 2
 1
 Department of Cardiology, General Hospital of the Yangtze River Shipping, Wuhan, Hubei 430000, China
 2
 Department of Cardiology, Caidian District People’s Hospital, Union Jiangbei Hospital,
 Huazhong University of Science and Technology, Wuhan, Hubei 430100, China

 Correspondence should be addressed to Feifei Huang; 2006010119@st.btbu.edu.cn

 Received 12 May 2021; Revised 8 June 2021; Accepted 1 July 2021; Published 14 July 2021

 Academic Editor: Gustavo Ramirez

 Copyright © 2021 Han Wang et al. This is an open access article distributed under the Creative Commons Attribution License,
 which permits unrestricted use, distribution, and reproduction in any medium, provided the original work is properly cited.
 The epicardial adipose tissue volume (EATV) was quantitatively measured by deep learning-based computed tomography (CT) images,
 and its correlation with coronary heart disease (CHD) was investigated in this study. 150 patients who underwent coronary artery CT
 examination in hospital were taken as research objects. Besides, patients from the observation group (group A) suffered from vascular
 stenosis, while patients from the control group (group B) had no vascular stenosis. The deep convolutional neural network model was
 applied to construct deep learning algorithm, and deep learning-based CT images were adopted to quantitatively measure EATV. The
 results showed that the sensitivity, specificity, accuracy, and area under the curve (AUC) of the deep learning algorithm were 0.8512,
 0.9899, 0.9623, and 0.9813, respectively. By comparison, the correlation results of the traditional George algorithm, Aslani algorithm, and
 Lahiri algorithm were all lower than those of the deep learning algorithm, and the difference was statistically substantial (P < 0.05). The
 epicardial adipose tissue volume of the observation group (114.23 ± 55.46) was higher markedly than the volume of the control group
 (92.65 ± 43.28), with a statistically huge difference (P < 0.05). The r values of EATV with plaque properties and the number of stenosed
 coronary vessels were 0.232 and 0.268 in turn, both showing significant positive correlation. In conclusion, the sensitivity and other index
 values of deep learning algorithm were improved greatly compared with traditional algorithm. CT images based on deep learning
 algorithm achieved good blood vessel segmentation effects. In addition, EATV was closely related to the development of CHD.

1. Introduction Existing studies have believed that the application of
 coronary artery percutaneous catheter digital subtraction
CHD is a heart disease in which coronary atherosclerosis radiography (DSA) for CHD has the best diagnostic effect,
causes stenosis or complete blockage of the lumen and the but DSA detection has many shortcomings, which not only
spasm of the coronary arteries, which in turn leads to causes wounds but also brings expensive testing costs. There
myocardial ischemic necrosis. With the changes in people’s are a lot of burdens, and these shortcomings greatly limit its
diet and lifestyle, the incidence of CHD has risen sharply in wide application [2]. Multislice spiral CT coronary angi-
recent years, which has seriously threatened people’s health ography is a new technology applied in DSA detection,
[1]. Therefore, the early prevention and treatment of CHD is which is noninvasive, simple to operate, high in image
a critical part of people’s health management. This requires resolution, and effective in diagnosis. However, it is not
accurate and effective detection methods to cut off the health suitable for clinical application due to the need to inject a
damage caused by CHD from the source based on the larger dose of contrast agent during testing, which will
principle of “early detection and early treatment.” adversely affect human kidney health.
2 Scientific Programming

 A new bio-friendly and efficient detection method has 2.1.1. Preprocessing of Image Data. The coronary angiog-
become the common expectation of doctors and patients. raphy images in this study were provided by hospital, with a
Medical imaging based on deep learning algorithm has been a total of 20. The original image was first processed by data
hot topic of research by scholars in recent years. Many research amplification and then cropped according to medical image
results have been successfully applied to the differential di- standards. After cropping, 18,720 images were obtained, of
agnosis of clinical diseases, greatly enhancing the accuracy of which 8,720 were used as the test set and 10,000 were used as
doctors’ diagnosis and treatment. In domestic studies, some the training set. Regarding the cropped image data, the ReLU
scholars have applied deep learning algorithm in the seg- function was applied to perform a unified normalization
mentation of nerve cell images [3]. Some scholars have adopted operation, so that it could be more easily recognized by the
deep learning algorithm in the differentiation of benign and system. The normalization equation was as follows:
malignant breast tumors [4]. In addition, some scholars have x− μ
applied deep learning algorithm in pattern classification to xnormalization � √� . (1)
 max δ, 1.0/ x
achieve rapid classification of medical images [5]. In foreign
studies, some scholars have applied deep convolutional neural In equation (1), μ stood for the average of all pixels, σ
network in the vascular segmentation of retina and achieved a represented the standard deviation of the three-channel
good effect of vascular segmentation. Some scholars have pixels, and the x-value was the total number of three-channel
applied three-dimensional convolutional neural network in the pixels.
segmentation of brain pathological tissue, achieving a break-
through in the study of brain tissue [6].
 In order to obtain a good detection effect, an effective 2.1.2. Network Structure. In addition to the input layer,
evaluation index is also needed. Studies have found that channel 1 had a five-layer structure, of which the con-
among the many pathogenic factors of cardiovascular dis- volutional layer was the first to the fourth layer, and the
ease, the volume of regional adipose tissue represented by batch specification layer was the fifth layer. In the first,
the increase of visceral fat volume will increase, which is a second, third, and fourth layers, the convolution kernel size
significant risk factor. Yerramasu et al. [7] showed that the was 5 ∗ 5 ∗ 32, 5 ∗ 5 ∗ 64, 3 ∗ 3, and 3 ∗ 3 in turn.
measurement of EATV by CT could be used as an index of
the presence and severity of atherosclerosis in coronary 2.1.3. Parameter Optimization. In the training process of the
arteries. EAT refers to the visceral fat deposited near the network structure, the adaptive momentum optimization
epicardium of the heart to the fibrous pericardium. It can method was employed to achieve parameter optimization,
secrete a variety of inflammatory factors and adipohormones which reduced the training time to the greatest extent and
and occupy 80% of the surface area of the heart. Besides, it is was more efficient than the stochastic gradient descent
mainly distributed in the right ventricle, atrioventricular method. In addition, the Dropout technology was adopted to
groove, and interventricular groove, and the rest are dis- output unidentified neurons with a zero value to enhance
tributed around the free wall of the atrium and around the robustness and reduce overfitting.
auricle. Regarding the formation mechanism of athero-
sclerosis, existing studies have speculated that the coronary
arteries are connected to EATV by the adipocyte-vascular 2.1.4. Loss Function. The objective function of the network
regulator. Therefore, it is more credible to use EATV as the was optimized by the cross-entropy loss function, and the
evaluation index of CHD. function was defined as follows:
 The correlation between EATV and CHD was explored
in this study through CT images based on deep learning, so CE � − p(x)log(q(x)). (2)
 X
that to provide a more effective clinical detection method for
the CHD diagnosis and treatment. In equation (2), p(x) and q(x) stood for the true dis-
 tribution of the sample, and the estimated probability ob-
2. Materials and Methods tained through training, respectively. When the cross-
 entropy loss function was used for a binary classification
2.1. Vessel Segmentation Method Based on Deep Learning. task, its form was expressed as follows:
Figure 1 shows the research direction of deep learning, while
Figure 2 indicates the flowchart of convolutional neural CE � − p(x)log(q(x)) − (1 − p(x)log). (3)
network segmentation of blood vessels. The deep convolu- In equation (3), p(x) ∈ {±1} specified the true class label
tional neural network model was employed to segment the of the sample and q(x) ∈ [0, 1] was the estimated probability
cropped coronary vascular image blocks. One part clipped of the model for the class with label p(x) � 1.
the original image, and the other part sampled the image
before clipping and segmentation, so as to ensure that the
local features have the global features for reference and 2.1.5. Model Training. Thirty images were selected randomly,
obtain the precise segmentation of pixel points. The small the effective circular area diameter of each image was 540
blocks obtained by segmentation might be blood vessel pixels, and the mask image was cut out and extracted based on
images, and all small blocks were stitched together to get a the original image. Then, the DRIVE data set was adopted to
complete coronary blood vessel segmentation image. train and test the model, which was used for retinal image
Scientific Programming 3 Supervised learning Artificial Machine Neural Deep intelligence learning network learning Unsupervised learning Figure 1: Research direction of deep learning. Clipping Preprocessing Mosaic Network Start coronary of image complete End layering artery image data image Figure 2: Flowchart of convolutional neural network segmentation of blood vessels. segmentation, half of which was training set and the other half Second, it was subdivided into a single-vessel disease group, was test set. The training parameters were set as follows. a double-vessel disease group, and a multivessel disease Learning rate was 0.001, batch size was 16, iteration number group according to the number of stenosed coronary vessel. was 10,000, and optimizer was Adam, Dropout 0.5. What is more, the number of stenosed coronary vessels was defined by CT coronary angiography results. 2.2. Research Objects. From 2017 to 2019, 150 patients who underwent CT coronary angiography examinations in 2.4. CT Scanning Method hospital were selected as the research objects. The hospital 2.4.1. Preparation before Testing. All the tested patients ethics committee had reviewed and authorized this study, should fast 4 hours before the test, and their basic infor- and the research objects had understood this experiment and mation was measured and recorded such as the patients’ signed the informed consent forms. weight before the test started. Besides, the patients were The criteria for inclusion were defined to include patients asked not to carry extra items that might cause image ar- who agreed to participate in this experiment, had the tifacts. They were informed in detail of all the examination negative iodine allergy test results with no arrhythmia procedures and possible reactions to relieve their unnec- symptoms, had the scanned image quality that could be used essary mental stress. In addition, it was necessary to perform to judge whether there was coronary artery stenosis, had no multiple breathing exercises for the examinees until they previous history of severe liver and kidney disease, car- could maintain a uniform and stable breathing evaluation diovascular and cerebrovascular disease, and diabetes, and rate, so as to avoid the interference caused by breathing had no missing data. Furthermore, the patients aged 22–74 artifacts on image quality to the maximum extent and years old, and more than 60% were male. prevent abnormal breathing fluctuations from affecting the The criteria for exclusion were defined to include pa- image detection results. When the patient’s resting heart rate tients who underwent coronary stent implantation or bypass exceeded 70 beats per minute, antiarrhythmic drugs (such as surgery due to cardiovascular disease, had the scanned image Betaloc) had to be taken 1 hour before the start of the test to quality that could not be used to determine whether the make the heart rate normal and stable. coronary arteries were stenosis, had the past medical history of severe liver and kidney disease, cerebrovascular disease, 2.4.2. Scanning Method. A 64-slice spiral CT machine and diabetes, and had the missing data. (SIEMENS definition 4.0) was employed to scan with the heart mode and gated method. The ioversol contrast agent 2.3. Research Grouping. All the selected research objects was injected into the median cubital vein of each patient were enrolled into the observation group (group A) and the under high pressure at a flow rate of 5 mL/s. Moreover, the control group (group B) based on the detection results of time density changes of the aortic root were detected coronary CT angiography. The images of patients from through bolus tracking, and 110 HU was used as the group A showed stenosis of the main blood vessels, with a threshold to calculate the change of delay time during total of 83 cases. Besides, the images of group B presented no coronary artery scanning. Then, ioversol contrast agent was stenosis of the main blood vessels, and there were a total of injected again into the cubital vein at the original rate with a 67 cases. Group A was further subdivided into two groups dose of 1.0 mL/kg. The scanning range was from the trachea using different standards to conduct the following research. bifurcation to 10 mm below the septum. The scanning pa- First, it was subdivided into a soft plaque group, a mixed rameters included the following. The tube current was plaque group, and a calcified plaque group based on the 300–800 mA, tube voltage was 120 kV, the thickness of layer nature of plaque. The nature of plaque was defined by the was 5 mm, the layer thickness of reconstruction was plaque that caused the most severe coronary artery stenosis. 0.625 mm, and DFOV was 12.0 cm.
4 Scientific Programming

2.5. Image Analysis 2.6. Statistical Analysis. The data obtained in this study were
 input into Excel 2010 software and the corresponding da-
2.5.1. Coronary Artery Vascular Analysis. All scanned im- tabase was established. The statistical analysis of this study
ages were reconstructed using a deep learning-based blood adopted SPSS 13.0 statistical software, and measurement
vessel segmentation method, and the reconstructed images data were represented as mean ± standard deviation (x ± s).
were transmitted to the syngo.via workstation. What is When conforming to normal distribution, comparison be-
more, two radiologists reviewed the images in this study, tween two groups was detected by independent sample
who had extensive experience in reading the images. If there t-test, and the comparison among multiple groups was tested
was a disagreement, the two would decide after consultation. by one-way analysis of variance (ANOVA). Besides, the
Furthermore, the images of each patient were divided into 20 skewed distribution was represented by M (Q), pair com-
segments, and whether there were lesions, the nature of the parison was detected by Mann–Whitney U test, and
plaque, and the tissue of the lesion should be evaluated and Kruskal–Wallis test was used for comparison among mul-
analyzed. tiple groups. Spearman’s correlation was adopted to analyze
 The coronary artery segmentation method was adopted to the correlation of EATV with plaque properties and the
divide the coronary arteries by the American Heart Associ- degree of coronary stenosis. The area under the receiver
ation. Besides, they were divided into first obtuse marginal operating characteristic curve (ROC) (Az) was applied to
branch; right coronary artery proximal, middle, distal, and analyze the correlation between EATV and CHD. The count
posterior descending branch; the first and second diagonal data was represented by rate (%) and analyzed by X2 test. All
branches; segment between the first and second obtuse data were considered statistically substantial with P < 0 .05,
marginal branches; the second large obtuse marginal branch; while P > 0.05 indicated that the difference was not statis-
left main artery, left anterior descending branch, proximal, tically remarkable.
middle, and distal; the proximal of left circumflex branch; and
the distal part of the main circumflex branch. When the 3. Results
vascular segment was less than 2 mm, there was no reference
value in coronary artery assessment, so no in-depth study was 3.1. Algorithm Index Analysis. In the DRIVE data, the deep
needed. According to the classification standards established learning algorithm and the traditional algorithm were
by the American Heart Association, atherosclerotic plaques compared and analyzed, and the indexes included sensi-
were divided into three types, namely, calcified plaque, mixed tivity, specificity, accuracy, and area under the curve (AUC).
plaque, and noncalcified plaque. What is more, the criterion The results are shown in Table 1. The sensitivity, specificity,
for defining calcified plaque was CT value > 130 HU. When accuracy, and AUC of the deep learning algorithm were
the calcified area of plaque was less than half, it was mixed 0.8512, 0.9899, 0.9623, and 0.9813, respectively. By com-
plaque. When low-density plaque appeared in multiple ar- parison, the correlation results of the traditional George
terial stenosis images, it was soft plaque, also known as algorithm, Aslani algorithm, and Lahiri algorithm all re-
noncalcified plaque. In addition, the arteries were often di- duced hugely in contrast to those of the deep learning al-
vided into four categories according to the number of ste- gorithm (P < 0.05).
nosed coronary vessel in the results of CT coronary Figure 3 indicates that the blood vessel segmentation
angiography, including multiple-vessel disease, double-vessel method based on deep learning could accurately segment
disease, single-vessel disease, and no disease. capillaries that could not be distinguished, and the seg-
 mentation effect was good. Figures 3(a) and 3(b) show the
2.5.2. Measurement of Epicardial Adipose Tissue Volume. vascular segmentation images of the same coronary heart
The built-in software of the SIEMENS definition 4.0 mul- disease (CHD) patient, who was a 47-year-old male with a
tislice spiral CT machine was applied to quantitatively weight of 62 kg and a height of 178 cm.
measure the volume of each research object’s EAT. The
measuring physician manually outlined the surrounding
 3.2. Comparison on General Information of All Patients.
boundary at an interval of 6 mm in the area where the heart
 Figure 4 presents the comparison results of general infor-
was located and obtained fat images in the window width
 mation of patients from both groups. The mean age
range of − 250–30 Hu. Then, the measuring tool was
 (58.24 ± 7.36 years old) and the male proportion (71.1%) in
employed to accurately measure the fat volume, and mil-
 patients from the observation group were higher than those
liliters (mL) was used as the measurement volume unit. The
 of the control group (51.28 ± 7.78 years old and 64.2%), and
selected measurement range was the largest to the pulmo-
 the difference between the two groups was statistically
nary artery bifurcation, the smallest to the septal muscle, the
 marked (P < 0.05). The body weight of the observation group
anterior part to the sternum, and the posterior part to the
 (72.16 ± 9.84 kg) was higher than the weight of the control
descending aorta and esophagus. When the adipose tissue
 group (71.33 ± 10.57 kg), but there was no great difference
volume measured by the measuring tool was within the set
 between the two groups (P > 0.05).
CT threshold value range, it was recorded as EATV. On this
basis, the total volume within the currently checked range
was measured and recorded. In addition, the ratio of EATV 3.3. Epicardial Adipose Tissue Volume Results of Patients from
to total volume was calculated, which should be recorded the Two Groups. Figure 5 shows the typical epicardial fat
and analyzed. volume CT images of the observation group and the control
Scientific Programming 5

 Table 1: Index analysis on deep learning algorithm and traditional algorithm.
Method Sensitivity Specificity Accuracy AUC
Azzopardi et al. [8] 0.7612 0.9623 0.9426 0.9588
Aslani and Sarnel [9] 0.7588 0.9783 0.9548 0.9613
Lahiri et al. [10] 0.7534 0.9724 0.9465 0.9529
Deep learning algorithm 0.8512 0.9899 0.9623 0.9813
Note. AUC meant the area under the ROC curve. Accuracy � true positive/(true positive + false positive); sensitivity � true positive/(true positive + false
negative); and specificity � true negative/(false positive + true negative).

 (a) (b)

 Figure 3: Small blood vessels in coronary arteries. (a) The original image and (b) the algorithm segmented image.

 70 72.8
 ∗ 72.6
 60
 72.4
 50 72.2
 72
 Weight (kg)
 Average age

 40 71.8
 71.6
 30
 71.4
 20 71.2
 71
 10 70.8
 70.6
 0 Observation group Control group
 Observation group Control group
 (a) (b)
 80 72
 70 70
 60
 Number of men

 Male ratio (%)

 50 68
 40 66
 30 64
 20
 10 62
 0 60
 Observation group Control group

 Number of men
 Male ratio
 (c)

Figure 4: Comparison on general information of patients from both groups. (a) The comparison results of average age, (b) the comparison
results of weight, and (c) the comparison results of the number and proportion of men. ∗ The difference was statistically marked compared
with group B (P < 0.05).
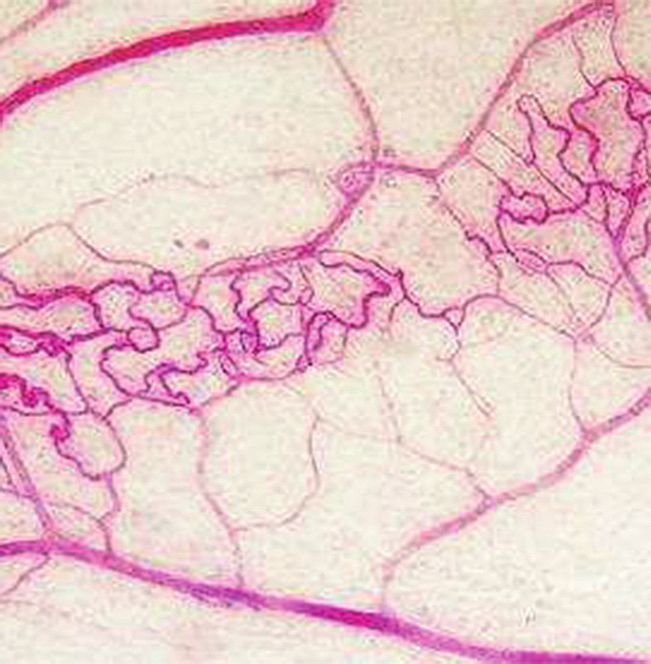
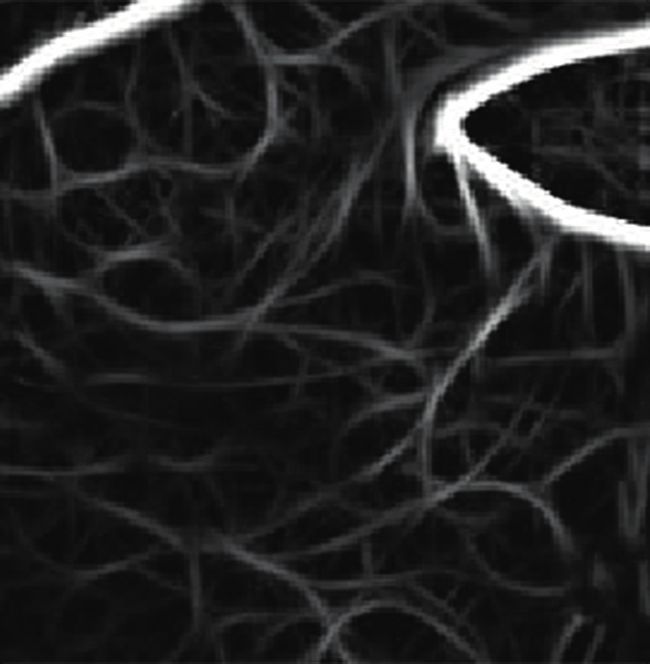
6 Scientific Programming

 (a) (b)

 Figure 5: CT images of EATV. (a) The control group and (b) the observation group.

group. Through comparison, it could be clearly observed that respectively, showing a significant positive correlation.
the area of high-density shadow of the epicardial fat in the CT Therefore, it could be adopted to predict coronary athero-
images of the observation group was larger than that of the sclerosis (Table 3).
control group. The EATV levels between the observation
group and the control group were compared and analyzed,
and the results are presented in Figure 6. The values of EATV 3.7. ROC Curve Analysis of the Authenticity of Coronary
and TV in patients from the observation group were Artery Judged by Epicardial Adipose Tissue Volume. The
114.23 ± 55.46 mL and 911.35 ± 227.78 mL in sequence, which results of coronary CT angiography were taken as the de-
were higher obviously than the control group tection standard, and when EATV was used to determine the
(92.65 ± 43.28 mL and 833.87 ± 162.66 mL) (P < 0.05). After coronary artery stenosis in the 67 cases of group B and 83
calculation, the EATV/TV values of the observation group cases of group A, a series of values related to sensitivity and
and the control group were 0.12 ± 0.05 and 0.11 ± 0.06, so specificity were generated within the defined range of dif-
there was no statistically obvious difference between the two ferent critical values. ROC curves were drawn with 1 −
groups (P > 0.05). It indicated that the value of EATV would specificity as the abscissa axis and sensitivity as the vertical
increase when patients suffered from coronary artery stenosis. axis. Judging by the Youden index (Youden’s index �
 sensitivity + specificity − 1), the cut-off value of coronary
 artery stenosis EATV was 95.32 mL, the ROC curve area in
3.4. Correlation between Epicardial Adipose Tissue Volume the figure was 0.645, the 95% confidence interval was
and Coronary Stenosis. There was a positive correlation of 0.517–0.726, and the P value was 0.002 (Figure 9).
EATV and the degree of stenosis (r � 0.317 and P � 0.004),
which could be obtained from Table 2. 4. Discussion
 In the noninvasive examination of CHD, CT imaging
3.5. Relationship of Epicardial Adipose Tissue Volume with the quantitatively measures the volume of epicardial fat to di-
Nature of Plaque and the Number of Stenosed Coronary Vessels agnose CHD. The detection effect is good, and it is necessary
in Patients from Group A. The EATV of patients from group to further promote the application. Many scholars have
A was not affected by the nature of coronary plaque and the shown that the development of coronary atherosclerosis is
number of stenosed coronary vessels and was always greater related to the excessive increase of epicardial fat volume and
than that of group B (P < 0.05). Among the groups of dif- adipokines [11]. In this study, the EATV, total cardiac
ferent plaque properties, the highest EATV of mixed plaque measurement volume, EATV/total measurement volume,
was 118.58 ± 54.35 mL, and the difference between the and CT value of EATV in groups A and B were compared,
groups was statistically significant (P < 0.05), as shown in showing that the EATV of group A was higher markedly
Figure 7. Among the groups of different lesions, the highest than the volume of group B (P < 0.05). Miyoshi et al. [12]
EATV in the double-vessel lesion group was 121.35 ± found that the increase in EATV was associated with the
58.58 mL, and the difference between the groups was sta- composition of coronary artery injury plaque and was not
tistically substantial (P < 0.05), as shown in Figure 8. affected by abdominal visceral fat tissue (VAT), coronary
 artery calcification (CAC) score, and body mass index
 (BMI). Motoyama et al. [13] disclosed that the degree of
3.6. Spearman’s Correlation of Epicardial Adipose Tissue damage to the coronary plaque injury plate was closely
Volume with the Nature of Plaque and the Number of Stenosed related to EATV, and the incidence of acute coronary
Coronary Vessels. The r values of EATV with the nature of syndrome in patients with CHD could be predicted based on
plaque and the number of lesions were 0.232 and 0.268, EATV to realize the prevention and treatment of the disease.
Scientific Programming 7

 140 Observation group Control group
 –103.5
 120
 –104
 100
 –104.5
 EATV (ml)

 80

 CT value (HU)
 –105
 60
 –105.5
 40
 –106
 20
 –106.5
 0
 Observation group Control group –107
 (a) (b)
 1000 0.18

 0.16
 950 ∗
 0.14

 900 0.12
 EATV/TV

 0.1
 TV (ml)

 850
 0.08

 800 0.06

 0.04
 750
 0.02

 700 0.00
 Observation group Control group Observation group Control group
 (c) (d)

Figure 6: Comparison on the EATV results of patients from group A and B. CT value: CT value of EATV; TV: total volume of the
delineated heart; EATV/TV: ratio of the epicardial adipose tissue volume to the total volume of delineated heart. ∗ The difference was
statistically substantial by comparing with group B (P < 0.05).

Table 2: Spearman’s correlation analysis between EATV level and 180 ∗#
the degree of coronary artery stenosis in patients from group A. 160 ∗
 140
Index r value P value ∗
 120
 EATV (mL)

EATV (mL) 0.317 0.004
 100
 80

Group A was divided into groups in this study according to 60
 40
the nature of plaque and the number of stenosed coronary
 20
vessels. It was found that there were obvious differences in
 0
the value of EATV in each group. Then, Spearman’s cor- Control Soft plaque Mixed plaque Calcified plaque
relation was used to analyze the correlation between EATV Observation
and CHD. It indicated that there was a positive relation of
EATV with the number of stenosed coronary vessels and the Figure 7: Comparison on EATV with different plaque properties in
nature of plaque. In addition, the results also revealed that patients from the observation group. ∗ P < 0.05 compared with
 group B; # P < 0.05 in contrast to soft plaque and calcified plaque in
there was no statistical difference between groups A and B in
 patients from group A.
the epicardial adipose CT value, EATV/measured total
volume value, suggesting that EATV was an independent
risk factor for CHD. Thus, it could be used as a clinical patient’s future coronary artery health, it is feasible to use
detection index for CHD, which was basically consistent high EATV as a risk factor, and it can increase the clinical
with the research findings of [14]. In the assessment of the predictive value of another detection index-calcification
8 Scientific Programming

 200 detection. However, this research still has shortcomings,
 ∗#
 ∗ such as too single research indexes, small research scope,
 160 insufficient sample size, and insufficient representativeness
 ∗
 of the research. Therefore, in future research, the diversity of
 EATV (mL)

 120
 research indicators and the extensiveness of research sam-
 80 ples will be strengthened to make the research results more
 representative. It is hoped that a more effective detection
 40 method can be provided for the clinical diagnosis and
 treatment of CHD in the future.
 0
 Control Single vessel Double vessel Multivessel
 Observation Data Availability
Figure 8: Comparison on the EATV of different stenosed coronary No data were used to support this study.
vessel in group A. ∗ P < 0.05 compared to group B; # P < 0.05 in
contrast to single-vessel disease and multiple-vessel disease.
 Conflicts of Interest
 The authors declare that they have no conflicts of interest
Table 3: Spearman’s correlation of EATV with the nature of plaque regarding the publication of this paper.
and the number of stenosed coronary vessel.
Index r value P value
 Authors’ Contributions
Nature of plaque 0.232 0.004 Han Wang and Hui Wang contributed equally to this work.
Stenosed coronary vessel 0.268 0.001
 References
 1.0 [1] O. Ghekiere, R. Salgado, and N Buls, “Image quality in
 coronary CT angiography: challenges and technical solu-
 0.8 tions,” British Journal of Radiology, vol. 90, no. 1072, Article
 ID 20160567, 2017.
 [2] H. Mı́rka, J. Ferda, and J. Baxa, “Assessment of myocardial
 0.6
 Sensitivity

 enhancement during coronary CT angiography in critically ill
 patients,” European Journal of Radiology, vol. 85, no. 10,
 0.4 pp. 1909–1913, 2016.
 [3] T. Mochizuki, S. Hosoi, H. Higashino, Y. Koyama, T. Mima,
 and K. Murase, “Assessment of coronary artery and cardiac
 0.2
 function using multidetector CT,” Seminars in Ultrasound, CT
 and MRI, vol. 25, no. 2, pp. 99–112, 2004.
 0.0 [4] P. Schoenhagen, S. S. Halliburton, A. E. Stillman et al.,
 0.0 0.2 0.4 0.6 0.8 1.0 “Noninvasive imaging of coronary arteries: current and future
 1 – specificity role of multi-detector row CT,” Radiology, vol. 232, no. 1,
 pp. 7–17, 2004.
 Epicardial adipose tissue volume [5] D. Andreini, G. Pontone, S. Mushtaq et al., “Image quality and
 Reference line radiation dose of coronary CT angiography performed with
 Figure 9: ROC curve of epicardial adipose tissue volume. whole-heart coverage CT scanner with intra-cycle motion
 correction algorithm in patients with atrial fibrillation,” Eu-
 ropean Radiology, vol. 28, no. 4, pp. 1383–1392, 2018.
 [6] X. Xie, M. J. Greuter, J. M. Groen et al., “Can nontriggered
score for CHD [15]. In recent years, bio-friendly imaging thoracic CT be used for coronary artery calcium scoring? a
technologies such as CT have played an increasingly critical phantom study,” Medical Physics, vol. 40, no. 8, Article ID
role in the clinical detection of cardiovascular diseases 081915, 2013.
through the quantitative measurement of EATV [16]. [7] A. Yerramasu, S. Venuraju, S. Atwal, D. Goodman, D. Lipkin,
 and A. Lahiri, “Radiation dose of CT coronary angiography in
 clinical practice: objective evaluation of strategies for dose
5. Conclusion
 optimization,” European Journal of Radiology, vol. 81, no. 7,
In this study, CT images based on deep convolutional neural pp. 1555–1561, 2012.
 [8] G. Azzopardi, N. Strisciuglio, M. Vento, and N. Petkov,
network learning algorithms were applied to detect EATV,
 “Trainable COSFIRE filters for vessel delineation with ap-
and the correlation between EATV and CHD was explored. plication to retinal images,” Medical Image Analysis, vol. 19,
The results disclosed that the sensitivity and other index no. 1, pp. 46–57, 2015.
values of the deep learning algorithm were improved sig- [9] S. Aslani and H. Sarnel, “A new supervised retinal vessel
nificantly compared with the traditional algorithm. The segmentation method based on robust hybrid features,”
volume of epicardial fat was closely related to the devel- Biomedical Signal Processing and Control, vol. 30, no. 9,
opment of CHD, and it can be used as a marker for CHD pp. 1–12, 2016.
Scientific Programming 9

[10] A. Lahiri, A. G. Roy, D. Sheet, and P. K. Biswas, “Deep neural
 ensemble for retinal vessel segmentation in fundus images
 towards achieving label-free angiography,” in Proceedings of
 the Annual International Conference of the IEEE Engineering
 in Medicine and Biology Society, pp. 1340–1343, IEEE Engi-
 neering in Medicine and Biology Society, Orlando, FL, USA,
 August 2016.
[11] A. Sabarudin, Z. Sun, and K.-H. Ng, “Radiation dose asso-
 ciated with coronary CT angiography and invasive coronary
 angiography: an experimental study of the effect of dose-
 saving strategies,” Radiation Protection Dosimetry, vol. 150,
 no. 2, pp. 180–187, 2012.
[12] T. Miyoshi, K. Ejiri, K. Kohno et al., “Effect of remote ischemia
 or nicorandil on myocardial injury following percutaneous
 coronary intervention in patients with stable coronary artery
 disease: a randomized controlled trial,” International Journal
 of Cardiology, vol. 236, pp. 36–42, 2017.
[13] S. Motoyama, T. Kondo, H. Anno et al., “Atherosclerotic
 plaque characterization by 0.5-mm-slice multislice computed
 tomographic imaging comparison with intravascular ultra-
 sound,” Circulation Journal, vol. 71, no. 3, pp. 363–366, 2007.
[14] A. Yerramasu, D. Dey, S. Venuraju et al., “Increased volume of
 epicardial fat is an independent risk factor for accelerated
 progression of sub-clinical coronary atherosclerosis,” Ath-
 erosclerosis, vol. 220, no. 1, pp. 223–230, 2012.
[15] W. Dong, J. Li, H. Mi, X. Song, J. Jiao, and Q. Li, “Relationship
 between collateral circulation and myocardial viability of 18F-
 FDG PET/CT subtended by chronic total occluded coronary
 arteries,” Annals of Nuclear Medicine, vol. 32, no. 3,
 pp. 197–205, 2018.
[16] H. N. Lee, J. I. Kim, and J.-M. Cho, “Bilateral coronary artery
 to left ventricular fistula: CT demonstration of drainage via a
 single, common channel,” Cardiology in the Young, vol. 27,
 no. 4, pp. 782-783, 2017.
You can also read