DEMOCRACY DENIED THE 2019 ELECTION AUDIT - IAN SIMPSON AUGUST 2019 - LOCALGOV
←
→
Page content transcription
If your browser does not render page correctly, please read the page content below
Democracy
Denied
The 2019
Election Audit

Ian Simpson
August 2019
2 Democracy Denied: The 2019 Election Audit
Contents

5      Foreword

9      Introduction

15     Chapter 1
       English Local Elections 2019

27     Chapter 2
       European Parliament Election 2019
       (Great Britain)

33     Chapter 3
       Scottish Local Elections 2017

38     Conclusion

40     Appendix

Acknowledgements:
We would like to thank Dr Jess Garland, Michela
Palese, Jess Blair, Phil Connor, Doug Cowan,
Tash Fodil, Alice Kinghorn-Gray, Lizzie Lawless,
Mat Mathias, Josiah Mortimer, Jon Narcross and
Willie Sullivan and for their help in this report.

                               Electoral Reform Society 3
Produced with the
generous support of
Bruce Abbott, Frank Abel, Peter               Inkpen, Iris Jeffries, Martin Jeffries,
Robert Adamczyk-Haswell, Martin               Guy Johnson, Christopher Jones, Sue
Akerman, John Allcock, Tim Allen,             Kaberry, Les Keen, Martin Kilbey,
Jon Allen, Rosalind Atkins, Thomas            Andrew Kitching, Vivienne Kynaston,
Austin, Steven Azzopardi, David               Jonathan Langley, Philip Latham,
Baillie, Peter Baker, Geoffrey Band,          Claire Lewis, Sheila Lisster, Keith
Lionel Barnes, Joanne Barnes, Roosje          Lloyd, James Lockley, Ron Lofkin, Ian
Barr, Eryl Bassett, David Beach, Rob          Magrath, Susie Main, Jan Mallett,
Beaumont, Richard Bell, Trevor                Robert Mather, Norman Matthews,
Blight, Teresa Bliss, Alison Bomber,          Pat McColl, David McDowell,
Rosanne Bostock, Stephanie Bradley,           Dermot McGovern, John McNabb,
Waldemar Brandt, Ian Bridge, Julian           Roy Meddings, David Mellenchip,
Burn, Richard Burnett-Hall, Paul              Romilly Micklem, David Minns,
Cairns, Simon Campbell-Jones, Peter           Linda Montgomery, Michele Mooney,
Carey, Howard Carr, Mike Chaloner,            Malcolm Morgan, Theo Morgan,
Sarah Chaytor, Nicholas Clark, Simon          David Mortimer, S Mumford, Jen
Clarke, Jonathan Clennell, Chris              Murray, Irene Newton, Roger
Coles, Leslie Connor, Shaun Coster,           Newton, David Ockenden, Margaret
Jack Coy, Jim Craig, Sue Craig, Peter         Owens, Alan Parker, Andrew Patrick,
Craven, C Critchley, David Croome,            Madeline Peasgood, Rosamund
Guy Cumberbatch, David Curtis,                Pendry, Barbara Phillips, Gillian Potts,
John Davies, Vicky Daybell, Andrew            Michael Price, Adam Pritchard, Sallie
Dell, Nanci Downey, Patrick Dunne,            Ranken, Peter Richell, John Ridge,
David Eastlick, Bryan Eberli, Ian             Peter Roberts, John Rogers, David
Elliott, Peter England, Penelope              Royle, Andrea Rudge, Anders
Erskine, Richard Evans, Mandy Evans           Rumbold, Lawrie Scott, Vicky
Ewing, Annabel Faraday, David                 Seddon, Will Shepherd, Diane Sider,
Farmer, Martin Farrow, Stephen                Margaret Smith, Martin Smith, David
Fletcher, Margaret Foggie, Nigel              Squires, Barbara Stimpson, Martin
Fordham, Janet Franklin, Michael              Stott, Philip Stringer, Alan Sturrock,
Gallagher, Chris Game, Alisoun                KJ Swainson, Neil Thomson, Graham
Gardner-Medwin, John Gibbons,                 Thomson, John Tompkins, Ian
Sylvia Glover, William Gordon,                Tranter, Bob Troup, Jack Tyrrell-
Michael Hardy de Guerra, John                 Killian, Jane Vaus, Brian Wallis, Kevin
Hatfield, Peter Haydon, Brian                 Walsh, Stewart Ware, Andrew
Haynes, John Headon, Robert                   Watters, Susan Western, Mike White,
Henderson, John Hill, Terry Hill,             Steve Whitley, Gerald Wiener,
Howard Wilson Hilton, Clare                   Christopher Willey, Alison Williams,
Himmer, Catherine Hindson,                    Erik Williams, Paul Winn, Derek
Matthew Holley, Dominic Horne,                Wood, Geoff Wood, Nick Yapp, Colin
Victoria Hume, Patricia Humphrey,             Young, Robert Young, Richard Young
Brian Hutt, Philip Hyde, Roger                and Dr Robert Young
4 Democracy Denied: The 2019 Election Audit
Foreword

                           If two party politics isn’t dead, it has certainly
                           taken a big hit over the first half of 2019. The
                           English local elections and European Parliament
                           election, both held in May, saw big gains for those
                           other than the ‘traditional’ two parties –
                           Conservative and Labour.
Dr Jess Garland               Voters appear keen to shop around at the ballot
Electoral Reform Society   box. However, breaking out of the constraints of
Director of Policy and
Research                   the winner-takes-all First Past The Post (FPTP)
                           voting system – one that is infamous for distorting
                           results – can be difficult.
                              Our analysis of the English local elections, held
                           under FPTP, reveals some startling injustices,
                           which affect all parties negatively in one area or
                           another. However, the real losers are voters who do
                           not see their choices properly reflected in their
                           local council chambers.
                              For example, in nearly half of all English local
                           councils a single party was able to secure more than
                           half of the councillors up for election, while winning
                           fewer than half of votes cast across the local
                           authority area. The most extreme example was
                           Havant Borough Council, where the Conservatives
                           won every single councillor up for election with only
                           a 44% share of the votes cast, leaving the choices of
                           a majority of voters unrepresented.
                                                           Electoral Reform Society 5
Other areas saw parties winning the most
council seats, of those up for election, when they
had not won the most votes in the area. One of the
most striking examples was Basildon Borough
Council, where Labour won less than a quarter of
the vote – almost half the Conservatives’ vote tally
– yet elected more councillors.
Even worse for democracy are the scourge of
uncontested and under-contested seats where a
party is guaranteed a seat or seats, due to a lack of
candidates being put forward in their ward. We
uncovered hundreds of uncontested and under-
contested seats and wards in councils across
England affecting over 800,000 potential voters.
Democracy wasn’t just lacking in these wards – it
was effectively cancelled.
The somewhat unexpected European
Parliament election was therefore a breath of fresh
air for many voters, in some respects. While the
D’Hondt Closed Party List voting system isn’t
perfect, it is a proportional system, which gives
voters a better chance of their vote counting than
FPTP does.
It is the Scottish local elections, however, that
provide a real contrast with the English local
election results. The proportional, multi-member
Single Transferable Vote (STV) system, used in
Scottish local elections since 2007, brings a host of
democratic benefits, from greater competition and
choice to much fairer and more proportional
outcomes. We bring these to light by analysing the
results of the most recent Scottish local elections,
held in 2017.
As talk grows of a General Election, these
discussions are far from academic. Voting systems
have a profound effect on both representation and
outcomes – and indeed how people express
themselves. Polling for this report found that more
than one in five people plan to vote ‘tactically’ in
6 Democracy Denied: The 2019 Election Auditthe next general election, not voting for who they
want, but voting against someone else. This is not
how democracy should be working. The problems
caused by FPTP at local level in England apply
across the UK at general elections.
This is the first major analysis of this year’s
local elections – and we’re grateful to Democracy
Club1 for providing the full set of results and also
1. English local election to the many ERS supporters who donated to fund
results provided by
Democracy Club and this report. All three sets of elections analysed
checked by ERS staff here offer some fascinating insights into the state
against results published on
local authority websites. of politics in Britain – and how voting systems
https://democracyclub.org.
uk
affect representation.
Electoral Reform Society 78 Democracy Denied: The 2019 Election Audit
Introduction

                             A state of turbulence defines British politics in
                             the summer of 2019, the Government’s working
                             majority (including the 10 Democratic Unionist
                             MPs) cut to one, following the result of the
                             Brecon and Radnorshire by-election on 1
                             August.2 Political discussion, meanwhile, is
Ian Simpson                  dominated by a potential autumnal clash
Electoral Reform Society     between government and parliament over
Research Officer
                             whether a ‘no-deal’ Brexit is acceptable.
2. The Week (2019).             While politics itself has felt unpredictable,
Brecon and Radnorshire
by-election result cuts      the British electorate appears to have become
Johnson’s majority to one.   more fragmented and volatile than ever before.
https://www.theweek.co.
uk/102581/brecon-and-        A number of developments over spring and
radnorshire-by-election-
result-cuts-johnson-s-
                             summer 2019 have provided evidence of this
majority-to-one              heightened volatility.
                                The English local elections, on 2 May, saw big
                             net gains in councillors for the Liberal Democrats
                             and Green Party, as well as a rise in the number of
                             independents elected. Both the Conservatives and
                             Labour suffered net losses of councillors. Less than
                             a month later the newly formed Brexit Party
                             topped the poll at the European Parliament
                             election, pushing Labour into third place and the
                             Conservatives into fifth. This was the first time
                             since the 1918 general election that neither the

                                                            Electoral Reform Society 9
3. Apart from a Conservatives nor Labour finished in the top two
parliamentary by-election
for the now defunct English in a UK-wide election. In addition, the
Universities constituency. parliamentary by-election in Peterborough, on 6
4. Evans, Albert (2019). June, saw Labour’s candidate receive the lowest
Peterborough by-election
results: Sir John Curtice winning vote share in a parliamentary by-election
says ‘we are in a different since 19453 – just 30.9% of the vote.4
world’ after Labour win with
smallest ever vote share. I A string of general election voter intention poll
News, 07 June. https://
inews.co.uk/news/politics/
records were also broken throughout May and June
peterborough-by-election- 2019. This period saw the combined Conservative
results-labour-won-vote-
share-john-curtice-brexit- and Labour vote share fall below 50% for the first
party/ time in polling history.5 Although opinion polls
5. YouGov poll (30 May during the first half of August showed something
2019). https://yougov.co.uk/
topics/politics/articles- of an increase in support for the two main parties,
reports/2019/05/30/ their combined vote share remained around 10–15
lib-dems-lead-polls-they-
start-become-party-48 percentage points below the lowest seen at any
6. YouGov poll (08 Aug general election for over a century.6
2019). https://yougov.co.uk/
topics/politics/articles- This volatility and voter fragmentation is an
reports/2019/08/08/ important development in itself but is perhaps all
voting-intention-con-31-
lab-22-lib-dem-21-brex-14- the more remarkable given that just two years ago,
the 2017 UK general election was viewed by some
as a reversion to ‘two-party politics’, with the
Conservatives and Labour garnering a combined
84.4% of votes cast in Great Britain. This was the
highest Conservative and Labour combined vote
share in a general election for nearly half a century,
with the 1970 general election being the last time a
7. House of Commons higher total than this (90.0%) was recorded.7
Library Briefing Paper
(2019). UK Election Statistics: However, it is important to note that the headline
1918-2019: A Century of result of the 2017 general election masked the fact
Elections. https://
researchbriefings.files. that around one in five people were estimated to
parliament.uk/documents/
CBP-7529/CBP-7529.pdf
have voted ‘tactically’, i.e. not for their first-choice
party but for a party they perceived to be in a better
8. Garland, Jess and Terry, position to beat a party that they disliked.8 The
Chris (2017). The 2017
General Election: Volatile vagaries and iniquities of the FPTP electoral system
voting, random results. helped paint an unrealistic picture of the extent to
London. Electoral Reform
Society. https://www. which ‘two-party politics‘ had been restored.
electoral-reform.org.uk/
latest-news-and-research/
Prior to the 2017 general election, British
publications/the-2017- electoral politics had seen a steady decline in the
general-election-
report/#sub-section-5 concentration of votes for the two main parties.
10 Democracy Denied: The 2019 Election AuditIt was highest in the immediate post-World War II
period, reaching a high point of a combined 97.2%
vote share at the 1951 general election. By the
second decade of the 21st century, those voting this
way had fallen from nearly all voters, to around two
thirds, 66.6% voting this way at the 2010 general
election and 68.9% at the 2015 general election.
Processes of class and partisan dealignment are
viewed as key drivers of this trend,9 which the 2017
9. Webb, Paul (2000). The general election very much bucked.
Modern British Party System.
London. SAGE Publications. It now appears at least possible that the long-
term trend of a fracturing electorate is being
re-asserted. As Sir John Curtice, Professor of
Politics at the University of Strathclyde puts it:
‘There is little doubt that Britain’s traditional
two-party system is facing its biggest challenge yet
in the wake of the Brexit impasse’.10
10. Morris, Nigel (2019). Our findings also highlight the unsuitability of
The political system is at
breaking point as voters FPTP for Westminster elections. Many people do
‘shop around’ more than not feel able to opt for their first choice under
ever, electoral experts
warn. I News, 05 June. Westminster’s one-person-takes-all voting system.
https://inews.co.uk/news/
politics/the-political-
BMG polling for the ERS reveals that - similarly to
system-is-at-breaking- 2017 - in a snap general election over a fifth (22%)
point-as-voters-shop-
around-more-than-ever- of voters say they plan to opt for a party or
electoral-experts-warn/ candidate to keep out someone they dislike more.11
11. Electoral Reform Given the volatility and renewed fragmentation
Society press release (16
Aug 2019). BMG poll: One in of the electorate and the possibility of a general
five planning to vote tactically election being fought in the near future, it is a
in snap election https://www.
electoral-reform.org.uk/ good moment to explore how the use of different
latest-news-and-research/
media-centre/press-
voting systems translates votes into representation.
releases/bmg-poll-one-in- Two large-scale sets of elections have taken
five-planning-to-vote-
tactically-in-snap- place in Britain this year: English local elections,
election-2/ held in nearly 250 local authorities; and the
European Parliament (EP) election, held
throughout the whole of the UK. The use of both
a majoritarian voting system (First Past The Post
for the English local elections) and a proportional
voting system (Closed List PR for the EP
election) provides a useful point of comparison
Electoral Reform Society 11for this report. In addition, we also explore the
most recent set of Scottish local elections, held in
May 2017. These elections allow us to contrast the
outcomes of the voting system used for Scottish
local elections, Single Transferable Vote (STV) (the
ERS’s preferred voting system), with both FPTP
and another type of proportional system (Closed
List PR).
For all three of these elections there will be a
description of the voting system used, a synopsis of
the overall results and an exploration of how each
election fared in relation to a number of
democratic outcomes.
12 Democracy Denied: The 2019 Election Audit14 Democracy Denied: The 2019 Election Audit
1 English Local Elections
2019
Thursday 2 May 2019 saw the biggest set of English
local elections for four years. Elections took place
in 248 local authorities in England (168 non-
metropolitan districts; 47 unitary authorities; 33
metropolitan boroughs).
In 101 local authorities, one-third of councillors
were up for election. In these authorities, one
successful candidate was elected per ward, via the
First Past The Post (FPTP) system. Each voter had
one vote and the candidate with the highest
number of votes in each ward was elected,
irrespective of whether their vote share was 30%
or 70%. All other candidates in the ward were
unsuccessful, whether they came second or
seventh, meaning the ballots of voters who
supported these candidates were ignored.
In the other 147 local authorities where elections
took place, all councillors were up for election. In
these authorities, either one, two or three
councillors were elected per ward. Councillors
were again elected using the FPTP system with
voters having one, two or three votes, depending
on the number of councillors to be elected in the
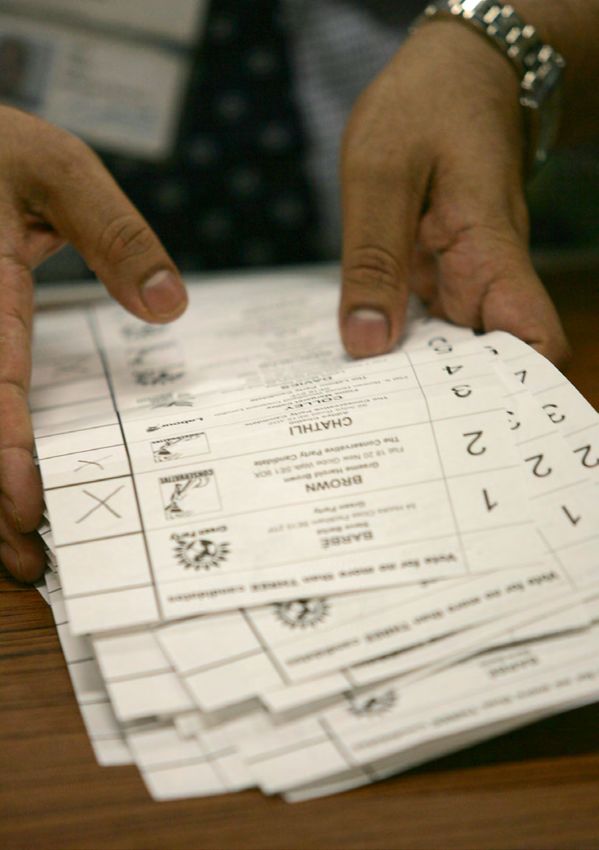
ward. Where voters had two or three votes, their
votes were non-preferential, i.e. voters were
Electoral Reform Society 15instructed to mark their ballot paper with either
two or three ‘X’s, rather than use numbers to
indicate their preferred candidates. Where two or
three candidates were elected, the two or three
candidates with the highest number of votes in the
ward were elected, with all candidates below the
cut-off line being unsuccessful.
Results
Overall, the elections saw big gains for the Liberal
Democrats, Green Party and independents, while
12. BBC News (2019). the Conservatives suffered big losses and Labour
England local elections
2019. https://www.bbc.co. saw a small reduction in their number of
uk/news/topics/ councillors. Ukip had a smattering of councillors
ceeqy0e9894t/england-
local-elections-2019 (only elected, while neither the Brexit Party nor Change
includes councils where
elections took place).
UK stood candidates in these elections.12
Table 1: Councillors elected Party Councillors Change Councils Change
and council control by party, elected controlled
English local elections 2019
Conservative 3564 -1330 93 -44
Labour 2021 -84 60 -6
Liberal 1352 706 18 10
Democrat
Independent 1044 604 2 2
Green 265 194 0 -
13. The Economist (2019). Residents’ 119 49 2 1
Voters punish Labour and Association
the Tories at local elections
over the Brexit deadlock. Ukip 31 -145 0 -
https://www.economist. Other 14 6 0 -
com/britain/2019/05/03/
No Overall 73 37
voters-punish-labour-and-
the-tories-at-local- Control
elections-over-brexit-
deadlock
Some commentators saw the results through the
14. Simons, Ned (2019). prism of the ongoing Brexit debate, arguing that
Local Election Results 2019:
Tories And Labour Punished the Conservatives and Labour were punished over
Over Brexit As Lib Dems Win a failure to break the Brexit deadlock.13 14 However,
Big. Huffington Post, 03 May.
https://www. with these being local elections, it is important not
huffingtonpost.co.uk/entry/
local-elections-2019-
to underestimate the myriad local issues that will
tories-and-labour- have played a role in many of the contests up and
punished-amid-brexit-
deadlock-as-lib-dems-win- down the country.
big_uk
16 Democracy Denied: The 2019 Election AuditWhatever the reasons, the 2019 local elections
resulted in substantial changes to the political
landscape of English local government. The
Conservatives control fewer councils than they
have done at any point for the last fifteen years.
The Liberal Democrats more than doubled the
number of councils they control, to the extent that
they run almost as many councils as they did before
the collapse in their support, precipitated by the
formation of the national Conservative–Liberal
Democrat coalition government in 2010. The Green
Party elected more councillors than at any time for
over twenty years, while over 1,000 independent
candidates were elected, more than double the
number that were elected four years earlier.15
15. House of Commons These elections were the most volatile set of
Library Briefing Paper
(2019). Local Elections 2019. English local elections, in terms of the number of
https://researchbriefings. council seats changing hands, for nearly a quarter of
files.parliament.uk/
documents/CBP-8566/ a century. The last time more seats changed hands
CBP-8566.pdf
was in 1995, when the Conservatives suffered a loss
of over 2,000 council seats, mostly at the hands of a
Labour Party riding high under its recently elected
new leader, Tony Blair.16 In 2019, the fragmented
16. Daily Telegraph (2019). nature of the political landscape is reflected in the
Local elections 2019: Tories
lose more than 1,200 seats fact that while the Conservatives again suffered a
in worst performance since big net loss of seats, Labour also suffered a net loss,
1995. https://www.
telegraph.co.uk/ with the gains being shared among other parties,
politics/2019/05/03/
local-elections-2019-
independents and local groups.
results-councils-tory-
party-loss/
Uncontested and under-contested seats
A key feature of representative democracies is
that free and fair elections take place, where
citizens are able to choose who represents them
at a particular level of government. However for
some people in England, the right to participate
in deciding who should represent them at local
authority level does not exist, or is limited. This
is due to uncontested or under-contested seats
which have been in evidence in English local
Electoral Reform Society 17government for decades and continued to
blight people’s democratic options in this year’s
local elections.17
17. Electoral Reform Uncontested seats occur where the number of
Society (2011). 2011 English
Local Elections. London. candidates standing for election in a ward matches
Electoral Reform Society. the number of councillors to be elected in that
https://www.electoral-
reform.org.uk/latest-news- ward. In other words, there are only enough
and-research/
publications/2011-english-
candidates for the seats available. These candidates
local-elections/ become councillors without any votes having been
cast, meaning that there is no democratic decision
for the electors of such wards to make. Our
analysis finds that in this year’s local elections 150
councillors were ‘elected’ in this way, across 47
local authorities, representing nearly one-in-five
councils where elections took place. Over 250,000
potential voters were denied any say in the
selection of their local councillor(s) this year.18
18. Electorate sizes are In addition to wards where no voting took
estimates. For most wards,
Boundary Commission for place, there were a significant number of ‘under-
England data from 2015 contested’ wards. Under-contested wards are
were used https://boundary
commissionforengland. multi-member wards (where more than one
independent.gov.uk/
data-and-resources/
councillor is elected) where a party was
electoral-data-for-the- guaranteed to win at least one seat because there
2018-review.
were not enough candidates to contest every seat
Where there was evidence in that ward. For example, in Melton Dorian ward
that there have been
boundary changes in a on Melton Borough Council in the East
council since 2015, we have
used figures from the most Midlands, three councillors were to be elected
recent Local Government and there were only four candidates (three
Boundary Commission for
England review for that local Conservatives and one Green). This meant that
authority (http://www.
lgbce.org.uk).
the Conservatives were guaranteed to elect at
least two councillors in this ward.
As well as the 150 councillors who won without a
single vote being cast in uncontested seats, there
were an additional 154 council seats guaranteed for
one party or another before a vote had been cast,
in under-contested wards that spanned 54 local
authorities. Around another 580,000 potential
voters had their choice of local councillor limited
in this way.
18 Democracy Denied: The 2019 Election AuditTable 2: Local authorities
with high instance of
Uncontested Seats and
Guaranteed Seats, English
local elections 2019
Authority Region Previous Current Uncontested/ Seats Uncontested/
Guaranteed available Guaranteed
seats seats (%)
Fenland East of England Con Con 15 30 50
Rutland East Midlands Con Con 12 27 44.4
Melton East Midlands Con Con 11 28 39.3
South Holland East Midlands Con Con 13 36 36.1
North Kesteven East Midlands Con NOC 10 43 23.3
Oadby & Wigston East Midlands LD LD 6 26 23.1
Lichfield West Midlands Con Con 10 47 21.3
Wychavon West Midlands Con Con 9 44 20.5
Great Yarmouth East of England Con Con 8 39 20.5
Sevenoaks South East Con Con 11 54 20.4
West Suffolk East of England New New 13 64 20.3
East Lindsey East Midlands Con Con 9 55 16.4
South Staffordshire West Midlands Con Con 8 49 16.3
Copeland North West Lab Lab 5 33 15.2
Breckland East of England Con Con 7 49 14.3
Selby Yorkshire & Humber Con Con 4 28 14.3
Bolsover East Midlands Lab NOC 5 37 13.5
Ashford South East Con Con 6 46 13
West Devon South West Con Con 4 31 12.9
West Lindsey East Midlands Con Con 4 36 11.1
Epping Forest East of England Con Con 2 18 11.1
Staffordshire West Midlands Con NOC 6 56 10.7
Moorlands
Hambleton Yorkshire & Humber Con Con 3 28 10.7
Malvern Hills West Midlands Con NOC 4 38 10.5
Allerdale North West NOC NOC 5 49 10.2
Mid Sussex South East Con Con 5 50 10
Ryedale Yorkshire & Humber NOC NOC 3 30 10
Even in wards where there were no uncontested or
guaranteed seats, there were not always a wide range of
parties for voters to choose from. There were 817
wards, in 141 local authorities (close to half of councils
where elections took place), where voters had a choice
between only two parties, or between a candidate
representing one party and an independent candidate.
Electoral Reform Society 19With voters showing a renewed desire to
support a wide range of parties (see Introduction),
it is likely that many of the approximately 2.65
million voters who live in wards where only a
binary choice was on offer, were left frustrated by
their options.
These examples of voters being denied a say in
deciding their local representatives, or facing a
limited choice of options, are linked to the voting
system. Under FPTP the barriers to success can be
very high. There are many areas of England where
representatives of one party or another may feel
that it is almost impossible for them to gain
representation under the FPTP system, even in
areas where they might have fairly significant levels
of support. It is therefore understandable, if
disappointing, that parties decide not to stand
candidates in all areas, instead focusing limited
resources on the places where they have the best
chances of being able to jump the FPTP hurdle
and achieve representation on local councils.
On the same day as the English local elections,
elections also took place for Northern Irish local
councils.19 In contrast to the English local
19. BBC News (2019). elections, no voters in Northern Ireland were
Northern Ireland local
elections 2019. https:// denied a say due to living in an uncontested
www.bbc.co.uk/news/ electoral area. Northern Ireland has long used the
topics/cj736r74vq9t/
northern-ireland-local- STV voting system for local elections and the
elections-2019
section of this report that focuses on the 2017
Scottish local elections, which also used STV, will
explore why using this system reduces the chances
of uncontested seats occuring. This report focuses
on the Scottish local elections, rather than the
Northern Irish local elections because the party
systems in England and Scotland are much more
comparable (the Great Britain-based parties either
do not participate in elections in Northern Ireland
or are very minor players).
20 Democracy Denied: The 2019 Election AuditProportionality of results
In the following section we analyse the political
outcomes of the 2019 local elections in more detail.
The 150 councillors ‘elected’ in uncontested seats,
without voting taking place, are excluded from the
analysis throughout the rest of this chapter.
Analysis of election results in each English local
authority reveals that in nearly half of councils
where elections took place, one party was able to
win a majority of seats up for election with fewer
than half the votes cast across the council area.
This outcome occurred in 115 local authorities,
representing 46% of councils where elections took
place this year. In the most extreme case, the
Conservatives won every single seat up for election
on Havant Borough Council while winning only
44% of votes across the borough.
It is surely something of a democratic anomaly
that in so many places a single party was able to
win over half the available council seats (and in the
vast majority of cases go on to run the local
authority), when over half the votes in that area
went to candidates not representing that party.
This is an anomaly that hurts all parties and
their supporters in one area or another. The
Conservatives, Labour and the Liberal Democrats
all lose out or benefit in different places (see Table
3) – risking complacency through lack of scrutiny
in some areas, and artificially eradicating their
pockets of support in others.
In each of the areas it is voters that lose out,
with councils often being run on a one-party basis,
when this simply does not reflect the level of
support for each party at a local level. In many
cases, even where a party is able to achieve over
50% support at the ballot box, they are still vastly
over-represented in terms of seats. For example,
Labour won every single seat up for election on
Sandwell Metropolitan Borough Council, in the
Electoral Reform Society 2120. Fazekas, Mihaly (2015). West Midlands. While the party was able to win a
The cost of one-party
councils: Lack of electoral healthy 59% of votes across the council area, this still
accountability and public means that over two-fifths of votes went
procurement corruption.
London. Electoral Reform unrepresented in the council chamber. As a 2015
Society. https://www.
electoral-reform.org.uk/
study for the ERS found, these types of results are
latest-news-and-research/ not conducive to healthy local government scrutiny.20
publications/the-cost-of-
one-party-councils/
Table 3: Top 10 over- Authority Party Council Votes for Seats for Gap
represented parties, over- control party (%) party (%) (%)
English local elections 2019
represented
Havant Con Con 43.9 100 56.1
Redditch Con Con 40.5 90 49.5
City of Lincoln Lab Lab 44.5 90.9 46.4
Tameside Lab Lab 46.2 89.5 43.2
Sandwell Lab Lab 58.5 100 41.5
Eastleigh LD LD 52.1 92.3 40.2
Wigan Lab Lab 41.4 80 38.6
Manchester Lab Lab 58.5 97 38.4
Tamworth Con Con 42.4 80 37.6
Salford Lab Lab 41.7 78.9 37.3
It is again worth noting the contrast with this
year’s local elections in Northern Ireland, where
no party got an unfair majority of seats on a
minority of votes. The part that the ranked-choice
system of STV plays in ensuring fairer electoral
outcomes at local elections will be explored in the
chapter on the 2017 Scottish local elections.
Another way of measuring the proportionality
of electoral outcomes is via the Loosemore-Hanby
Deviation from Proportionality (DV) Index. The
DV Index is calculated by adding up the difference
between each party’s vote share and their seat
share in each electoral area and dividing by two,
21. Independents and local giving a ‘total deviation’ score. The higher the
groups such as Residents’
Associations were grouped score, the more disproportionate the result.
together for the purposes of In the case of local elections, the key DV scores to be
creating DV scores. Other
political parties, who calculated are those for each individual local authority, as
received fewer than 5% of
votes across the country,
these represent 248 separate elections. These scores
were also grouped together. reflect the cumulative difference between vote share and
seat share for all parties across each local authority.21 The
mean DV score across the 248 local councils that held
22 Democracy Denied: The 2019 Election Auditelections was 19.6. This score is very much in line with
DV scores for recent general elections, also held under
22. Renwick, Alan (2015). FPTP, with the mean DV score across the last six general
Electoral
Disproportionality: What Is elections being 20.3.22 At the very disproportionate end
It and How Should We of the scale, there were a number of councils with
Measure It? Politics at
Reading, 29 June https:// extremely high DV scores (see Table 4), with five
blogs.reading.ac.uk/
readingpolitics/2015/06/29/
councils having scores above 40.0 and one council
electoral- (Havant) having a score above 50.0. These scores will be
disproportionality-what-is-
it-and-how-should-we- placed into greater context when they are compared with
measure-it/ DV scores for the EU Parliament election and the 2017
Scottish local elections, in later chapters of this report.
Table 4: Top 30 most Authority Region Previous Current DV Score
disproportionate results,
English local elections 2019 Havant South East Con Con 56.1
Redditch West Midlands Con Con 49.5
N.B. DV score calculations City of Lincoln East Midlands Lab Lab 46.4
exclude the 150 councillors Tameside North West Lab Lab 43.2
‘elected’ in uncontested
seats, where voting did not
Eastleigh South East LD LD 42
take place. Also, DV scores Sandwell West Midlands Lab Lab 41.5
are based on elections that Wigan North West Lab Lab 38.6
took place in May 2019, not
the overall political Manchester North West Lab Lab 38.4
make-up of councils. In Tamworth West Midlands Con Con 37.6
some local authorities all
councillors were up for Salford North West Lab Lab 37.3
election but in others only South Tyneside North East Lab Lab 36.1
one-third were.
North Tyneside North East Lab Lab 36
Oldham North West Lab Lab 35.7
Chorley North West Lab Lab 34.1
Bracknell Forest South East Con Con 33.7
Leicester East Midlands Lab Lab 33.6
Broxbourne East of England Con Con 33.4
East Hertfordshire East of England Con Con 33.4
Gateshead North East Lab Lab 32.8
East Suffolk East of England Con Con 32.7
Portsmouth South East NOC NOC 32.5
Coventry West Midlands Lab Lab 32.1
Epping Forest East of England Con Con 31.8
Newcastle-upon-Tyne North East Lab Lab 30.9
Stevenage East of England Lab Lab 30.9
Exeter South West Lab Lab 30.7
Rochdale North West Lab Lab 30.6
Central Bedfordshire East of England Con Con 30
Wealden South East Con Con 29.8
South Lakeland North West LD LD 29.8
Electoral Reform Society 23Another way of highlighting the disproportionality
of the results are the number of votes, on average,
each party requires to get a councillor elected. This
data also shows how all parties suffer under FPTP,
in one region or another. The details for each
region of England where elections took place and
for England as a whole are provided in the
Appendix to this report.
A glance at some of the results highlights some
major discrepancies. For example, in the North
East it took 2,124 Conservative votes to elect a
Conservative councillor and only 1,327 Labour
votes. In the South East it took 2,357 Labour votes
to elect a councillor but only 1,325 Conservative
votes. While in the South West the Liberal
Democrats benefited, needing only 1,401 votes to
gain a councillor, whereas Labour needed 3,132
votes. Across the country as a whole, the Green
Party fared worse than the other parties. They
needed over 4,000 votes to elect a single
councillor, whereas the Conservatives, Labour and
Liberal Democrats required under 2,000.
Wrong winners
Another democratic anomaly in evidence at the
English local elections were the instances of ‘wrong
winners’. These are instances where the party that
got the most votes in a local authority did not get
the most councillors elected.
This is a localised example of something that has
happened on a national scale, in UK general
elections, under FPTP. In 1951, Labour won the
23. House of Commons most votes across the United Kingdom (48.8%)
Library Briefing Paper
(2019). UK Election Statistics: but the Conservatives won a majority of seats. In
1918-2019: A Century of February 1974, the Conservatives won most votes
Elections. https://
researchbriefings.files. (37.8%) but Labour won the most seats.23
parliament.uk/documents/
CBP-7529/CBP-7529.pdf
In the 2019 English local elections, there were 17
local authorities where the party getting the most
votes did not get the most councillors up for
24 Democracy Denied: The 2019 Election Auditelection (see Table 5). Again, it was not one
particular party that benefited, with multiple parties
benefitting and losing out across the country.
Table 5: Councils where Authority Party Votes Seats Party Votes Seats
parties winning most votes with (%) (%) with (%) (%)
did not win most councillors,
most most
English local elections 2019
votes seats
Arun Con 42.4 38.9 LD 30.2 40.7
Basildon Con 43.1 35.7 Lab 24.4 42.9
Bedford Con 31.3 27.5 LD 30.9 37.5
Blackpool Con 44.4 35.7 Lab 43.9 54.8
Brighton & Hove Green 36.4 35.2 Lab 34.6 37
Chelmsford Con 40.6 36.8 LD 39.9 54.4
Chester West & Con 39.2 40 Lab 36.7 50
Chester
Cotswold Con 42.5 41.2 LD 41.8 52.9
Gravesham Con 41.1 40.9 Lab 40.3 54.5
Kingston-upon-Hull LD 43 47.4 Lab 40.1 52.6
Lewes Green 27.9 22 Con 27.1 46.3
Portsmouth LD 27.8 40 Con 26.3 46.7
South Oxfordshire Con 34.9 27.8 LD 25 33.3
South Ribble Con 45 43.8 Lab 34.7 45.8
Southend-on-Sea Con 27 23.5 Lab 21.5 29.4
Stockton-on-Tees Con 33.2 25 Lab 32.6 42.9
Stoke-on-Trent Con 34.9 34.1 Lab 32.5 36.4
Electoral Reform Society 252 European Parliament
Election 2019
(Great Britain)
The 2019 European Parliament (EP) election was
not due to take place in the UK. The original date
for the UK’s exit from the European Union (EU)
was 29 March 2019, two years after the UK
triggered the Article 50 process of leaving the EU.
After extending the leaving date, the UK was
required to hold elections yet even following the
extension of the exit deadline, it was not until 7
May 2019 that the UK Government officially
confirmed that elections to the EP would take
place in the UK.24 The election took place just over
24. BBC News (2019). two weeks later, on 23 May, alongside elections in
Brexit: UK will take part in
European elections, says all other EU countries during the same week.
David Lidington. https:// Prior to 1999, the UK (apart from Northern
www.bbc.co.uk/news/
uk-politics-48188951 Ireland) used FPTP for EP elections. However,
from 1999 onwards it was specified that all EU
countries should use a proportional representation
25. House of Commons (PR) voting system, with the specific system to be
Library Briefing Paper
(2017). Voting systems in the decided by individual member countries. Despite
UK. https:// Northern Ireland having used STV for all previous
researchbriefings.files.
parliament.uk/documents/ EP elections, the decision was made that the rest
SN04458/SN04458.pdf
of the UK would use a different proportional
26. South West; South voting system, the Closed Party List system.25
East; London; Eastern;
Wales; East Midlands; West Under this system, Britain is split up into 11
Midlands; North West; relatively big regions.26 These areas each elect a
Yorkshire & Humber; North
East; Scotland certain number of MEPs, ranging from three in the
Electoral Reform Society 27North East to 10 in the South East, depending on
the size of the population in the region.
The specific form of Closed Party List PR used
is called the D’Hondt voting system. Each voter
has one vote, with which to mark an ‘X’ next to
one party or one independent candidate. MEPs are
then allocated within each region via the following
formula: in the first round of counting, the party
with the most votes wins a seat for the candidate at
the top of its list. In the second round, the winning
party’s vote is divided by two and whichever party
comes out on top in the re-ordered result wins a
seat for their top candidate. The process repeats
itself, with the original vote of the winning party in
each round being divided by one, plus their
running total of MEPs, until all the seats for the
region have been taken.27
27. BBC News (2019). 2019 While being a proportional representation
European elections: How
does the voting system system, the Closed Party List system has some
work? https://www.bbc.co. notable differences from STV. Firstly, a voter only
uk/news/uk-
politics-27187434 has one vote, rather than being able to rank their
preferences, as they can under STV. Secondly,
under the Closed Party List system, a voter cannot
indicate any preference between candidates from
the same party, as the order in which they are
elected has been decided before the election by
the parties themselves, which is why the system is
called a ‘closed list’. Under STV, voters are usually
able to indicate preferences between candidates
from the same party as well as between candidates
from different parties (something which is
elaborated on in the section on the Scottish local
elections). Both of these differences mean voters
have less power under the Closed Party List system
than they do under STV.
A third consequence of the Closed Party List
system is that it can cause uncertainty among
voters and make them question the most efficient
way to use their vote. In the build-up to the
28 Democracy Denied: The 2019 Election AuditEuropean Parliament election there was much
discussion, particularly among pro-EU inclined
voters, about how to use their one vote in a way
that would maximise the number of ‘Remain’-
inclined MEPs in a particular region. Such tactical
voting can be difficult to work out under this
system.28 This debate about tactical voting would
28. Brandenburg, Heinz have been far less relevant under STV, where
(2019). When a tactical vote
may not work: the complex voters have the reassurance of knowing that they
choice facing Remainers in can influence the election outcome with an
the EP elections. London
School of Economics unlimited number of preferential votes – not
https://blogs.lse.ac.uk/
brexit/2019/05/10/
having to place all of their eggs (or ‘X’s) in a single-
when-a-tactical-vote-may- vote basket.
not-work-the-complex-
choice-facing-remainers-
in-the-ep-elections/ Results
The outcome of the elections saw two parties with
clear positions on the question of Brexit come first
and second in terms of votes and MEPs. The
29. Brexit Party website. Brexit Party, with a policy of leaving the EU via a
https://www.thebrexitparty.
org/about ‘clean-break Brexit’29 gained nearly a third of votes
and just over two-fifths of MEPs, while the Liberal
30. Liberal Democrats Democrats, who advocated a policy of ‘stopping
website. https://www.
libdems.org.uk/brexit Brexit’30 came second, with just over one-fifth of
votes and MEPs. Labour and the Conservatives,
31. BBC News (2019). The who had adopted more nuanced approaches to
UK’s European elections
2019. https://www.bbc.co. Brexit and could perhaps be seen as divided on the
uk/news/topics/ issue, were third and fifth respectively, in terms of
crjeqkdevwvt/the-uks-
european-elections-2019 both votes and the number of MEPs.31
Electoral Reform Society 29Table 6: European Party Votes Votes Vote Seats Seat Seat
Parliament 2019 election (%) change share change
results (Great Britain)
since (%) since
2014 (%) 2014
Brexit Party 5,248,533 31.6 31.6 29 41.4 29
Lib Dem 3,367,284 20.3 13.4 16 22.9 15
Labour 2,347,255 14.1 -11.3 10 14.3 -10
Green 2,023,380 12.1 4.2 7 10 4
Conservative 1,512,147 9.1 -14.8 4 5.7 -15
SNP 594,553 3.6 1.1 3 4.3 1
Plaid Cymru 163,928 1 0.3 1 1.4 -
Change UK 571,846 3.4 3.4 0 0 -
Ukip 554,463 3.3 -24.2 0 0 -24
Others 264,780 1.5 -3.7 0 0 -
Total 16,648,169 100 70
Uncontested seats
Perhaps unsurprisingly, there were no uncontested
seats in the EP election in Britain. Voters in each
region were presented with a wide range of parties
and independent candidates competing for their
votes, with a mean average of 10 parties or
independent candidates standing per region. The
proportional nature of the voting system clearly
encouraged parties to think they had a reasonable
chance of achieving representation, even where it
was very unlikely they would top the poll in a
particular region.
Proportionality of results
As MEPs are elected to represent the nation at
the European Parliament, the key DV score is the
one for Britain as a whole, which was 13.7, lower
than the mean English local authority DV score
of 19.6 recorded for this year’s English local
elections. This reflects the fact that the Closed
List PR system produced a more proportional
result than FPTP did at the English local
authority level. However, it is worth noting that
the overall EP DV score masked some high DV
scores in particular regions.
30 Democracy Denied: The 2019 Election AuditA downside of the system used for EP elections
is that some regions elect only a small number of
MEPs and these regions tend to have much
higher DV scores, reflecting less proportional
results. For example, the North East has the
lowest number of MEPs (three) and the highest
(most unproportional) DV score (41.9). The South
East has the highest number of MEPs (10) and
the lowest (most proportional) DV score (10.9).
The differences in outcome are highlighted by the
fact that Labour were able to gain an MEP in the
South East with 7% of the votes in the region,
while the Liberal Democrats were unable to gain
an MEP in the North East, despite getting 17% of
the votes there.
Table 7: European Region MEPs DV Score
Parliament election 2019
(regional DV scores) North East 3 41.9
Wales 4 32.7
East Midlands 5 30.6
Scotland 6 21.8
South West 6 23.5
Yorkshire & Humber 6 18.7
East of England 7 16.6
West Midlands 7 13.1
London 8 18.6
North West 8 17.2
South East 10 10.9
Great Britain (overall) 70 13.7
Electoral Reform Society 313 Scottish Local
Elections 2017
The last set of Scottish local elections were held on
4 May 2017. This was the third time that the STV32
32. Electoral Reform system was used for local elections in Scotland and
Society briefing paper.
https://www.electoral- the first time that 16- and 17-year olds were able to
reform.org.uk/voting- vote in a local election. Thirty two councils and
systems/types-of-voting-
system/ 1,227 council seats were up for election.
single-transferable-vote/
The first Scottish local election held using STV,
in 2007, saw massive changes in how elections and
local democracy worked in Scotland. Voter choice
more than doubled, uncontested seats were
eliminated, and the councils where single parties
had ruled with virtually no opposition for decades,
33. Baston, Lewis (2007). became a thing of the past.33 The 2017 local elections
Local authority elections in
Scotland. London. Electoral largely saw a consolidation of these democratic
Reform Society. https:// improvements. Voter choice remained high,
www.electoral-reform.org.
uk/latest-news-and- increasing on 2012 levels and no council in Scotland
research/
publications/2007-scottish-
saw a single political party take majority control
local-elections/ without the support of the majority of voters.
Electoral Reform Society 33What is Single Transferable Vote (STV)?
The Single Transferable Vote (STV) is a form of proportional
representation which uses preferential voting in multi-member
constituencies.
Voters are invited to place the candidates on the ballot paper in order
of preference by placing a ‘1’ against the name of the candidate they
prefer most, a ‘2’ against the candidate who is their second preference,
etc. Voters are free to choose how many candidates they rank.
If a voter’s preferred candidate has no chance of being elected or has
enough votes already, that person’s vote is transferred to another
candidate in accordance with their instructions, minimising the number
of wasted votes.
STV ensures that very few votes are ignored, unlike other systems,
especially First Past the Post, where many votes make no contribution to
the result.
STV typically produces results that see power shared fairly across
different parties, creates greater competition for seats (as candidates
have a greater chance of success) and gives voters greater choice between
both parties and individual candidates.
STV encourages parties to stand candidates in
more areas, as the chances of achieving
representation are higher. There are no ‘no-go’
areas as there are under FPTP because candidates
do not need to top the poll in order to win a seat.
The number of candidates standing in 2017
increased slightly on 2012 levels. There were 2,572
candidates compared to 2,496 in 2012. These 2,572
candidates contested seats in 354 multi-member
wards giving voters on average a choice of 7.3
candidates. This is over double the choice
compared to 2003, when the elections were held
34. Curtice, John (2012). under FPTP and there was an average choice of 3.4
2012 Scottish Local
Government Elections. candidates.34 In 2007 there were 2,599 candidates
London. Electoral Reform contesting 353 multi-member wards (7.4 candidates
Society. https://www.
electoral-reform.org.uk/ on average).
latest-news-and-research/
publications/2012-scottish-
As a rule it is now unusual to see uncontested
local-elections/ seats in Scottish local elections. In 2017 there were
34 Democracy Denied: The 2019 Election Auditjust three uncontested wards where the number of
candidates standing was the same as the number of
seats available. The uncontested wards were on the
islands of Orkney and Shetland and on the Kintyre
peninsula. This was the first time that any wards
had been uncontested since the introduction of
STV for Scottish local elections.
Preferences
In 2012 there was an increase in the proportion of
voters expressing more than one preference.35 That
35. Curtice, John (2012). year 86% of ballot papers contained a second as
ibid
well as a first preference. In 2017, once again 86%
of voters gave more than one preference. Sixty-one
percent of voters cast three preferences and 29%
used four preferences. These figures are slightly
higher than in the previous election in 2012. In
other words, the vast majority of voters are using
36. Bochel, Hugh and the power that STV hands them.
Denver, David (2017). Report
on Scottish Council Elections
2017. Electoral Commission. Political control
https://www.
electoralcommission.org. For the first time, in 2017, no council saw a single
uk/sites/default/files/
pdf_file/2017-Scottish-
party take overall control with a majority of
Council-elections-Report. councillors.36
pdf
Table 8: Power sharing in Con Lab LD SNP Ind
Scottish councils, as at June
2017 (one month after local Majority control 0 0 0 0 3
elections) Minority administration 0 6 0 7 0
Coalition/power sharing 7 7 5 8 12
In June 2017, one month after the local elections,
the Conservatives were sharing power in seven
councils, with Labour also sharing power in seven
councils and governing as a minority in six. The
SNP were governing as a minority in seven
councils and sharing power in eight, while the
Liberal Democrats were sharing power in five
councils. Independent councillors were running
three councils and sharing power in 12.
Electoral Reform Society 35These results better reflect the diversity of
voters’ views compared to the English local
elections. No party was able to gain total control
of a council, while getting fewer than half the
votes, whereas this occurred in over two-fifths of
councils in England. In Scotland, parties are
required to share power and work together, in a
way that reflects how local voters have voted,
rather than dominating council chambers on a
minority of votes.
The data provides further evidence that Scottish
local election voters have a much higher chance of
seeing their votes count, than their English
counterparts do. In Scotland, in 2017, three-
quarters of voters (75%) saw their first preference
candidate elected. This is very similar to the 2007
Scottish local elections (74%) and 2012 Scottish
local elections (77%), both also held under STV. In
contrast, only 55% of votes in the 2019 English
local elections, held under FPTP, went to winning
candidates with all other votes being wasted. This
figure is similar to the 52% of voters who saw the
candidate they voted for elected in the last FPTP
Scottish local elections, held in 200337. The
37. Curtice, John (2012). benefits of STV stretch even beyond this
2012 Scottish Local
Government Elections. comparison, however, as Scottish voters are also
London. Electoral Reform able to have an influence on the outcome with
Society. https://www.
electoral-reform.org.uk/ their subsequent preferential votes, meaning that
latest-news-and-research/
publications/2012-scottish-
even if their first choice candidate is not elected,
local-elections/ they still have a chance of contributing to the
election of their second, third or subsequent
choice candidate.
Proportionality of results
Having produced DV scores for the 2017 Scottish
local elections, using first preference votes to
compare party vote shares with seat shares, it is
clear that STV enabled a more proportional
outcome than occurred in either the English local
36 Democracy Denied: The 2019 Election Auditelections, using FPTP or the European
Parliament election, using the D’Hondt method
of Closed List PR.
The mean DV score for individual local
authorities across Scotland was 9.7, half the
equivalent score for the English local elections
(19.6). This score provides clear evidence that STV
produces much fairer and more proportional
outcomes than FPTP.
The table below lists the Scottish local
authorities with the highest DV scores (or most
disproportionate outcomes). When compared to
the English councils with the highest DV scores, in
Table 4, it is clear that the Scottish councils have
far more proportional outcomes (the highest DV
score in Scotland is lower than the mean local
authority DV score across all English councils). In
sum, the councillors elected in Scotland much
more accurately reflect what voters want.
Table 9: Top 10 most Authority Previous Current DV Score
disproportionate results,
Scottish local elections 2017 Dundee SNP NOC 17.8
East NOC NOC 17.2
Dunbartonshire
Midlothian NOC NOC 16.4
North NOC NOC 13.1
Lanarkshire
Dumfries & NOC NOC 12.8
Galloway
Fife NOC NOC 12.8
East Lothian NOC NOC 12.3
Aberdeen NOC NOC 12.2
South Lab NOC 11.8
Lanarkshire
Glasgow Lab NOC 11.2
Electoral Reform Society 37Conclusion
Voters in England suffer clear disadvantage in
comparison to their Scottish counterparts when it
comes to their participation in local government
elections. FPTP causes many voters to be
disenfranchised through uncontested or under-
contested seats, while many more see their votes
wasted under a system that does not properly
reflect how people have voted.
The outcomes of the elections analysed in this
report provides clear evidence that it is time for
England (and Wales, where councils may soon have
the option of adopting STV)38 to join Scotland and
38. BBC News (2017). Northern Ireland in using STV for local elections.
Shake-up proposed for how
councillors are elected. On a range of democratic outcomes, STV
https://www.bbc.co.uk/ performs better than FPTP for local elections. The
news/uk-wales-
politics-38802658 scourge of uncontested seats has been virtually
eliminated in Scotland (and Northern Ireland);
one-party dominated councils have been ended in
Scotland too, meaning parties have to work
together to get things done locally; local
representation much more closely matches how
people actually voted; the link to a local electoral
area is retained; and voters are given maximum
choice (they can give as many preferences as they
want and are often able to choose who they prefer
between candidates representing the same party, as
well as choosing between parties).
38 Democracy Denied: The 2019 Election AuditThe renewed fragmentation of the British
electorate, as explored in the Introduction to this
report, makes a move towards a proportional
system for UK general elections even more
compelling too. Even though general election
opinion polls in summer 2019 have shown
something of an increase in the combined
Conservative and Labour vote share, none have
come close to matching even the lowest combined
Conservative and Labour general election vote
share for over a century (66.6%, across Britain, at
the 2010 general election).
It seems likely that the next general election, to be
held under FPTP, will see ‘random’ results on a scale
not seen before – with voters denied the opportunity
to express themselves in a way that a better voting
system would make possible. By using winner-takes-
all FPTP, Westminster is an anomaly among central
government legislatures throughout Europe. It is
increasingly becoming an anomaly within the UK,
too, with the Scottish, Welsh and Northern Irish
devolved parliaments using varying forms of mixed or
proportional voting systems, along with local
authorities in Scotland and Northern Ireland. The
vote-wasting machine of FPTP should be replaced at
long last – with a system that reflects how voters want
to be represented today.
Electoral Reform Society 39Appendix
Votes, councillors elected North Total votes Councillors % votes % seats Votes required
and votes required to elect a East elected to elect
councillor, by region and
councillor
overall, English local
elections 2019 Con 125314 59 21.6 17.6 2124
Green 36132 4 6.2 1.2 9033
‘Ind’ refers to Independents
and local groups such as Lab 209455 159 36.1 47.3 1317
Residents’ Associations. LD 64306 36 11.1 10.7 1786
Ind 93431 70 16.1 20.8 1335
‘Oth’ refers to other political Oth 50794 8 8.8 2.4 6349
parties that received fewer Total 579432 336 100 100 1725
than 5% of votes across the
country.
North Total votes Councillors % votes % seats Votes required
West elected to elect
councillor
Con 599679 341 29 30 1759
Green 161160 25 7.8 2.2 6446
Lab 802524 537 38.8 47.3 1494
LD 239618 101 11.6 8.9 2372
Ind 174341 124 8.4 10.9 1406
Oth 89681 8 4.3 0.7 11210
Total 2067003 1136 100 100 1820
Yorkshire Total votes Councillors % votes % seats Votes required
& Humber elected to elect
councillor
Con 392617 196 28.9 37 2003
Green 135348 15 10 2.8 9023
Lab 432023 166 31.8 31.3 2603
LD 206923 71 15.2 13.4 2914
Ind 106100 67 7.8 12.6 1584
Oth 87261 15 6.4 2.8 5817
Total 1360272 530 100 100 2567
40 Democracy Denied: The 2019 Election AuditYou can also read