Dense Forecasting of Wildfire Smoke Particulate Matter Using Sparsity Invariant Convolutional Neural Networks
←
→
Page content transcription
If your browser does not render page correctly, please read the page content below
Dense Forecasting of Wildfire Smoke Particulate
                                              Matter Using Sparsity Invariant Convolutional
                                                             Neural Networks

                                                                                    Renhao Wang
                                                                           Department of Computer Science
arXiv:2009.11362v1 [cs.CV] 23 Sep 2020

                                                                            University of British Columbia
                                                                                renhaow@cs.ubc.ca

                                                        Ashutosh Bhudia                            Brandon Dos Remedios
                                                      Department of Physics                         Department of Physics
                                                   University of British Columbia                University of British Columbia
                                                    ashu.bhudia@gmail.com                     dosremedios.brandon@gmail.com

                                                             Minnie Teng                                   Raymond Ng
                                                         Faculty of Medicine                      Department of Computer Science
                                                     University of British Columbia                University of British Columbia
                                                    minnie.teng@alumni.ubc.ca                            rng@cs.ubc.ca

                                                                                       Abstract

                                                  Accurate forecasts of fine particulate matter (P M2.5 ) from wildfire smoke are cru-
                                                  cial to safeguarding cardiopulmonary public health. Existing forecasting systems
                                                  are trained on sparse and inaccurate ground truths, and do not take sufficient advan-
                                                  tage of important spatial inductive biases. In this work, we present a convolutional
                                                  neural network which preserves sparsity invariance throughout, and leverages mul-
                                                  titask learning to perform dense forecasts of P M2.5 values. We demonstrate that
                                                  our model outperforms two existing smoke forecasting systems during the 2018
                                                  and 2019 wildfire season in British Columbia, Canada, predicting P M2.5 at a grid
                                                  resolution of 10 km, 24 hours in advance with high fidelity. Most interestingly, our
                                                  model also generalizes to meaningful smoke dispersion patterns despite training
                                                  with irregularly distributed ground truth P M2.5 values available in only < 0.5%
                                                  of grid cells.

                                         1   Introduction

                                         The relentless advance of climate change has precipitated a massive increase in wildfires all over
                                         the world. The 2018 wildfire season of British Columbia, Canada, the 2019-2020 Australia bushfire
                                         season and the ongoing California wildfire season have all seen unprecedented levels of destruction.
                                         While attention has primarily been drawn to the massive loss of life and property associated with
                                         these natural disasters, smoke from wildfires can have a more insidious and longitudinal effect. The
                                         aerosols within smoke pose serious risks to cardiopulmonary health, particularly for seniors, children
                                         and those with existing health conditions. Moreover, smoke from wildfires can be carried by winds to
                                         regions thousands of kilometers away from active fires, affecting those distant regions just as severely
                                         as nearby ones. Predicting the dispersion and impact of smoke from wildfires is therefore a task of
                                         eminent importance in public health.

                                         Preprint. Under review.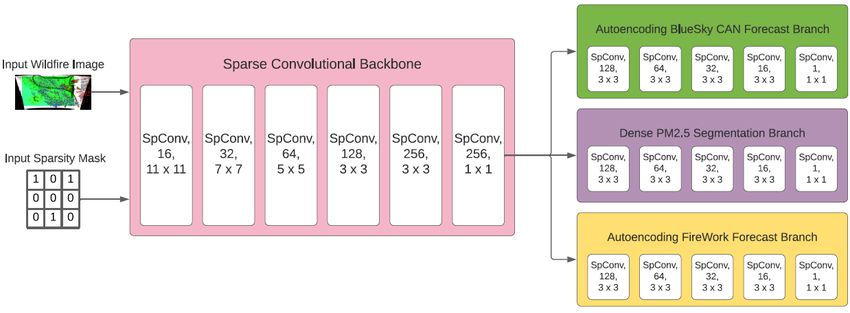
Smoke forecasting is often centered on predicting fine particular matter (less than 2.5 microns in
diameter, or P M2.5 ) over spatial grids, up to 60 hours in advance [5, 8]. Current forecasting systems
are a blend of varied physical and chemical transport models, as well as statistical models [5, 8].
However, a number of problems plague these statistical components. Firstly, due to sparsely located
air monitoring stations, ground truth P M2.5 values used in training these components are often
lacking, or filled in with mean P M2.5 values from the closest available measurements [8]. Secondly,
such statistical models do not preserve spatial inductive biases, often being based on general additive
models or other methods which flatten and thereby destroy the inherent spatial structure of the input
data [9, 13, 14].
Convolutional neural networks (CNNs) can clearly be employed to address the second issue, but still
suffer significantly from sparsity issues. This is the likely reason behind their general lack of use
in the wildfire smoke prediction domain. [6] circumvent this only by tackling a simpler pixel-level
binary classification on the presence of smoke or not.
Our contributions are 2-fold:

        1. We present the most comprehensive wildfire smoke data ingestion framework to date, which
           blends existing smoke forecasting system knowledge with predictive meteorological and
           wildfire variables, amalgamating varied spatiotemporal data into a format amenable to
           convolution-based learning.
        2. We propose a multiheaded convolutional neural network architecture which uses sparsity
           invariant layers and auxiliary autoencoding targets to overcome extreme sparsity of ground
           truth P M2.5 labels. We demonstrate the viability of this network by accurately and densely
           forecasting P M2.5 values for the 2018 and 2019 wildfire seasons in British Columbia,
           Canada, at a resolution of 10 km, and using input data available 24 hours in advance.

2     Method
2.1     Datasets

2.1.1    Forecasting Models
Various deterministic and statistical models for predicting P M2.5 exist [7, 9, 12, 14]. Inspired by
paradigms in residual learning [3], we incorporate these baseline forecasting models as inputs to our
convolutional model. The idea is to allow our network to leverage prior knowledge contained within
other models, such as influences of meteorological conditions, fire behavior evolution and smoke
dispersion mechanics. We then simply learn a function which models potential improvements to
these baselines in order to better attain the ground truth P M2.5 values. In particular, we incorporate
two prominent smoke particulate matter forecasting systems, FireWork and BlueSky Canada.
FireWork is an air quality prediction system that combines estimates from the Regional Air Quality
Deterministic Prediction System (RAQDPS) and wildfire emissions [8]. The latter are also estimated
from hotspot and fuel consumption data obtained by the Canadian Wildfire Information System [8].
The system is run twice daily, at 00 and 12 UTC, providing estimates of P M2.5 at a 10 km resolution
for every hour over the next 48 hours [8].
BlueSky Canada is a similar air quality modeling framework based off a system pioneered by the
U.S. Forest Service. BlueSky Canada offers hourly forecasts of P M2.5 concentrations from forest
fire up to 60 hours in advance at a 4 km resolution [5]. It contrasts most significantly from FireWork
in that contributions to P M2.5 from pollution sources outside of wildfires are not incorporated [5].

2.1.2    Meteorological Data
The U.S. National Aeronautics and Space Administration (NASA) maintains Moderate Resolution
Imaging Spectroradiometer (MODIS) instruments via their Terra and Aqua satellites, providing
various quantifications of atmospheric variables at semi-regular intervals [1]. Here, we are interested
in the Aerosol Optical Depth (AOD) metric, which is available roughly every 6 hours in a 24 hour
period. Wildfires generate a plethora of aerosol in dust, ash and smoke byproducts, which have a
measurable effect on AOD. Previous work has also shown that AOD is a meaningful proxy for P M2.5
[1].

                                                   2
(a) FireWork Forecasting (b) BlueSky Canada Forecasting
(c) MODIS FRP Active Fire Sites (d) NOAA Hand Drawn Smoke Plumes
Figure 1: A selection of our available datasets, defined over the same region of British Columbia, Canada.
Note that in Fig. 1c we detail the size of our 10 km × 10 km grid cell at the asterisk. These individual layers
are stacked together to compose a wildfire “image”, with channels representing spatial distributions of relevant
features for our P M2.5 predictive task.
We also include meteorological information from the NASA Modern Era Retrospective Analysis for
Research and Applications, Version 2 (MEERA-2) program. Similar to [13], we include eastward
and northward components of wind vectors 50m above the surface, and at the 250 hPa and 500 hPa
pressure levels, with a spatial resolution of 0.5◦ × 0.625◦ (latitude × longitude). These variables
have also held high predictive power in other wildfire smoke dispersion studies [9].
2.1.3 Wildfire Data
The MODIS instruments also provide data on fire locations and intensity. Intensities are approximated
by the fire radiative power (FRP) variable, and fire locations are specified by a weighted centroid
localization of FRP values in all 1-km × 1-km fire pixels (as determined by the active fire product).
While [13] transform FRP to extract additional predictive variables, we rely on the expressivity of
our highly non-linear network to learn potentially better features strictly from FRP.
Additionally, we include direct observations of smoke plumes from wildfires. The U.S. National
Oceanic and Atmospheric Administration (NOAA) maintains a Hazard Mapping System (HMS)
which dynamically assesses fire and smoke products. Analysts hand draw smoke plume boundaries
based on available data from various fire detection sources [10]. Due to the manual nature by which
this dataset is acquired, significant temporal and spatial gaps occur. Nonetheless, this is the only
component of our dataset which explicitly contains human confirmation of wildfire smoke behavior,
and we therefore include it when available as a potential regularizer for other data sources. We treat
the smoke plumes as a binary variable over a predefined grid; 0 indicating smoke is not present, and 1
indicating smoke is present.
2.1.4 Particulate Matter Ground Truth
For ground truth P M2.5 values, we use the 2018 and 2019 1-hour average P M2.5 measurements
from 56 air quality monitoring stations through British Columbia (courtesy of the British Columbia
Ministry of Environment and Climate Change Strategy).1 . We log transform the values as per [13] to
address its heavy right-skewed distribution.
1
Please refer to the supplementary material for a visualization of these stations within our grid of interest
32.2 Multidimensional Wildfire Composition Images
In order to amalgamate these varied data sources into a temporally and spatially consistent format
which can be consumed by our convolutional neural network, there needs to be a significant amount
of pre-processing done.
First, we define a regular, approximately square grid over the province of British Columbia, Canada,
with (latitude, longitude) corners at (57.87, -133.54), (47.31, -127.18), (60.61, -112.19), (49.43,
-110.61), and a grid resolution of 10-km × 10-km cells covering the roughly 1250-km × 1250-km
area. This will serve as an image-like canvas on which we can populate different pixels with the
requisite features.
Second, note that we seek to make predictions 24-hours in advance. We extract temporal and spatial
(latitude/longitude) labels for each element of each dataset. Then, for each time where we have P M2.5
ground truths, we project available datapoints from all datasets 24-hours prior to their corresponding
cells and channels within our defined grid. Cells and channels for unavailable measurements are
simply set to the closest available measurements from an earlier time, or to −1 when even those are
absent. We also do a similar projection for the 56 available P M2.5 ground truths.
The final result is a 125 × 125 × 9-dimensional input image for each timepoint of predictive interest,
and a corresponding sparse 125 × 125 × 1-dimensional output image of P M2.5 labels corresponding
to 24-hours thereafter. In total, we train on 4870, validate on 610 and test on 610 such input-output
pairs, randomly shuffled.
2.3 Model Architecture
While a standard fully convolutional neural network such as DenseNet or UNet can consume our
defined input and output the P M2.5 map of interest, problems of extreme sparsity remain [2, 4]. For
any particular prediction, we have at most 56 ground truth P M2.5 values in a grid of size 125 × 125.
We therefore robustify our convolutional neural network by introducing sparsity invariance into its
composite layers, and defining additional tasks which might offer dense learning signal.
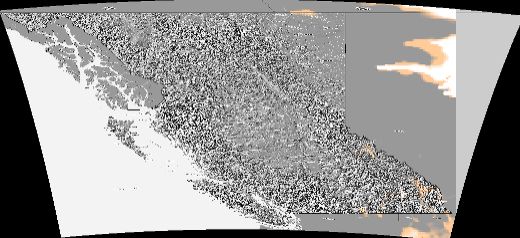
Figure 2: Multiheaded model architecture. Each SpConv layer involves a sparse convolution layer as described
in with the indicated kernel size and number of filters, with average pooling of the sparsity mask, followed
by a non-linear activation (ReLU throughout, except the final layer in the individual task branches, where no
activation is used.
2.3.1 Sparsity Invariant CNNs
Sparsity invariant CNNs were developed by [11] as a means to preserve sparsity constraints throughout
all layers of a convolutional neural network by explicitly accounting for a binary mask describing
the sparsity pattern. In particular, such a “sparse” convolution involves pooling only over observed
pixels of the image, and normalizing according to the mask. Here, our sparsity mask describes
the locations of the available ground truth P M2.5 values over the spatial grid. While [11] use max
pooling to downsample the binary mask after each sparse operation, we find that average pooling
leads to smoother inpainting of the resultant P M2.5 output map. We employ these sparsity invariant
layers in a core feature extraction backbone, as seen in Fig. 2.
42.3.2 Multitask Learning
In an effort to maximally use smaller datasets, it is often helpful to fuse information from training
signals of related tasks. The idea is that by sharing representations used for similar tasks, we can
enable the model as a whole to generalize more efficiently to such tasks, and crucially, to our ultimate
task of interest. This idea is known as multitask learning, or joint learning.
Here, the additional tasks we define are autoencoding ones; we define separate branches as in Fig. 2
which each output a 125 × 125 × 1 map, consistent with the P M2.5 forecasts of the FireWork and
BlueSky Canada models (recall that these are incorporated as part of the input). While our limited
corpus of highly localized wildfire data is one impetus for multitask learning, these autoencoding
heads reveal another: we hope to provide learning signal where ground truths are unavailable,
allowing the model to overcome extreme sparsity issues by borrowing from the learned dynamics
contained within the baseline forecasting models. Then our final model loss L is defined as:
L = γ1 ||If w − Iˆf w ||1 + γ2 ||Ibscan − Iˆbscan ||1 + γ3 ||Ipm25 − M Iˆpm25 ||1
where γ1,2,3 are hyperparameters, I is the target map, Iˆ is the predicted map from the corresponding
branch, with subscripts f w, bscan, pm25 denoting the FireWork baseline, BlueSky Canada baseline
and P M2.5 ground truths, respectively. M denotes the binary mask demarcating the sparsity pattern
of the P M2.5 ground truths.
3 Results and Discussion
Given the geographical and temporal specificity of our approach, as well as the collective range of
datasets used, there are no statistical models which offer direct comparisons. We therefore assess
performance of our model by comparing model P M2.5 predictions with FireWork and BlueSky
Canada P M2.5 predictions at the 56 air monitoring stations over timepoints within the defined test
set. We then also look at heatmaps of model predictions to ascertain whether or not meaningful
interpolations are made in regions where ground truths are not available.
Table 1: We report average L1 error for our model and available baselines for early, mid and late
temporal subsets of the test set. Lower is better, bolded is best.
Mean Absolute Error (µg/m3 )
Early Mid Late
(Apr + May) (Jun + Jul + Aug) (Sep + Oct)
FIREWORK 10.08 23.39 17.52
BLUESKY CANADA 22.34 75.73 44.10
OUR MODEL 2.26 14.21 6.79
Table 1 details our model performance against the described baselines. Because P M2.5 values can be
dramatically higher during the peak of the fire season in July and August, we separate this assessment
for different sets of months. In particular, we demarcate the early, mid and late fire seasons as April to
May, June to August, and September to October, respectively. Note that we outperform both FireWork
and BlueSky Canada at all points in the fire season, validating our residual learning approach and
verifying that additional raw data is semantically useful for our model in improving the baseline
predictions.
In Fig. 3, we show model predictions over the entire defined grid. Each pixel within each heatmap
represents a 100 km2 area, and the heatmap resolution is 125 × 125 pixels. Firstly, note that we
accurately capture highs and lows of P M2.5 in correspondence with the fire season (beginning in
April, peaking in July and August, and ending in October). Secondly, we see that despite lacking
ground truth P M2.5 values in between air monitoring stations, our model is able to interpolate P M2.5
meaningfully, representing complex and diverse P M2.5 falloff patterns and interactions between
smoke dispersion from various fires. More work clearly needs to be done to verify these implied
dynamics, and we leave this for the future. 2
2
Please refer to the supplementary material for additional prediction frames.
5Figure 3: Predictions made using available data 24 hours in advance. We note the smooth inpainting of P M2.5
values despite lacking ground truths on nearly 99.7% of the image. In future work we verify the implicit smoke
dynamics within these predictions.
4 Conclusion
In this work, we tackle the challenging but important task of forecasting the public health burden
of smoke particulate matter perpetuated by wildfires. By incorporating baseline forecasting models
and raw meteorological and wildfire data variables from satellite measuring systems, we are able to
design an input data format which preserves spatial relationships. We then overcome sparsity issues
plaguing more traditional statistical modeling frameworks by introducing sparsity invariant layers,
and defining auxiliary tasks that provide guiding intermediate learning signal to the network. We
demonstrate strong results on real world wildfires as compared to forecasting systems currently in
use. Future work will ascertain that our method is generalizable outside British Columbia, Canada,
and that the smoke particulate matter behaviors modeled by our network are consistent with domain
expectations.
Acknowledgments and Disclosure of Funding
We would like to thank the British Columbia Centre for Disease Control (BCCDC) for their invaluable
support in acquiring and cleaning datasets, and their direction to previous relevant work. In particular,
Dr. Sarah Henderson and her team, Kathleen McLean, Naman Paul and Angela Yao were instrumental
in identifying predictive variables for our requisite tasks. We would also like to acknowledge the
University of British Columbia Data Science Institute (DSI) and its partners; RW, AB, BDR and MT
were all supported by DSI’s Data Science for Social Good (DSSG) program during the tenure of this
work, with compute credits provided by Microsoft. Finally, we would like to thank the support of the
Canadian Institute for Advanced Research (CIFAR).
References
[1] A Chudnovsky, A Lyapustin, Y Wang, C Tang, J Schwartz, and P Koutrakis. High resolution
aerosol data from modis satellite for urban air quality studies. Open Geosciences, 6(1):17–26,
2014.
6[2] Michal Drozdzal, Eugene Vorontsov, Gabriel Chartrand, Samuel Kadoury, and Chris Pal. The
importance of skip connections in biomedical image segmentation. In Deep Learning and Data
Labeling for Medical Applications, pages 179–187. Springer, 2016.
[3] Kaiming He, Xiangyu Zhang, Shaoqing Ren, and Jian Sun. Deep residual learning for image
recognition. In Proceedings of the IEEE conference on computer vision and pattern recognition,
pages 770–778, 2016.
[4] Forrest Iandola, Matt Moskewicz, Sergey Karayev, Ross Girshick, Trevor Darrell, and Kurt
Keutzer. Densenet: Implementing efficient convnet descriptor pyramids. arXiv preprint
arXiv:1404.1869, 2014.
[5] Narasimhan K Larkin, Susan M O’Neill, Robert Solomon, Sean Raffuse, Tara Strand, Dana C
Sullivan, Candace Krull, Miriam Rorig, Janice Peterson, and Sue A Ferguson. The bluesky
smoke modeling framework. International Journal of Wildland Fire, 18(8):906–920, 2010.
[6] Alexandra Larsen, Ivan Hanigan, Brian J Reich, Yi Qin, Martin Cope, Geoffrey Morgan, and
Ana G Rappold. A deep learning approach to identify smoke plumes in satellite imagery in
near-real time for health risk communication. Journal of Exposure Science & Environmental
Epidemiology, pages 1–7, 2020.
[7] William Lassman. Blending model output with satellite-based and in-situ observations to
produce high-resolution estimates of population exposure to wildfire smoke. 2000-2019-CSU
Theses and Dissertations, 2016.
[8] Radenko Pavlovic, Jack Chen, Kerry Anderson, Michael D Moran, Paul-André Beaulieu, Didier
Davignon, and Sophie Cousineau. The firework air quality forecast system with near-real-time
biomass burning emissions: Recent developments and evaluation of performance for the 2015
north american wildfire season. Journal of the Air & Waste Management Association, 66(9):
819–841, 2016.
[9] Colleen E Reid, Michael Jerrett, Maya L Petersen, Gabriele G Pfister, Philip E Morefield, Ira B
Tager, Sean M Raffuse, and John R Balmes. Spatiotemporal prediction of fine particulate matter
during the 2008 northern california wildfires using machine learning. Environmental science &
technology, 49(6):3887–3896, 2015.
[10] AF Stein, Roland R Draxler, Glenn D Rolph, Barbara JB Stunder, MD Cohen, and Fong Ngan.
Noaa’s hysplit atmospheric transport and dispersion modeling system. Bulletin of the American
Meteorological Society, 96(12):2059–2077, 2015.
[11] Jonas Uhrig, Nick Schneider, Lukas Schneider, Uwe Franke, Thomas Brox, and Andreas Geiger.
Sparsity invariant cnns. In 2017 international conference on 3D Vision (3DV), pages 11–20.
IEEE, 2017.
[12] Qingyang Xiao, Howard H Chang, Guannan Geng, and Yang Liu. An ensemble machine-
learning model to predict historical pm2. 5 concentrations in china from satellite data. Environ-
mental science & technology, 52(22):13260–13269, 2018.
[13] Jiayun Yao, Michael Brauer, Sean Raffuse, and Sarah B Henderson. Machine learning approach
to estimate hourly exposure to fine particulate matter for urban, rural, and remote populations
during wildfire seasons. Environmental science & technology, 52(22):13239–13249, 2018.
[14] Yufei Zou, Susan M O’Neill, Narasimhan K Larkin, Ernesto C Alvarado, Robert Solomon,
Clifford Mass, Yang Liu, M Talat Odman, and Huizhong Shen. Machine learning-based
integration of high-resolution wildfire smoke simulations and observations for regional health
impact assessment. International journal of environmental research and public health, 16(12):
2137, 2019.
7You can also read