Design and Development of a Low Cost Pulse Oximeter
←
→
Page content transcription
If your browser does not render page correctly, please read the page content below

Journal of Physics: Conference Series

PAPER • OPEN ACCESS

Design and Development of a Low Cost Pulse Oximeter
To cite this article: Zain Hassan Naeem et al 2021 J. Phys.: Conf. Ser. 1793 012068

View the article online for updates and enhancements.

                               This content was downloaded from IP address 46.4.80.155 on 20/09/2021 at 06:04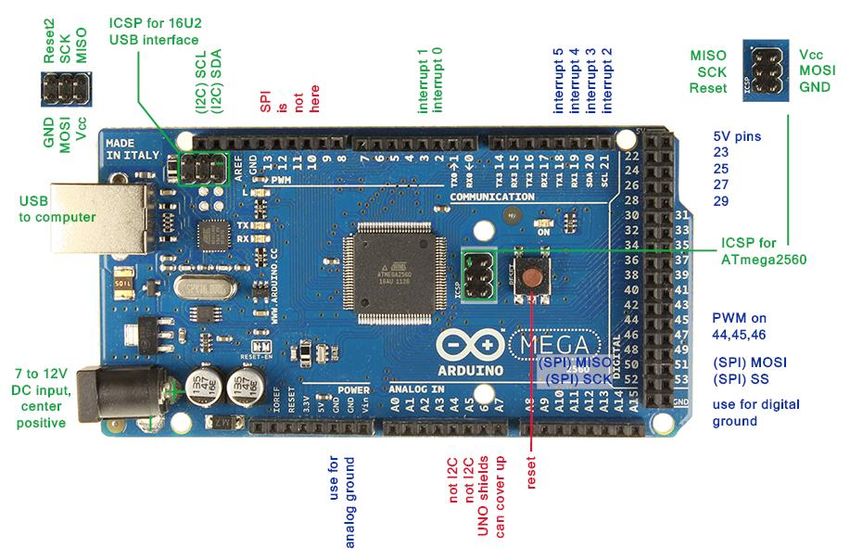
IRTTEC 2020                                                                                                     IOP Publishing
Journal of Physics: Conference Series                         1793 (2021) 012068          doi:10.1088/1742-6596/1793/1/012068

Design and Development of a Low Cost Pulse Oximeter

                     Zain Hassan Naeem1, Mansour Youseffi1, Farshid Sefat1, Seyed Ali Khaghani1,
                     Tehmeena Israr Raja1, Arif Patel2, Farideh Javid3, Muhammad Mahadi Abdul
                     Jamil4, Mohd Helmy Abd Wahab4
                     1
                     Faculty of Engineering and Informatics, Biomedical and Electronics Engineering
                     Department, University of Bradford, United Kingdom
                     2
                     EBME Department at East Lancashire Hospitals NHS Trust, Royal Blackburn
                     Teaching Hospital, Blackburn, Lancashire, United Kingdom
                     3
                     Pharmacy, School of Applied Sciences, University of Huddersfield, Queensgate,
                     Huddersfield, United Kingdom
                     4
                     Department of Electronic Engineering, Faculty of Electrical and Electronic
                     Engineering, Universiti Tun Hussein Onn Malaysia (UTHM), Johore, MALAYSIA

                     *Corresponding author: mahadi@uthm.edu.my

                     Abstract. There are various types of pulse oximeters (POs) including ‘reflectance POs’, which
                     can be used on more sites like the forehead, chest or cheeks and work the same way as
                     ‘transmission POs’ which is the most commonly used device for the continuous measurement
                     of % blood oxygen saturation and pulse/heart rate. This paper describe the design and
                     development of a low cost pulse oximeter (PO) specifically focused on the use of ‘Reflectance
                     Photo-Plethysmo-Graphy’ (RPPG) technology, and compare with commonly used pulse
                     oximeter devices at the East Lancashire Hospitals. The design arrangement involved the use of
                     an Arduino Mega 2560 Circuit Board as microcontroller, Pulse Sensor, Light Emitting Diodes
                     (LEDs) and Liquid Crystal Display (LCD), which allowed subsidising to make a functional
                     device for accurate readings of Heart Rate (HR) in beats per minute (BPM) and % Blood
                     Oxygen Saturation (SpO2). RPPG technique was successfully implemented within the design
                     and development of the PO prototype, contrasting against the more conventional method of
                     transmission pulse oximetry for obtaining HR and SpO2 values. It is concluded that the RPPG
                     pulse oximeter is a more cost effective method of operation with comparable results.

1. Introduction
Photo-Plethysmo-Graphy (PPG) is the most commonly implemented technique in pulse oximeter
devices which are one of the most commonly used diagnostic devices within the healthcare sector. The
required hardware for this device mainly consists of two instruments: (1) A Light Emitter Diode
(LED), and (2) A semiconductor photodiode detector. The LED light is used to pass through the layers
of the skin (epidermis and dermis) to illuminate the blood. The wavelength of the light being emitted
is normally in the range 550-1100nm. The photodiode then detects the voltage signals being

              Content from this work may be used under the terms of the Creative Commons Attribution 3.0 licence. Any further distribution
              of this work must maintain attribution to the author(s) and the title of the work, journal citation and DOI.
Published under licence by IOP Publishing Ltd                          1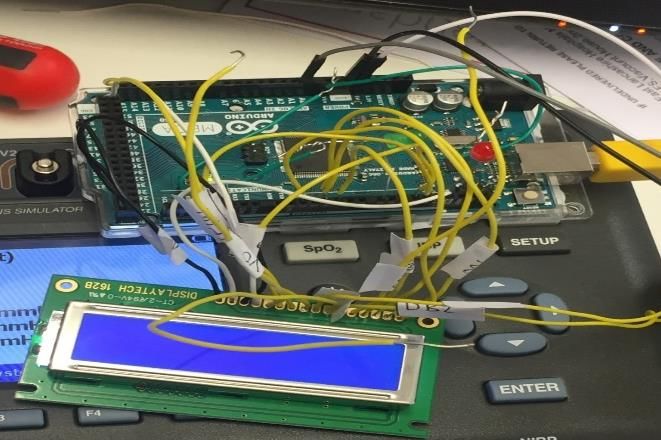
IRTTEC 2020                                                                               IOP Publishing
Journal of Physics: Conference Series          1793 (2021) 012068   doi:10.1088/1742-6596/1793/1/012068

transmitted and measures the changes of coefficient of light absorbed in arterial blood flow. Blood
volume in the blood vessels and voltage signal collected by the photodiode are proportional. Light
being received by the photodiode differs upon the volume of blood, the lower the intensity of the light
the higher the volume of blood being present.
           Light source emits light through the finger inside the pulse oximeter probe and reaches a
light detector. In transmittance pulse oximeters, the detector is placed perpendicularly opposite the
light source. The light needs to be absorbed by the hemoglobin in the finger to give an oxygen
saturation value.
           Real time monitoring of non-invasive SpO2 (% blood oxygen saturation) is one of the most
important medical breakthroughs in recent history. It allows clinicians to reliably and accurately
measure SpO2 and diagnose illnesses such as hypoxemia at an early stage. This has led a positive
impact on reducing the incidents of hypoxemia from a factor of 1.5 to 3 as compared to patients who
were not on pulse oximeter monitoring devices (Tusman, Gerardo., Bohm, Stephan., Suarez-Sipmann,
Fernando, 2016). It is also one of the standard methods of monitoring for patients on critical care and
on ventilation.
           Continuous monitoring of blood oxygen saturation levels has become increasingly vital in
the health service as it can present to clinicians an indication to whether the lungs are functioning
properly. Oxygen is carried into the lungs via breathing, where gas exchange occurs to oxygenate the
blood. The oxygenated blood is then pumped to all cells/tissues in the human body. Oxygen saturation
levels can also be used to determine if the heart is functioning in a healthy manner, since low SpO2
levels can indicate cardiac malfunction (Taylor, 2013).
           A pulse oximeter, therefore, gives readings for the heart rate (HR) in BPM as well as the %
blood oxygen saturation value (SpO2) representing the amount of saturated blood oxygen carrying
haemoglobin within our blood vessels against the total amount of haemoglobin.
           A transmittance pulse oximeter probe is attached to the index finger or the ear lobe to detect
SpO2 and HR readings. The device works by determining how much light has been absorbed by the
haemoglobin in blood and then creates a ratio as a percentage value. The ratio is between
deoxygenated and oxygenated haemoglobin (Taylor, 2013).
           Normal values of SpO2 are dependent on the age, ethnicity and health of an individual,
however a value of 95-99% is considered as normal for a healthy individual. There are cases of
oxygen intoxication where the SpO2 values are at 100% which only occurs in hospitals where the
patient is on continuous supply of oxygen due to special therapy. Pulmonary toxicity is a common
affect if the patient is exposed to an excessive supply of oxygen and can affect the central nervous
system (Graves, 2011). Lower levels of oxygen can also be very fatal as organs can become deprived
of oxygen when values are below 90%. Hypoxemia is a common cause when the tissues and cells of
the human body are deprived of oxygen.
           The normal HR values for a healthy adult is between 60-100 BPM and for children is at 70-
100 BPM. An athlete can be seen to have a very low resting heart rate which will be between 40-80
BPM (Mayo Clinic, 2015). Slow pulse rate can be an indication of a condition called Bradycardia. A
faster pulse rate can be an indication of Tachycardia which causes the heart to pump faster than it
should be mainly due to smoking, stress and the side effects from various medicines and alcohol abuse
(WebMD, 2016).
           The aim of this paper was to design and development of a low cost pulse oximeter prototype
which can be compared to current devices at the East Lancashire Teaching Hospitals. The main
objectives, therefore, included manufacturing of the PO prototype based on ‘Reflectance Photo-
Plethysmo-Graphy Technology’ and to test the functionality of the prototype by comparing with a
standard transmittance pulse oximeter device used within the National Health Service (NHS) and
finally to determine the accuracy of the prototype as compared to those used by the NHS.

2. Materials and Methods

                                                    2
IRTTEC 2020                                                                                IOP Publishing
Journal of Physics: Conference Series          1793 (2021) 012068    doi:10.1088/1742-6596/1793/1/012068

2.1 Pulse sensor
One of the most essential component is the pulse sensor. The sensor used is an open source hardware
component which is able to provide outputs that correlate with the rhythm of the heart. Noise
elimination/reduction circuitry is part of the sensor which allows the user to have accurate and reliable
data. The noise cancellation circuitry is attached to the rear of the pulse sensor. Due to the sensor
consuming low power, it offers protection from signal loss. Change in voltage is represented as a raw
signal and this is converted and represented as a value of ‘heart rate’. With the use of a microcontroller
(Arduino Board) we are able to display the values onto the LCD screen. Table 1 gives the specification
for the pulse sensor.

Table 1. Pulse Sensor Specification.
                         Diameter of sensor              0.635’’
                     Thickness of the sensor             0.125”
                   Range of pulse detection              0 to 250 BPM
                    Voltage output required              3V to 5V
      Current Consumption from pulse sensor              4mA
                         Data Logger Type                Digital Input

Table 2 is the configuration from the pulse sensor to the Arduino circuit board.

Table 2. Configuration from Pulse Sensor to Arduino Board
              Pulse Sensor Pinout                      Arduino Board Connection Point
                       -                                      GND (Ground)
                       +                                            5V
                       S                                   A0 (Analog Pin Zero)

The sensor is made up of two components of which one is the surface mount for the light emitting
diode (LED). The LED is used to emit light at a wavelength of 609nm. The LED is emitted through a
hole approximately 2mm in diameter. The detector which is a photo sensor is used to detect the light
that has been emitted with a magnification of up to 330. Due to the sensor being of reflectance
technology the LED and the photo detector are on the same side of the probe. The main advantage of
having the LED and photo detector on the same side is that it can block ambient lighting which allows
more accurate results due to less interference/noise. Figures 1 and 2 show the pulse sensor images and
its schematic drawings, respectively (Instructables, 2016). The sensor could be used at either 3V or 5V
(used in this work).

                Figure 1. Pulse sensor Front and Back images (Instructables, 2016).

                                                     3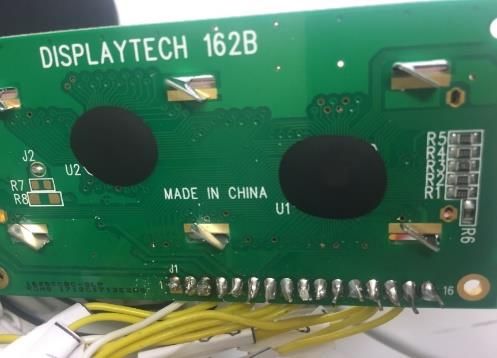
IRTTEC 2020                                                                             IOP Publishing
Journal of Physics: Conference Series        1793 (2021) 012068   doi:10.1088/1742-6596/1793/1/012068

                Figure 2. Schematic drawing of the pulse sensor (Instructables, 2016)

2.2 Hardware Components used in the pulse oximeter prototype

2.2.1 Arduino Board
The microprocessor used is known as the Arduino board which is capable of receiving signals from
the pulse sensor and then processing them into a digital output. The version used for this project was
the Arduino Mega 2560. This board is advantageous over the other microcontrollers since it has both
the USB connection and DC power jack so as it can be powered via an AC or DC adapter which is
connected to the Power Jack hole (2.1mm centre positive plug). An external power supply of between
6V-20V can be used, but there is an advisory with the board that anything over 12V may overheat and
damage the board.
The Power pin outputs are as follows:

VIN – This is where the external power source can be connected.
5V – A regulated power supply of 5V is to be connected via this pin terminal.
GND – This is the where the ground pins are connected.

The Arduino Mega2560 microcontroller has a large flash memory of 256 KB, which allows more than
enough memory to store the code onto it. Before being used the Arduino needs to be coded which can
be done with Arduino Integrated Development Environment (IDE). This can be either downloaded
onto a computer or accessed via the internet. The bootloader allows the user the ability to upload the
written code and amend it whenever necessary. The Arduino board is designed so that it can
communicate with various other devices that are compatible with the board, i.e. computer (USB
wired) and phone (using the Bluetooth port) (RS, 2017).
          The Arduino board has 54 Input/output pins and this can be seen on the schematic that is
provided below in Figure 3. Some of the pins had a specialised role and can only be used for certain
functions.

                                                   4
IRTTEC 2020 IOP Publishing
Journal of Physics: Conference Series 1793 (2021) 012068 doi:10.1088/1742-6596/1793/1/012068
Figure 3. Arduino Mega2560 showing the Pins in detail (RS, 2017)
Pins 0 and 1: RX is used to receive serial data whereas TX is used to transmit the serial data
that is provided.
Pins 2 and 3: These pins are used for external interrupts to trigger low trigger values and also
recognise abnormalities in the values. However, this can only be configured if the board has
been told to do so via the code.
Pins 3 to 11: These pins are able to provide an 8-Bit output when used via the analogWrite()
function in the software.
Pin 13: The LED is connected to the digital pin 13 which at HIGH value is on and when there
is LOW value it turns off.
The Arduino Mega2560 also consists of 16 analogue inputs, which all provide 10 bits of resolution.
By default it required to measure 5V, although it is possible to alter the upper end of the range using
the AREF pin and analogReference() functions in Arduino IDE software. There are also pins that have
specialised functions.
AREF: used as the reference voltage for the analogue inputs and is used alongside the
analogReference() function.
RESET: This pin is used to reset the Mega2560 Board (RS, 2017).
2.2.2 LCD Display
One LCD display (Displaytech) was used in this project which was designed to be used in
accordance with the Arduino Board. It has 16 interface pin connections which will be connected to the
Arduino Board and then via the coding will display the results. The display is designed so that every
pixel in the display is emitting its own light, therefore manual adjustments is not possible. Due to the
trans-reflective display, it offers a greater contrast in varied light conditions allowing to be used in
both indoors and outdoors. The display will function at temperatures of -10°C up to 60°C. The
external dimensions of the LCD are 98 x 11 x 60mm (RS, 2017).
5
IRTTEC 2020                                                                                IOP Publishing
Journal of Physics: Conference Series          1793 (2021) 012068    doi:10.1088/1742-6596/1793/1/012068

2.2..3 10K Potentiometer
          A potentiometer has the ability to have its resistance adjusted manually. We can increase or
decrease the resistance, which ultimately controls the amount of current flowing into the circuit. A
common example of a potentiometer being used is the volume knob in music systems.
          The potentiometer used in this project was purchased from RS. It has cross-slot adjustment
allowing the resistance to be adjusted very easily. It also has similar operating temperature as the other
components used in this project at -25°C to +100°C. Figure 4 shows the 10K potentiometer used in
this project.

                                Figure 4. 10K Potentiometer (RS, 2017)

2.2.4 Light emitting diodes (LEDs)
          In 1851, the ‘Beer Lambert law’ was introduced (Moyle, 2002). It stated that different
substances will absorb light of different wavelengths. This property allows for detecting what the
substance is with detailed application of the Beer Lambert law in spectrometry (Clark, 2016). To be
noted is the fact that oxygenated haemoglobin and deoxygenated haemoglobin absorb light of different
wavelengths, therefore, the pulse oximeter uses two light sources, i.e. a red light which has a
wavelength of 650nm and an infrared light which has a wavelength of 950nm. Oxyhaemoglobin
absorbs infrared light and deoxy-haemoglobin absorbs red light. The pulse oximeter calculates a ratio
of red and infrared lights for comparison and this enables oxygen saturation to be worked out. Note
that LED is a semiconductor device that emits light when current is applied to it. An example of the
red LED light used in this work is shown in Figure 5.

                          Figure 5. Red light emitting diode/LED (RS, 2017)

2.2.5 Power Supply
          Power supply is one of the most important factors for such devices. It is essential that the
circuit has the correct power supply so that all the components can function to the best of their ability.
Two sources of power supply were available with the main source coming from the PC and the second
source was AAA Duracell Batteries. AAA Duracell batteries are designed specifically to last longer
and provide 1.5V.

2.3 Code fragment and Software used for the pulse oximeter prototype
          In order to use the components mentioned above, proper coding is necessary which is done
with the use of the Arduino IDE Software. The IDE software is provided for free after purchasing the

                                                     6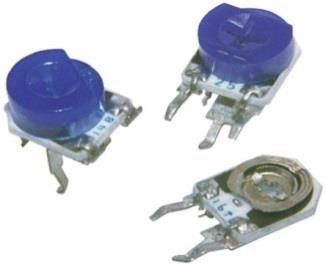
IRTTEC 2020                                                                                  IOP Publishing
Journal of Physics: Conference Series             1793 (2021) 012068   doi:10.1088/1742-6596/1793/1/012068

Arduino board. The easy access to the software ensured multiple locations to be used while coding and
the software was used in accordance with Arduino Board, Sensor and Display.

2.3.1 Fragment code for Sensor to Arduino Mega2560
          The first part of the code is initialize the function ‘Void Setup’. This function is used to
inform the Arduino to perform a specific task and what variables, pin modes and sketches are going to
be used. The code that is used as the setup is only used once by the Arduino board when it is being
powered up. ‘PinMode’ function is to detect the pin as either an output or input. Symbols such as
opened and closed brackets, parentheses and braces are used to help to identify different
functions/expressions as well as start and end.
          The set up rate at which the microcontroller and the software were used was set at a rate of
115200 bits per second or baud.

                                        Code 1. Initialization function

           Variable function as in Code 2 is used to define the data that is being collected from a
source. It is also used to process and store the data. The data used in this section of the code can be
changed, however, the variable itself stays the same. Below you can see the coding used alongside this
function.
           The raw signal that is being received form the pulse sensor is stored at pin 0. The data that is
received is recorded in BPM. The ‘’volatile int IBI’’ function sets the interval of time between each
heartbeat and ‘’volatile boolean’’ function is responsible for identifying the authenticity of the
heartbeat. Pin 13 is used to blink the LED each time an authentic heartbeat is found. The LED is coded
so that it beats in synchronisation to each heartbeat found.

                                        Code 2. Variables assignment

The loop function (Code 3) is needed to be used as the main function of the pulse oximeter to
continuously find readings of pulse rate. Loop function repeatedly executes the code from start to end
until the device is turned off. The QS value only becomes true when there has been a pulse rate
located. After sending an output to the Arduino it then restarts the cycle again. The fade rate in the

                                                       7
IRTTEC 2020 IOP Publishing
Journal of Physics: Conference Series 1793 (2021) 012068 doi:10.1088/1742-6596/1793/1/012068
code is used to determine the LED and how quickly it fades when the heart rate is located. There is a
20ms delay at the end before the cycle starts again. This is so that it gives time for any changes in
heart rate to be found accurately.
Code 3. Loop function
2.3.2 Code for LCD display
It is very important to download the libraries needed in order for the display to work
accordingly (Code 4). Libraries in Arduino IDE Software are referred to as a collection of codes,
which are uploaded and used with the software to ensure the usage of the LCD display. Libraries were
downloaded from Instructables, which is an online website with instructions on how to use the
Arduino board.
Code 4. LCD display function
The code (Code 5) shows the baud rate and the text size used in accordance with display. The text size
used was 2.3 which is the correct size for the LCD display.
8IRTTEC 2020 IOP Publishing
Journal of Physics: Conference Series 1793 (2021) 012068 doi:10.1088/1742-6596/1793/1/012068
Code 5. Display baud rate
2.3.3 Interrupt Code in Arduino IDE software
An interrupt code (Code 6) is used in programming to allow a task to run in the background while
other tasks are being carried out. The code makes the board have one task running and then comes
back to it upon completion of another task. These types of codes are used to tune the timing of a
particular code.
Code 6. Interrupt function
Interbeat Interval (IBI) (Code 7) is used in the code and refers to each interval between heartbeats.
Due to the value altering between heartbeats it was very important to include this. IBI function in
Arduino IDE software commands the programme to store the last 10 readings.
Code 7. Interrupt setup function
The small code above is in place to ensure the amplitude of the waveform is recognised at 100. The
code causes an interrupt every 2ms. It also causes the pulse width modulation to be disabled at pins D3
and D11.
Code 8. Amplitude of the waveform
9IRTTEC 2020 IOP Publishing
Journal of Physics: Conference Series 1793 (2021) 012068 doi:10.1088/1742-6596/1793/1/012068
The above code shows the timer2 code. When the counter in the code reaches 124 per 500Hz sample
rate it is told to be triggered to work. Once triggered the code is used to disable everything for a brief
moment so that the pulse sensor can collect a reading. This whole process takes place in 2ms.
Code 9. Highest and lowest points of the P and T
This is the final part of the code. It is used to track the highest and lowest points of the P and T signals
being received. N value in the code is used to avoid the district notch and other noises. It is also the
part of the code that is used to analyse the next pulse that is occurring.
The coding used was mostly provided by the website called instructables, however, huge
amounts of the code have been changed in this work so as to meet the objectives (Instructables, 2016).
3. Constructing the Circuit and Testing - Connecting all the parts together
After purchasing all the components to complete this work, construction of the prototype took place.
The first part of the project was to connect the Arduino to the laptop just to see if the Arduino board
was being recognised by the laptop. After this was completed, the next step was to solder wires to the
display to be connected to the Arduino board as shown in Figure 6 below.
Figure 6. Image showing soldering connection on LCD display.
After the soldering was taken place, all the connections were made to the Arduino Board; this included
connecting the pulse sensor, potentiometer and LED as shown in Figure 7 below.
10IRTTEC 2020 IOP Publishing
Journal of Physics: Conference Series 1793 (2021) 012068 doi:10.1088/1742-6596/1793/1/012068
Figure 7. Image showing schematic of all the connections made in this work (Instructables,
2016).
Tables 3 and 4 show the connections that had to be made between the components.
Table 3. LCD connections to Arduino Board.
LCD Arduino Board
VSS +5V
VDD GND (Ground)
RS 12
RW GND (Ground)
E D11
D4 D5
D5 D4
D6 D3
D7 D2
A/VSS +5V
K/VDD GND (Ground)
Table 4. Pulse Sensor connections to the Arduino Board
Pulse Sensor Arduino Board
+ +5V
- GND (Ground)
S A0
Table 5. 10K Potentiometer connections to LCD
10K Potentiometer LCD
GND (Ground) GND (Ground)
Data V0
VCC +5V
Table 6. LED connections to Arduino Board
LED 1 (Red) Arduino Pin D13
LED 2 (Green) Arduino Pin D8
11IRTTEC 2020 IOP Publishing
Journal of Physics: Conference Series 1793 (2021) 012068 doi:10.1088/1742-6596/1793/1/012068
Figure 8 shows the full circuit connected together. As can be seen the connections are correct since the
LCD display is light up. After successful coding and circuit construction, it was possible to use the
porotype for obtaining the pulse rate and the SpO2 values. The LED’s blinked in synchronisation with
the heartbeat. A few seconds were needed by the pulse sensor in order to locate the pulse for a strong
enough signal for it to process. Figure 9 shows the set up for testing the prototype with the Fluke
simulator.
Figure 8. Pulse oximeter prototype with all the connections.
Figure 9. Image showing full set up for testing.
After initial testing was completed, the construction of the casing for the porotype took place so as to
provide a better protection. An ABS Enclosed box was purchased with the measurements of 120 x 80
x 59mm. This was the perfect size to contain the pulse oximeter prototype. The ABS plastic used for
the box is lightweight with strong properties. The LCD display was needed to be placed in the box
hence a rectangular hole was cut out as the dimension of the LCD display. Two Small holes were cut
off in the box to fit the red and green LEDs. Once the slots were made according to the dimensions of
the components the prototype was placed into the box. The box was secured with 4 M3 screws, one in
each corner. The screws measured at 0.5 x 10mm.
4. Results and discussion
The results were presented on the “COM10” windows of the IDE software and showed the values
against the Fluke Simulator. Table 7 gives the Masimo results against the simulator.
Table 7. Masimo Set against the Fluke Simulator
NORMAL 100% SpO2 Tachycardic 88% SpO2 and Bradycardic 85% SpO2 and
and 60 BPM 180 BPM 30 BPM
12IRTTEC 2020 IOP Publishing
Journal of Physics: Conference Series 1793 (2021) 012068 doi:10.1088/1742-6596/1793/1/012068
SPO2 BPM SPO2 BPM SPO2 BPM
100% 60 87% 180 85% 30
100% 60 88% 180 85% 30
100% 60 88% 180 86% 30
100% 60 88% 180 85% 30
100% 60 87% 180 85% 30
100% 60 88% 180 85% 30
100% 60 88% 180 85% 30
100% 60 88% 180 85% 30
100% 60 88% 180 85% 30
99% 60 88% 180 85% 30
As can be seen from Table 7, there were 3 different settings at which 10 readings were taken at a
difference of 10 seconds between each reading. The Masimo is very accurate for getting the pulse rate
and % oxygen saturation. There is only a difference of + or – 1% in oxygen saturation readings, hence
its use at Royal Blackburn Hospital. Table 8 gives the prototype results against the simulator.
Table 8. Prototype results against simulator
NORMAL 100% SpO2 Tachycardic 88% SpO2 and Bradycardic 85% SpO2 and 30
and 60 BPM 180 BPM BPM
SPO2 BPM SPO2 BPM SPO2 BPM
96% 64 95% 165 96% 45
97% 67 97% 177 97% 41
98% 71 95% 172 95% 42
97% 67 99% 185 98% 42
97% 67 98% 177 97% 42
96% 66 96% 175 99% 41
96% 66 97% 176 97% 42
98% 68 98% 176 98% 43
96% 66 97% 175 98% 42
97% 66 96% 175 96% 44
As can be seen from Table 8, the prototype given very similar results for the SpO2 and pulse rate
(Tachycardic). At the “Normal” setting the pulse rate had an average reading of 66.8 BPM for the
Tachycardic. This meant that the prototype had an accuracy of + or – 10%. This is believed to be due
to the ambient lighting being present when the readings were taken place which affected the detector
on the pulse sensor as it was picking up interfering light noises. As can be seen from Table 8, the pulse
sensor struggled to get the low readings for the slow heart rate (Bradycardic). Noting that the readings
taken from the simulator caused no movement to alter the pulse rate being achieved, whereas there
was movement affecting the prototype results due to the fact that the pulse sensor within the prototype
was attached to a finger probe by sticky tape, hence the error.
4. 1 Error rate calculation for the prototype
To calculate the error rate for the prototype device against the set simulator readings for the pulse rate,
the following formula was used:
( )
Where:
E = Error Rate; A = Pulse Rate Reading from the Prototype; and M = Pulse Rate Reading from the
Simulator.
13IRTTEC 2020 IOP Publishing
Journal of Physics: Conference Series 1793 (2021) 012068 doi:10.1088/1742-6596/1793/1/012068
Normal Setting = ± 9.09%
Tachycardic = ± 2.85%
Bradycardic = ± 29.52%
4.2 Evaluating the Pulse Sensor used for the Prototype
The sensor used in this project was effective in some aspects, but lacked in other areas. The
justification for using this sensor was purely on the use of reflectance technology, being one of the
objectives to see whether reflectance technology is as accurate as the current transmittance technology.
Although It produced good results when tested under normal conditions, it lacked accuracy when
trying to achieve low pulse rate readings. Also, due to the sensor being very cost effective, this helped
to achieve the other objectives in that to create a low cost functional pulse oximeter prototype.
Total Prototype Cost:
Table 9 below shows the total cost of the pulse oximeter prototype.
Table 9. Total cost of the pulse oximeter prototype.
Quantity Cost Company
Item
Arduino Mega 2560 ADK 1 £33.04 RS
Components
Pulse Sensor 1 £4.99 EBay
Displaytech 162B-CC-BC-3LP Alphanumeric 1 £6.59 RS
Transflective LCD Monochrome Display Black, Components
Kit Workshop base level for Arduino 1 £29.75 RS
Components
Total Cost £74.37
The total cost was £74.37, which is a little above the expected cost of £50. This was due to having to
buy the Kit Workshop for construction and therefore the total cost would have been reduced by
£29.75, ultimately achieving the target cost.
5. Conclusions and future work
The shear purpose of the project was to construct a low cost PO prototype based on ‘Reflectance
Photo-Plethysmo-Graphy Technology’ (RPPGT) to obtain pulse rate and oxygen saturation readings.
The constructed prototype also used an LED and a photodetector diode. The assembled prototype was
able to obtain and monitor the changes in blood volume, hence presenting very similar SpO2 values
and similar pulse rate readings (Tachycardic = ± 2.85%) to those of the standard PO devices used at
East Lancashire Hospitals. However, there was an error rate of ± 29.52% for the slow pulse rate
(Bradycardia) believed to be due to motion artefacts. The RPPGT was found to be more cost effective
than the current standard transmittance POs used by the East Lancashire hospitals.
Although the sensor lacked accuracy at lower level of HR readings, this can be corrected by
improving the signal being received which can be done by using low value capacitors in the circuitry
of the pulse sensor, that reduces the amount of electrical interference within the circuit. The DC offsets
and motion artefacts will also be reduced with the introduction of low value capacitors.
14IRTTEC 2020 IOP Publishing
Journal of Physics: Conference Series 1793 (2021) 012068 doi:10.1088/1742-6596/1793/1/012068
References
Clark, J., 2016. The Beer Lambert Law.
http://www.chemguide.co.uk/analysis/uvvisible/beerlambert.html [Accessed 22 March 2017].
Graves, p., 2011. MediTech. [Online] Available at: http://www.meditech.com.cn/Meditech-
Library/Read-a-Pulse-Oximeter--Heart-and-Pulse-Rate.[Accessed 05 11 2016].
Instructables, 2016. Pulse sensor with Arduino. [Online] Available at:
http://www.instructables.com/id/Pulse-Sensor-With-Arduino/ . [Accessed 21 August 2017].
Mayo Clinic, 2015. What's a normal resting heart rate?. Healthy lifestyle Fitness.
Moyle, J.T.B., 2002. Pulse Oximetry. 2nd Edition. London: BMJ
RS, 2017. Arduino Mega. [Online]. Available at: http://uk.rs-online.com/web/p/processor-
microcontroller-development-kits/7154084/. [Accessed 21 August 2017].
Taylor, N., 2013. NHS Guideline for pulse oximeter use, Available
https://www.greaterhuddersfieldccg.nhs.uk/wp-content/uploads/Meds-
management/Pulse_Oximetry_guidelines_181013.pdf
Tusman, Gerardo., Bohm, Stephan., Suarez-Sipmann, Fernando. (2016). Advanced Uses of Pulse
Oximetry for Monitoring Mechanically Ventilated Patients. Anesthesia & Analgesia. 124. 1.
10.1213/ANE.0000000000001283.
WebMD, 2016. Bradycardia (Slow Heart Rate) - Topic Overview. [Online]
Available at: http://www.webmd.com/heart-disease/tc/bradycardia-slow-heart-rate-overview#1
[Accessed 7 August 2017].
15You can also read