Development of Methods for Assessing and Ensuring the Economic Security of Subjects
←
→
Page content transcription
If your browser does not render page correctly, please read the page content below
Development of Methods for Assessing and Ensuring the Economic Security of
                                  Subjects

   V.N. Scherbakov1; A.V. Dubrovsky2; I.V. Makarova3; L.M. Fomicheva4; V.N. Shchennikova5;
                                         A.V. Musyal6
          1
            Financial University under the Government of the Russian Federation, Moscow, Russia.
                     Institute of Economy Russian Academy of Sciences, Moscow, Russia.
          2
            Financial University under the Government of the Russian Federation, Moscow, Russia.
          3
            Financial University under the Government of the Russian Federation, Moscow, Russia.
                                4
                                  Moscow Polytechnic University, Moscow, Russia.
            5
             Russian Academy of National Economy and Public Administration, Moscow, Russia.
                  6
                    Kursk state Agricultural Academy named after I.I.Ivanov, Kursk, Russia.

Abstract
The article examines the dynamics of economic security indicators in the context of the viability of the
subjects of the Central Federal District of the Russian Federation. Several economic and social
indicators have been used to assess the level of regional development. The calculation of the integral
parameters of economic and social development has been carried out by rationing according to the
average Russian value.
The study of the interrelationships of economic potential from the point of view of rationality and
efficiency has shown that the degree of transition to a crisis state or a depressive regime of a
stagnating nature is very high in the conditions of archaic production relations based on market
mechanisms.

Key-words: Economic Security, Regional Development, Strategic Priority, Expanded Reproduction,
Inflation, Per Capita Income, Fixed Capital Investment.

1. Introduction

        Economic security issues are reflected in Russian and foreign studies. In this regard, it is of
interest to identify the essential characteristics of economic security and determine the indicators of
its assessment, which would accurately reflect the mechanism of generating chaos and uncertainty in
the market environment.

ISSN: 2237-0722                                                                                    1451
Vol. 11 No. 3 (2021)
Received: 28.04.2021 – Accepted: 15.05.2021
National economic security refers to the state of protection of the national economy from
internal and external threats, which ensures the economic sovereignty of the country, the unity of its
economic space, and the conditions for the implementation of the country's strategic national
priorities [1, 2].
        Some scholars focus on the determining role of self-financing, self-sufficiency, and the
development of economic potential (labor, industrial, investment, natural, and innovative) in the
assessment of economic security. However, this approach allows assessing the economic stability of
the economic complex rather than its security since it is based only on the assessment of the level of
reliability of economic growth and does not reveal the essence of the target security function, on
which the mobilization growth of the technical and technological potential of the country in the
broadest sense depends.
        The assessment of economic security also deserves attention from the point of view of the
internal ability to self-organize an economic entity and its sustainable and effective functioning and
development [3, 4]. This is due to the fact that under the influence of ongoing sanctions, the
boundaries of which are not defined, there is a rethinking of integration ties. The concepts of "growth
without development" are fading into the background, i.e. the scale of the economic downturn
requires a rethinking of the value of production in consumption and the search for qualitative
guidelines in the structural transformations of those industries on which the viability of the country as
a whole depends. It is important, first of all, to emphasize that structural policy should support those
industries and sectors of the economy that ensure growth and development with the participation of
the state and under its control, and not vice versa. This is also important since Russia still has the
potential of the Soviet period, in particular in the military-industrial complex, fuel and energy
complex, transport engineering, etc. In any formulation, the value of efficiency, and hence safety, will
be determined by the degree of competitiveness of the domestic economy based on the growth of
technical, technological, organizational, and economic potential of the country.
        Currently, the announced transition to a new digital growth paradigm raises a big and
ambiguous question, since the adopted strategic programs do not have a mechanism that can activate
the potential of socio-economic development and solve the problem of security of the domestic
economy in terms of adaptation to new challenges [9]. After all, the essential side of security is the
quality and stability of the population's life, guaranteeing peace and tranquility in society, as well as
the ability to solve accumulated problems and actively influence acute socio-economic challenges,
such as negatives in demographic processes, low living standards, high mortality, low birth rates, and
a decrease in the level of human potential.

ISSN: 2237-0722                                                                                     1452
Vol. 11 No. 3 (2021)
Received: 28.04.2021 – Accepted: 15.05.2021
In other words, the task statement should consist in the fact that the basic set of economic
security is national priorities, and not only economic expediency, which increasingly aggravates the
situation in the social sphere and violates the living space and the usual way of life of the country.
2. Materials and Methods
The purpose of this study was to identify the essential characteristics of the economic security
of the territory in terms of the possibility of sustainable and progressive development, neutralization,
or mitigation of economic threats and disasters; to substantiate the methodological approach to
assessing economic security and its implementation on the example of the Central Federal District of
the Russian Federation.
The following tasks were set to achieve this goal:
• To identify the relationship of technical, technological, organizational, and economic
potentials with the economic and social security of the region;
• To propose methodological approaches to the assessment of the economic and social
security of the region.
In the course of the work, we used general and special scientific methods of system analysis,
the method of expert assessments, and the method of analogy and comparison in the aspects of
revealing the priorities of industrial growth.
The conducted research was based on data from Rosstat, the Central Bank of the Russian
Federation, and the Federal Tax Service of Russia.
3. Results
Turning to the problem of methodology and criteria for assessing economic security, we note
that the following integral indicators were developed in the presented study to assess the level of
economic security of subjects: the economic security coefficient (ESC) and the social security
coefficient (SSC). From our point of view, the set of indicators used to calculate the ESC and SSC to
a certain extent allows assessing the level of security for individual subjects, subject to a limited
number of statistical data offered by the Federal State Statistics Service.
The methodological approach used involves the use of per capita average indicators in integral
coefficients. All indicators were assigned to the average Russian analog to reduce to a common unit
ISSN: 2237-0722 1453
Vol. 11 No. 3 (2021)
Received: 28.04.2021 – Accepted: 15.05.2021of measurement. The obtained coefficient allows estimating the level of economic and social security
relative to the average Russian level.
After bringing all the indicators to a common unit of measurement (the ratio to the average
Russian indicator), the ESC and SSC were calculated. For this purpose, the average value of all
indicators characterizing the corresponding section from 2005 to 2018 is calculated. The obtained
coefficients illustrated the degree of economic and social security of the region in a particular year.
The result was two sets of coefficient values for each of the regions, demonstrating the dynamics of
these indicators.
The indicators of economic security (ESC) were classified as:
• Annual GRP per capita, rub.;
• Annual rate of inflation (consumer price index for goods and services – December to
December), %;
• Investments in fixed assets, per capita, rub.;
• The degree of depreciation of fixed assets (at the end of the year for the full range of
enterprises), %;
• The share of unprofitable organizations (as of January 1), %.
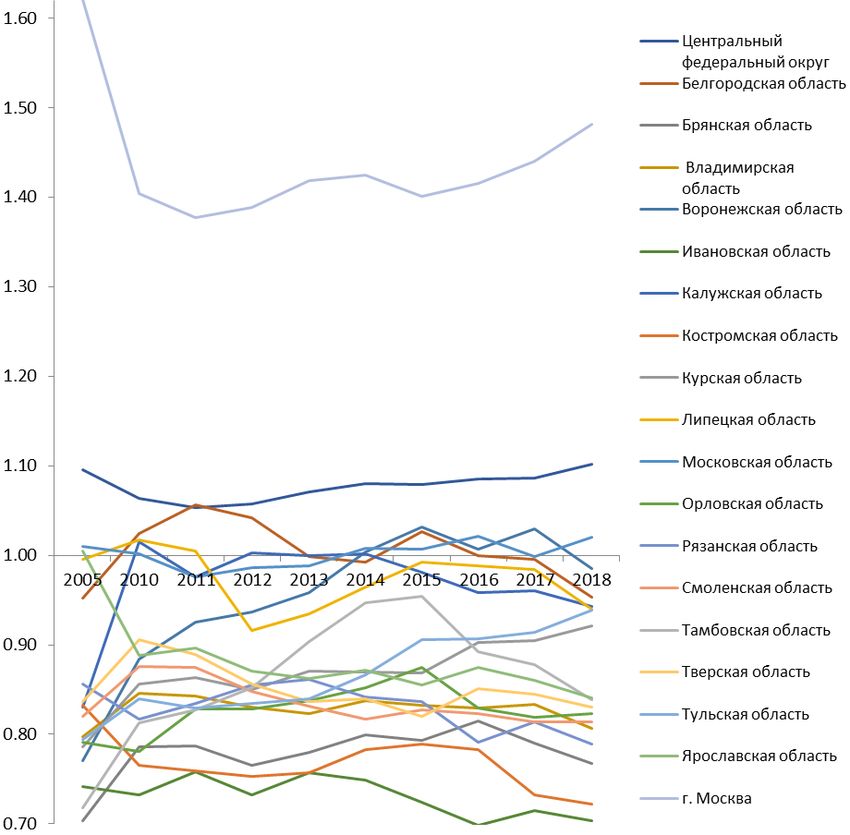
The following were selected as indicators characterizing the social security of the SSC:
• Average per capita monetary income of the population (per month, rub.);
• The share of the population with monetary incomes below the regional subsistence
minimum in the total population of the subject of the Russian Federation, percentage;
• The average amount of assigned pensions, rub.;
• Total area of residential premises per inhabitant, sq. m;
• The total birth rate (the number of births per 1,000 people of the population).
All indicators were normalized according to the national average to calculate the integral
parameters of economic and social security.
The result is Table 1, where the calculated average indicators for the group of economic and
social indicators are carried out.
ISSN: 2237-0722 1454
Vol. 11 No. 3 (2021)
Received: 28.04.2021 – Accepted: 15.05.2021Table 1 - Average Values of the ESC and SSC Levels in 2005-2018
Regions Economic indicators Social indicators
Central Federal District 1.08 1.05
Belgorod Region 1.00 0.99
Vladimir Region 0.83 0.92
Bryansk Region 0.78 0.93
Ivanovo Region 0.73 0.89
Voronezh Region 0.95 0.95
Kostroma Region 0.77 0.93
Kaluga Region 0.97 0.98
Lipetsk Region 0.97 0.97
Kursk Region 0.87 0.95
Oryol Region 0.83 0.92
Moscow Region 1.00 1.11
Smolensk Region 0.83 0.92
Ryazan Region 0.83 0.93
Tver Region 0.85 0.96
Tambov Region 0.86 0.91
Yaroslavl Region 0.88 0.96
Moscow 1.44 1.20
Tula Region 0.87 0.94
Calculated by the authors
The annual data used to calculate Table 1 allows plotting the graphs Fig. 1 and Fig. 2.
Figure 1 - Dynamics of the Integral Coefficient of Economic Security in 2005-2018
ISSN: 2237-0722 1455
Vol. 11 No. 3 (2021)
Received: 28.04.2021 – Accepted: 15.05.2021Центральный федеральный округ Central Federal District
Белгородская область Belgorod Region
Брянская область Bryansk Region
Владимирская область Vladimir Region
Воронежская область Voronezh Region
Ивановская область Ivanovo Region
Калужская область Kaluga Region
Костромская область Kostroma Region
Курская область Kursk Region
Липецкая область Lipetsk Region
Московская область Moscow Region
Орловская область Oryol Region
Рязанская область Ryazan Region
Смоленская область Smolensk Region
Тамбовская область Tambov Region
Тверская область Tver Region
Тульская область Tula Region
Ярославская область Yaroslavl Region
г. Москва Moscow
Figure 2 - Dynamics of the SSC in 2005-2018
ISSN: 2237-0722 1456
Vol. 11 No. 3 (2021)
Received: 28.04.2021 – Accepted: 15.05.2021Центральный федеральный округ Central Federal District
Белгородская область Belgorod Region
Брянская область Bryansk Region
Владимирская область Vladimir Region
Воронежская область Voronezh Region
Ивановская область Ivanovo Region
Калужская область Kaluga Region
Костромская область Kostroma Region
Курская область Kursk Region
Липецкая область Lipetsk Region
Московская область Moscow Region
Орловская область Oryol Region
Рязанская область Ryazan Region
Смоленская область Smolensk Region
Тамбовская область Tambov Region
Тверская область Tver Region
Тульская область Tula Region
Ярославская область Yaroslavl Region
г. Москва Moscow
The average levels of ESC and SSC for the study period (from 2005 to 2018) were calculated
to classify the regions according to the level of economic and social security.
Fig. 3 shows the change in indicators of economic and social security of the subjects of the
Central Federal Macro-region of the Russian Federation in 2010-2018. All the regions under
consideration were placed on the same grid and the dynamics of the average values of the ESC and
SSC taken over three years: 2010, 2015, and 2018 were shown.
Figure 3 - Dynamics of Indicators of Socio-economic Security of the Subjects of the Central Federal District in 2005-2018
ISSN: 2237-0722 1457
Vol. 11 No. 3 (2021)
Received: 28.04.2021 – Accepted: 15.05.2021Центральный федеральный округ Central Federal District
Белгородская область Belgorod Region
Брянская область Bryansk Region
Владимирская область Vladimir Region
Воронежская область Voronezh Region
Ивановская область Ivanovo Region
КЭБ ESC
КСБ SSC
Центральный федеральный округ Central Federal District
Костромская область Kostroma Region
Курская область Kursk Region
Липецская область Lipetsk Region
Москвоская область Moscow Region
Рязанская область Ryazan Region
КЭБ ESC
КСБ SSC
ISSN: 2237-0722 1458
Vol. 11 No. 3 (2021)
Received: 28.04.2021 – Accepted: 15.05.2021Центральный федеральный округ Central Federal District
Смоленская область Smolensk Region
Тамбовская область Tambov Region
Тверская область Tver Region
Тульская область Tula Region
Ярославская область Yaroslavl Region
Москва Moscow
КЭБ ESC
КСБ SSC
Calculated by the authors
Thus, the regions that fall into the upper-right zone (the first quarter of the coordinate plane)
can be conditionally classified as economically and socially safe [6-8].
We note that two regions did not leave this right ("safe") zone during the period under review:
Moscow and the Moscow Region. They can be called conditionally stable.
The Belgorod Region and the Kaluga Region started outside the "safe zone", but eventually
they entered it. The Belgorod Region started in the "safe zone", but then left it for economic
development. These entities are located in the risk zone. The situation in the Ivanovo, Bryansk,
Vladimir, Oryol, Kostroma, Ryazan, Smolensk Regions, which are not only noticeably inferior but
also significantly lag behind the leading regions in terms of economic and social security, is of
particular concern. It is in a state of a prolonged recession.
ISSN: 2237-0722 1459
Vol. 11 No. 3 (2021)
Received: 28.04.2021 – Accepted: 15.05.2021The trajectories of the regions in Fig. 3 show progress or regression over the period under
review from 2005-2018 in both economic and social security. It can be seen that Moscow and the
Moscow Region have made the greatest progress in economic security – they provide the growth of
indicators throughout the Central Federal District. It is much more difficult for the regions to make
progress in social security.
4. Discussion
The high level of economic security of Moscow is provided, first of all, due to the high GRP
per capita (exceeding the Russian average 2.61 times). In addition, Moscow has a lower degree of
depreciation of fixed assets (the reverse indicator is 1.26 times higher than the Russian average) and
the average per capita investment in fixed assets is 1.32 times higher.
Therewith, its values correspond to the average Russian values for the consumer price index
and the share of unprofitable organizations, which reduces the ability of the subject to the criteria of
economic security selected in the study [14].
The high value of the Moscow SSC is provided, first of all, by high average per capita
incomes (2.2 times higher than the Russian average), the growth of the indicator by the ratio of the
average per capita monetary income of the population to the subsistence minimum (1.04 times higher
than the Russian average), and the excess of the average Russian level in terms of the size of assigned
pensions in 1.08 times. Meanwhile, the indicators of the growth of the total area of residential
premises, which is on average per inhabitant (0.8 of the average Russian level), and the birth rate,
which is at the level of 0.88 of the average Russian value, remain problematic [5].
The strengths of the Moscow Region are the relatively low level of depreciation of fixed
assets (depreciation of fixed assets is 1.12 times higher than the average Russian level) and the
proportion of unprofitable enterprises (the reverse indicator is 1.02 times higher than the average
Russian level). The situation with the stability of consumer prices is quite good – the average growth
corresponds to the average Russian level, and in recent years it is lower by 0.01%. The situation with
the average per capita GRP of the region is slightly worse – it is 0.96 of the average Russian level,
and there has been a tendency for it to correspond to the average Russian level in recent years. The
average per capita investment in fixed assets, in contrast to Moscow, shows a reduced value,
amounting to 0.91 of the Russian average, which pulls the region down in economic indicators [2].
According to the assessment of social security, the Moscow Region demonstrates a high level,
exceeding the national average 1.11 times. However, the level of income inequality (Gini coefficient
ISSN: 2237-0722 1460
Vol. 11 No. 3 (2021)
Received: 28.04.2021 – Accepted: 15.05.2021– 393) is higher than the average for the district in 1.07 times), while the level of income of the
population compared to Moscow is small (the ratio of average per capita income was 1.53 times in
2018, and the level of poverty is slightly higher – 1.07 times the number of people with incomes
below the subsistence minimum is less than in Moscow [11, 13, 16].
The unemployment rate is almost twice lower than the national average (2.7% vs. 4.6%) and
is slightly below the average for the Central Federal District (2.9%). A fairly good result is
demonstrated by the indicator of the area of residential premises per inhabitant, which in 2018
exceeded the average Russian results 1.26 times.
The assessment of integral indicators of such regions as Belgorod, Kaluga, Voronezh, Kursk,
Tver, Lipetsk, Yaroslavl, and Tula allows classifying them as sufficiently developed. Let us analyze
the sources of growth in these areas.
The peculiarity of the Belgorod Region is a fairly high level of GRP per capita (its average
value corresponds to the national average) and a low level of depreciation of funds, exceeding the
national average in 1.07 times, as well as a low proportion of unprofitable enterprises (the reverse
indicator is 1.05 higher than the national average). This is extremely important for the economy of the
region and can play a role in growth potential.
The Voronezh Region does not have a large volume of investment, unlike the Lipetsk region,
where it is 1.06 of the average Russian level. This makes it possible to actively generate added value
in various industries, transport complex, agriculture, which is quite clearly seen in the volume of GRP
per capita – in the Lipetsk Region, it is 319,842 rubles against 269,350 rubles in the Voronezh
Region.
The level of income of the population of the Kaluga and Yaroslavl Regions is relatively low
(the average per capita income corresponds to 0.86 and 0.81 of the national average), but the level of
inequality is also low (the Gini coefficient of 0.362 and 0.357 corresponds to the average for the
district), including pensions (the average amount of assigned pensions is equal to the average). The
number of people with incomes below the subsistence minimum (the reverse indicator is 1.01 times
higher than the national average). The population of the Kaluga Region is better provided with
housing in comparison with the Yaroslavl Region (the area per inhabitant is 1.14 and 1.07 times
higher than the average, respectively).
The Tver and Tula Regions generate a low volume of added value, which results in a gross
GRP significantly lower than the national average of 0.59 and 0.65 times). This is also provoked by
the fact that enterprises in the regions do not attract investments (average per capita investment
indicators are 0.72 and 0.69 of the average, respectively). Therewith, enterprises often suffer losses
ISSN: 2237-0722 1461
Vol. 11 No. 3 (2021)
Received: 28.04.2021 – Accepted: 15.05.2021(the reverse indicator of the share of unprofitable organizations is only 0.89 and 0.96 of the national
average).
The Kursk Region creates a relatively low volume of value-added (the volume of GRP per
capita is only 0.65 of the national average) and attracts little investment (the average per capita
investment in fixed assets is 0.72 of the average). Organizations update their fixed assets (the reverse
indicator of the degree of depreciation is 0.96 times the national average). The inverse indicator of the
share of unprofitable organizations is 1.02 of the national average.
The assessment of socio-economic integral indicators of such regions as Bryansk, Kostroma,
Vladimir, Smolensk, Oryol, Ryazan, Tambov, allows classifying them as poorly developed. Let us
analyze the reasons for this situation in the regions and the sources of growth.
The Bryansk and Kostroma Regions create a very low volume of GRP with the average per
capita GRP indicators being in the region of 50% of the national average. In terms of attracting
investment, they are significantly behind the national average (fixed capital investment per capita is
0.47 and 0.41 of the average, respectively). At the same time, the indicators of renewal of fixed assets
are quite high (the indicator is 1.04 and 1.02 of the national average), organizations often suffer losses
(the reverse indicator of the share of unprofitable organizations is 0.93 and 0.88 of the average).
The Vladimir and Smolensk Regions create a relatively small amount of added value, slightly
more than half of the Russian average (the average per capita GRP is only 0.57 and 0.58 of the
national average, respectively). Enterprises are not active in attracting investments in fixed assets (the
average per capita investment in fixed assets is 0.51 and 0.64 times the national average of 1.07
times). Organizations of the Vladimir Region are more actively updating fixed assets compared to the
Smolensk Region (the reverse indicator of the degree of depreciation of funds is 1.06 and 0.99 times
higher than the national average), while the unprofitability corresponds to the national average).
The Oryol and Ryazan Regions generate a small amount of added value (the per capita GRP is
slightly more than half of the national average, amounting to 0.55 and 0.61 times the national
average), enterprises do not show sufficient activity in attracting investment – their per capita figure
is 0.56 and 0.58 of the national average. The degree of depreciation of fixed assets for enterprises in
the Oryol Region corresponds to the national average, and it is overestimated (the reverse indicator is
0.89 of the national average) in the Ryazan Region.
The Tambov Region generates a relatively small amount of added value (per capita GRP is
0.56 of the national average), but actively attracts investment (0.90 of the national average) compared
to the Oryol and Ryazan Regions. Organizations do not update fixed assets at the level corresponding
to the industry average (the reverse indicator of the degree of depreciation is 0.81 times higher than
ISSN: 2237-0722 1462
Vol. 11 No. 3 (2021)
Received: 28.04.2021 – Accepted: 15.05.2021the national average), while they are not characterized by unprofitability (the reverse indicator of the
share of unprofitable organizations is 1.04 of the average).
The Ivanovo Region generates a relatively small amount of added value (per capita GRP is
0.37 of the national average), which is due to the low level of investment in fixed assets, which is
0.33 of the national average. The level of renewal of fixed assets is above average (the indicator is
1.07 of the national average), which may determine the growth potential in the long term.
Organizations suffer losses more often than the average (the reverse indicator of the share of
unprofitable organizations is 0.91 of the national average). These parameters determine a rather low
level of economic development according to the integral coefficient – 0.73.
5. Conclusion
As a result of the study, a system of indicators for assessing the level of economic and social
security of the subjects is proposed, which allows assessing the potential for sustainable growth and
development of the region's economy; the results of ranking the subjects of the region by the level of
economic potential development are proposed, which will allow planning the directions of regulating
the development of the territory; the interrelationships of the growth of value-added, investment in
fixed assets, average per capita monetary income from the average level in the country are revealed
[15].
The study confirmed the thesis that the high incomes of the population in the region cause a
higher stratification, which leads to social tension in the region. Some regions show high indicators of
social security because there is a so-called "uniform poverty", which characterizes the negative
dynamics of regional development. The following pattern is observed: the lower the income, the
higher the pensions concerning them. This can be explained by the fact that the size of the pension is
regulated by the state, and salaries are regulated by the local labor market. Pensions are invariant
across all regions, with their characteristics of the labor market and different income levels.
It is known that GRP per capita illustrates the economic state of the region now, and the level
of investment – in the future. Regions that have a low GRP per capita, but high investment, have
prospects for development [10] Inflation as an indicator of macroeconomic stability is at the same
level and does not significantly affect the final indicator of economic security.
It is noteworthy that several regions (Vladimir, Ivanovo, Kostroma, Bryansk, Ryazan, Oryol,
Smolensk) have reduced integral coefficients of economic security and SSC. This confirms the
ISSN: 2237-0722 1463
Vol. 11 No. 3 (2021)
Received: 28.04.2021 – Accepted: 15.05.2021depressive processes in the designated territories and requires the implementation of a structural
economic policy for the development of their potential.
In general, it can be stated that for 2010-2018, the considered regions of the Central Federal
District can be divided into several groups – the most developed (Moscow and the Moscow Region
are leaders, have stable indicators of economic and social security), developed (Belgorod, Kaluga,
Voronezh, Kursk, Tver, Lipetsk, Yaroslavl, Tula Regions), poorly developed (Bryansk, Kostroma,
Vladimir, Ryazan, Oryol, Tambov, Smolensk Regions), undeveloped (Ivanovo Region – depressed
territories that require intervention). A detailed analysis of the problems involved, including the
territorial aspect, requires the refinement of the forecast calculations, as well as a systematic link with
the potential of the regions, considering the group production entities.
At present, it is becoming quite obvious that the adopted management mechanism in the
Central Federal District does not contribute to improving the level of security. The lower the level of
security, the lower the technical, technological, and organizational potential, which results in the
transition of the economy to a depressive or crisis mode [12].
Therefore, the problem of economic security is always associated with the level of
development of technical, technological, organizational, and economic potential, the maintenance of
which ensures the competitiveness of the economic complex in the operating environment of the
market and its progressive development.
References
Decree of the President of the Russian Federation "On the strategy of economic security of the
Russian Federation for the period up to 2030".
http://publication.pravo.gov.ru/Document/View/0001201705150001
Dementyev, V.V., Scherbakov, A.P. (2017). Profit and Economic Growth Terra economicus, 15(3),
75-91.
Bogoviz, A.V., Ragulina, Y.V., & Kutukova, E.S. (2016). Economic zones as a factor of increased
economic competitiveness of the region. International Journal of Economics and Financial Issues,
6(8S), 1-6
Shcherbakov, V.N., Dubrovsky, A.V., Makarova, I.V., Shchennikova, V.N., Nozdrin, V.S., &
Anokhin, S.A. (2020). Strategic Guidelines and Priorities of Russia’s Industrial Transformation.
International Journal of Management, 11(5), 941–949.
Federal State Statistics Service of the Russian Federation. URL: https://rosstat.gov.ru/
Kuryshova, Y.S., Shcherbakova, N.S., Sopilko, N.Y., Bondarchuk, N.V., Kubasova, E.I., &
Dyatlova, O.V. (2019). Modelling of human behaviour as a tool of enhancement the consumer focus
ISSN: 2237-0722 1464
Vol. 11 No. 3 (2021)
Received: 28.04.2021 – Accepted: 15.05.2021of service providers. Journal of Advanced Research in Dynamical and Control Systems, 11(8), 960- 968. Kobtseva, O.N., Shichiyakh, R.A., Sidorchukova, E.V., Novoselova, N.N., Novoselov, S.N., & Morkovkin, D.E. (2017). Organizational and economic features of import substitution formation and realization in the conditions of spatial restrictions. International Journal of Applied Business and Economic Research, 15(23), 25-35. Hojiev, J.N., Morkovkin, D.E., Starovoitov, V.G., Gibadullin, A.A., Dubrovsky, A.V., & Boldyreva, I.A. (2020). Renewable energy engineering solutions. In IOP Conference Series: Materials Science and Engineering, 837(1), 012008. Sorokin, D.E. (2019). On the ability of Russia to socio-economic transformations. Economic revival of Russia, 1(59), 23-28. Scherbakov, V.N., Dubrovsky, A.V., Makarova, I.V., Zotova, A.I., & Nakhratova, E.E. (2018). Labor motivation and its endogenous level. International Journal of Engineering and Technology (UAE), 7(4.38), 442-446. Sorokin, D.E. (2015). Economic theory, economic reality and economic policy. Экономика региона, (1), 17-29. Shcherbakov, V.N., Dubrovsky, A.V., Makarova, I.V., Fomicheva, L.M., Shchennikova, E.I., & Nozdrina, Y.I. (2020). Development of Motivational Mechanism Under Conditions of Socioeconomic Transformations. International Journal of Management, 11(4), 272-281. Morkovkin, D., Shmanev, S., & Shmaneva, L. (2017). Problems and trends in innovative transformation of Russian economy and infrastructure development. In 3rd International Conference on Economics, Management, Law and Education, (EMLE 2017). Сер. Advances in Economics, Business and Management Research, 32, 10-13. Tolkachev, S.A. (2019) State policy of supporting manufacturing industries of Russia in the context of international sanctions Humanities. Bulletin of the University of Finance, 9(6), 72-81. Shcherbakova, N.S., Nazarova, Y.A., Kirichenko, O.S., Gorunov, O.A., & Dubrovsky, A.V. (2020). Evaluation of Gas Industry Competitiveness in the Foreign Market. International Journal of Energy Economics and Policy, 10(6), 272–279 Tsikin, A.M., & Alpidovskaya, M.L. (2018). Fundamentals of Russian economic policy for increasing competitiveness. In International Conference Project “The future of the Global Financial System: Downfall of Harmony” Lecture Notes in Networks and Systems. ISC, 57, 432-442. ISSN: 2237-0722 1465 Vol. 11 No. 3 (2021) Received: 28.04.2021 – Accepted: 15.05.2021
You can also read