Differentiation of Oil Production Break-even Level among World Oil Companies
←
→
Page content transcription
If your browser does not render page correctly, please read the page content below
International Journal of Energy Economics and
                                                       Policy
                                                                ISSN: 2146-4553

                                               available at http: www.econjournals.com
                                   International Journal of Energy Economics and Policy, 2021, 11(4), 249-256.

Differentiation of Oil Production Break-even Level among World
Oil Companies

Marina A. Osintseva*

Industrial University of Tyumen, Russian Federation. *Email: osintsevama@mail.ru

Received: 03 February 2021                                      Accepted: 02 May 2021                       DOI: https://doi.org/10.32479/ijeep.11260

ABSTRACT
The issue of modern development in the oil industry has become extremely urgent. In 2020, for the 1st time in history, the exchange price of oil crossed
the negative threshold, radically changing the understanding of economic processes in the industry. This paper examines the consequences of this
stressful situation in the context of the financial stability of global oil companies in conjunction with ensuring the budgetary balance for resource-
exporting countries. In the course of the study, the factors that influence the pricing in the oil market have been clarified. The authors have calculated
break-even oil prices for the world’s largest oil companies Saudi Aramco (SAU), ExxonMobil (USA), British Petroleum (GBR), and Rosneft (RUS).
An analysis of the fiscal break-even of oil prices has shown that Russia, compared to the Gulf countries, has a greater margin of budgetary stability,
since the break-even price of oil is several times lower than in Iran, Iraq, and Saudi Arabia. Based on the assessment of the operating leverage of the
oil companies, a limit was set for the decline in profits as a result of the drop in oil production. The calculation of the target price for large global
companies has shown that Rosneft has the highest price level due to high variable costs, and the target price for Saudi Aramco is approximately at the
same level. ExxonMobil and BP’s target price levels are lower. The results obtained confirm the need to continue searching for solutions to optimize
costs to lower the breakeven level of oil production.
Keywords: Oil, Break-even Price, Prime Cost, Pricing Factors, Budget Balance, Oil Market, Price Shocks
JEL Classifications: L21, G31, Q49

                    1. INTRODUCTION                                            on price expectations, which are closely related to the break-even
                                                                               point. In this regard, it seems relevant to study the impact of price
Oil will remain the main source of energy for the foreseeable                  fluctuations on the operational financial stability of oil companies.
future, necessitating a balance between global supply and demand.
The world oil market is heterogeneous and has its own regional                 In most countries, the current break-even level of oil prices tends to
characteristics (Khudoynatov, 2014). The main oil consumers,                   grow and in some cases approach or exceed the spot price (Caceres
the countries of the Asia-Pacific region and North America, are                and Medina, 2012). It should be borne in mind that domestic prices
the most vulnerable to economic shocks (Raputsoane, 2019; Rau,                 in the markets of producing countries differ significantly from the
2017). Crisis events in these markets caused sharp fluctuations in             world exchange prices. Lost incomes depending on the break-
oil prices. This volatility does not go unnoticed by oil companies.            even level in this case, as a rule, are covered by export supplies.
When oil prices and profitability of companies rise, the oil                   However, the sharp drop in oil prices in late March – early April
industry expands into new territories (Kleinberg, 2014). In such               2020 caused a serious crisis in a number of countries focused
conditions, economic assessments come to the fore, since it                    on the exports of natural resources. The category of dependent
becomes important to allocate limited investments and capital as               countries should include Russia, Brazil, Saudi Arabia, Argentina,
efficiently as possible. Funding for oil production projects is based          Qatar, Nigeria, Venezuela, and Kuwait (Rau, 2017).

                              This Journal is licensed under a Creative Commons Attribution 4.0 International License

                 International Journal of Energy Economics and Policy | Vol 11 • Issue 4 • 2021                                                     249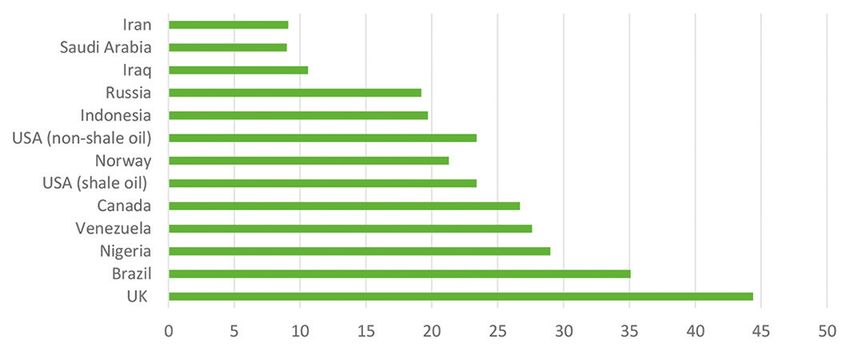
Osintseva: Differentiation of Oil Production Break-even Level among World Oil Companies

The coronavirus epidemic and the forced measures to combat it                state budget (Clayton and Levi, 2015). Where the government is
are having an increasingly negative effect on demand in the global           a large shareholder in oil companies, as is often the case in highly
oil market. In the second half of March 2020, oil prices more than           resource-dependent countries, the financial break-even point
halved, updating their minimum values since 2002-2003, and                   depends on corporate dividends and similar payments (Kleinberg
then crossed the line of negative values for the 1st time in history.        et al., 2018). Tax policies in different countries also have a
In this situation, OPEC+ participants announced plans to cut                 significant impact on the final cost of oil production. Direct and
production. In this context, one of the popular behavior patterns            indirect taxes can include up to 2/3 of the cost of oil (Nurtdinova,
of oil-exporting countries suggests that oil producers tend to keep          2010; Volkonskii and Kuzovkin, 2019; Weijermars, 2015). External
production levels unchanged as long as prices are sufficient to meet         break-even implies additional aspects of production activities,
their budget obligations. This means that the production policy              such as social costs, environmental impact, etc. (Greenstone and
of an oil-exporting country could undergo drastic and unexpected             Looney, 2012; Health Effects Institute, 2015; Jackson et al., 2014;
changes as oil prices cross the financial break-even level (Clayton          United States Environmental Protection Agency, 2016).
and Levi, 2015).
                                                                             In recent publications, the price of break-even oil production is
Episodes of spikes and falls in commodity prices lead to volatility          increasingly discussed in relation to shale oil, or rather, in the
in the budget revenues of exporting countries. However, for                  context of the implementation effectiveness of such projects. So,
countries where overall deficits cannot be easily financed, a                Garanina (2014) cites some data on the break-even price of shale
break-even oil price can play a very important role. It is important         oil in the United States and Canada and claims that production
to emphasize here that if the short- and medium-term vectors of              is high-risk and low-profit. The active development of shale
development of the world oil market can still be outlined from               oil appears to play a large role in securing long-term prices.
the standpoint of the interaction of the main factors, then the              Grushevenko and Kulagina (2019) assessed the competitiveness of
long-term prospects cannot be assessed outside the context of the            unconventional oils and made a forecast of their further potential
ongoing global energy transformation (Gromov, 2018); its essence             production. In their opinion, a break-even oil price is a price at
is revealed in structural changes, where the share of traditional            which the net present value of a given oil production project is
types of energy is gradually decreasing in favor of the electric             positive and the internal rate of return is at an acceptable level for
power industry (Kuzmin et al., 2019; Miciuła and Stępień, 2019;              the operator (usually in the range from 10% to 20%). However,
Primova, 2015). The transformation processes are clearly projected           the current price dynamics do not make it possible to fully achieve
in the oil price.                                                            the desired level of profitability.

It is these reasons that predetermined the goal of this study, which         Isain (2015) examines modern forms of oil pricing, including the
is to assess the level of break-even oil production among the global         nature of the influence of various factors: demand, supply, exchange
oil companies. To do this, the authors will give a brief description         rates, and geopolitical risks. According to common practice, in the
of the world oil market, analyze the dynamics of pricing, and assess         long run, the oil price shock does not lead to an increase in the
the impact of changes in oil prices on the financial condition of            exchange rate, but in the short run, such effects do appear (Ydyrys
the largest oil-producing companies.                                         et al., 2018). The outlook for the future development of the global
                                                                             oil market is also associated with uncertainty about climate
              2. LITERATURE REVIEW                                           and energy policies, changing demographics, global economic
                                                                             growth, and shifting economic power between regions, as well
Various criteria are used when comparing the economic                        as technological progress (Gromov, 2018).
attractiveness of oil projects. Kleinberg et al. (2018) clarify the
objectives of several benchmarks and the factors influencing them.           An analysis of production processes has revealed a strong
The main factors are climatic conditions, oil production depth,              relationship between oil price and marginal costs (Toews and
infrastructure development, availability of advanced oil production          Naumov, 2015). However, oil wells that are expected to exhibit
technologies, environmental requirements, and remoteness from                higher marginal costs can be tapped if the oil price and the
key consumers. Recent trends in the context of value-forming                 profitability of the well are high enough. All other things being
factors in the world oil market are studied in Mukaydekh and                 equal, an increase in drilling costs shifts the averaging curve
Mukaydekh (2017). They note changeable dominance in the                      upward so that the break-even point of the well can only be
relationship between fundamental and non-fundamental factors.                reached at a higher oil price. The search for cost optimization
At the same time, the break-even point is considered as the most             solutions has led to the fact that companies in the oil industry are
complete assessment of the economic viability of the project                 no longer vertically integrated. Kellogg (2011) explains this based
(Brealey et al., 2009).                                                      on the calculation of capital costs for drilling wells and operating
                                                                             costs. Rig outsourcing became the primary optimization option.
Kleinberg et al. (2018) note fiscal (financial) break-even and               This reduces the overall requirement to maintain aggregate rig
external break-even points. The break-even costs of a full cycle             capacity and creates savings in transportation and mobilization
and all of its components are essentially technical and economic             costs (Adelman, 1993; IHS, 2014).
in nature. A financial break-even point has a completely different
nature – it is the price of oil needed to finance spending, for those        From the point of view of microeconomics, oil prices should
countries that are heavily dependent on oil exports to finance the           not fall below the marginal costs of its production (Kolpakov,

 250                                                  International Journal of Energy Economics and Policy | Vol 11 • Issue 4 • 2021
Osintseva: Differentiation of Oil Production Break-even Level among World Oil Companies
2014). In the context of globalization, the world oil market is E (Q)
( P
VC )
presented as a single interconnected object, as a result of which OL
EP
the marginal costs of oil production should be considered not
in a specific country, but in the world as a whole. Kolpakov
(2014) believes that the cost of oil production is likely to rise. GM EP
FC FC
Ol 1
This is due to the depletion of cheap reserves, an increase in EP EP EP
exploration costs, and the need to introduce into development
new production regions characterized by more difficult
conditions for the development of the resource potential. In where OL – operating leverage, P – price, EP – profit, GM – gross
modern conditions, when the price of oil exceeds the marginal margin.
cost of its production, the assumption that the price significantly
reflects the level of operating costs does not find convincing The target price (or sufficient price), in addition to fixed and
arguments in its support. The manifested cross-correlation of variable production costs, takes into account the restrictions on
these values m ay be due to a reverse causality – oil prices affect profit in terms of the normal level of return-on-investment capital
the costs level of oil companies. Such influence can be exerted and sales.
not so much directly as indirectly. Kolpakov (2014) draws
attention to the fact that in the world oil market there are some As a result, the formula for identifying the target price will look
examples of both direct and reverse relationships between the like this:
level of oil prices and the cost of its production. This requires
additional study of the causes of such anomalies. % R
Cap
TP Pe.v
(3)
E (Q)
Despite the presence of a wide range of studies in the subject area,
there is a lack of publications devoted to comparative analysis
and monitoring of the oil production break-even level among where %R – the sufficient or normal level of return on capital
the main global players. This circumstance is key in identifying (return on equity); Cap – investment capital; TP – the target price.
the comparative competitive advantages of oil companies in the
market. This research is intended to provide greater clarity on The empirical base of the study was made up of static data and
this issue. reports of oil companies.
3. METHOD 4. RESULTS AND DISCUSSION
The study was carried out in two stages. At the first stage, the The main supplier of oil to the world market regionally remains
structure of the cost of oil production for the main oil-producing the Middle East, headed by Saudi Arabia, and in the organizational
countries was analyzed based on statistical data (UK, Brazil, sense – OPEC, which includes most of the oil-producing countries
Nigeria, Venezuela, Canada, USA, Norway, Indonesia, Russia, of the Middle East region. The three leading countries in oil
Iraq, Saudi Arabia, and Iran). At the second stage, the break- production include Russia, Saudi Arabia, and the United States.
even price of oil production by the world’s largest oil companies Each of these countries experienced a significant reduction in
(including Saudi Aramco, Exxon Mobil, British Petroleum, and production at different times, but since 2014, they have been
Rosneft) was estimated. producing oil within their production capabilities, adjusting to
the needs of the economy. In 2019, the rate of global economic
Analytical indicators of the study include the calculation of the growth declined more seriously than before – from 3.6% to 2.9%
break-even point, operating leverage, and target price. (World Bank, 2020). This was the lowest result since the 2008-
2009 crisis. The pandemic and the accompanying recession in the
To calculate the break-even oil price (Pe.v), the following equation first half of 2020 have driven the global economy into a difficult
was used: period. At the end of 2019, a decrease in GDP growth rates was
recorded in almost all major economies and macro regions of the
FC world. Trade conflicts were one of the reasons for the economic
Pe.v VC
E (Q) (1) slowdown. Their settlement has come into question due to new
political tensions in the context of the pandemic.
where VC is the cost per unit of production; FC – fixed costs; E The impact of the COVID-19 outbreak and its adverse impact on
(Q) – volume. the energy market for transport and industry have become the main
reasons for a downward revision of oil consumption forecasts.
The methodology for calculating the operating leverage is as The achieved production level in 2019 will be strongly corrected
follows: in view of the new economic crisis that has begun. The total
global oil demand in 2020 is now expected to reach 99.73 million
E (Q)
( P
VC ) barrels per day (OPEC, 2020). The dynamics of oil production
OL (2)
P
E (Q)
VC
E (Q)
FC and consumption in the world in 2019 are presented in Table 1.
International Journal of Energy Economics and Policy | Vol 11 • Issue 4 • 2021 251Osintseva: Differentiation of Oil Production Break-even Level among World Oil Companies
In 2019, there was a cumulative oil surplus, which was reflected in The highest level of production oil costs is observed in the UK
the behavior of players in the market. According to the International – USD 17.4/bbl., the lowest is in Iraq, USD 1.9/bbl. (Table 2).
Energy Agency (IEA), oil supply in February 2020 versus January
2020 decreased by 0.6 million barrels per day. The main decline in Excluding taxes, the cost of oil production in Russia and other
oil production fell on Libya (–0.7 million barrels per day) and Brazil large producers is USD 10-25 versus USD 40-50 for shale oil
(–0.2 million barrels per day). Commercial stocks of oil and petroleum producers. Despite the success in increasing oil production, most
products in the OECD countries in January 2020 increased by 1.6%. shale oil companies are deliberately unprofitable.
Due to the spread of the coronavirus, the IEA lowered its forecast for
oil demand in 2020 in March, expecting that it will decrease for the 1st The fiscal balance is affected by oil prices (an example of the
time since 2009 (by 90 thousand barrels per day to the level of 2019). variable influence of oil prices for the Russian federal budget is
OPEC also lowered its forecast for growth in oil demand in 2020 from given in Annex). Russia’s 2020 budget is balanced at USD 45
1 million barrels per day to 60 thousand barrels per day (Analytical per barrel for Brent (USD 42 per barrel for Urals), with a budget
Center under the Government of the Russian Federation, 2020). surplus of 0.4% of GDP. At a price of USD 55/bbl., the surplus
will amount to 2.3% of GDP.
The process of oil production is complicated by many factors,
making the cost of oil production varying significantly between According to forecasts for 2020, the fiscal break-even of the oil
countries and regions. A comparative review of oil production price for Saudi Arabia will be USD 78.3 per barrel. The forecast of
costs was carried out by Rystad Energy (Figure 1). the external break-even price for oil in Saudi Arabia for the same
period of time will be USD 58.1/bbl (Statista, 2020b). For Russia,
Saudi Arabia is the world leader in terms of the total cost of the fiscal break-even price for covering government expenditures
one barrel of oil – the cost of production, including taxes, is USD 42/bbl., in Iraq – USD 62.5/bbl., in Saudi Arabia – USD
administrative and transportation costs, is USD 9/bbl. Countries 86.5/bbl., in Iran – USD 155.6/bbl. As a rule, Russia and the
such as Iran and Iraq are also characterized by the lowest total Middle East countries of the Persian Gulf can withstand lower oil
cost of oil production, the cost being USD 9.1/bbl. and USD 10.6// prices for some time due to accumulated savings, opportunities
bbl., respectively. At the same time, Venezuela, with the largest oil for credit borrowing, and policies in regulating exchange rates.
deposits, has a total cost of USD 27.6/bbl., which is explained by The current oil prices are clearly not sufficiently stable, and their
the fact that the overwhelming part of oil deposits is represented level creates certain threats to budget stability. High external
by grades of extra-heavy oil, being more costly. break-even rates indicate this danger (Energy Intelligence, 2020).
A forecast of external breakeven oil prices for 2020-2021 is
Figure 1: Cost of oil production, USD/bbl
presented in Table 3.
The oil price may remain under pressure in the short term, both
due to macroeconomic conditions and due to competition, as large
players will seek to use this situation to increase their market share,
crowding out some players, primarily shale companies (Yudin
et al., 2020). Many countries may be interested in relatively cheap
oil to cut production stimulus spending and accelerate economic
recovery.
Source: Rystad Energy, 2016 Table 2: Structure of oil production costs
Country Costs, USD/bbl. Total
Table 1: Dynamics of oil production and consumption in
Capital Administration/ Production Gross
the world in 2019 (million bbl./day)
transport taxes
Countries 2019 UK 22.7 4.3 17.4 0 44.4
1Q 2Q 3Q 4Q Brazil 16.1 2.8 9.5 6.7 35.1
Production Nigeria 13.1 3 8.8 4.1 29
OPEC 36.2 35.6 35.0 35.3 Venezuela 6.7 2.5 7.9 10.5 27.6
Saudi Arabia 12.1 11.8 11.5 12.0 Canada 9.7 2.9 11.6 2.5 26.7
USA 16.6 17.1 17.2 17.9 USA 7.6 3.5 5.9 6.4 23.4
Russia 11.7 11.5 11.6 11.6 (shale oil)
Other countries 23.5 24.1 24.9 24.8 Norway 13.8 3.1 4.4 0 21.3
World 100.1 100.1 100.2 101.6 USA 7.6 3.5 5.9 6.4 23.4
Consumption (non‑shale
China 13.0 13.7 13.8 14.1 oil)
Europe (OECD) 13.9 14.1 14.6 14.0 Indonesia 7.7 3.6 6.9 1.5 19.7
USA 20.6 20.7 21.0 20.9 Russia 5.1 2.7 3 8.4 19.2
Other countries 51.6 50.7 51.3 51.9 Iraq 5 2.5 2.2 0.9 10.6
World 99.1 99.2 100.7 100.9 Saudi 3.5 2.5 3 0 9
Deficiency (–)/surplus (+) Arabia
World +1 +0.9 ‑0.5 +0.7 Iran 4.5 2.7 1.9 0 9.1
Source: Analytical Center under the Government of the Russian Federation, 2020 Source: Rystad Energy, 2016
252 International Journal of Energy Economics and Policy | Vol 11 • Issue 4 • 2021Osintseva: Differentiation of Oil Production Break-even Level among World Oil Companies
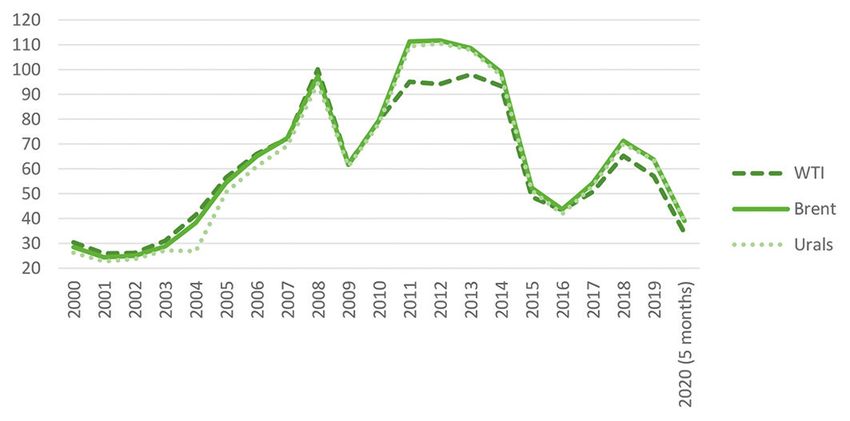
Common brands of oil in the market are WTI, Brent, Urals, etc. In order to identify the effect of Saudi Aramco’s operating leverage
The peak of oil price growth in modern history was in 2011-2014; in 2019, the profit margin was calculated. The company’s gross
since 2014, there has been a progressive decline in oil prices. The margin in 2018 was USD 260.8 billion, in 2019 – USD 205.6
demand for oil brands also changed – the cost of WTI oil until 2010 billion. The operating (gross) profit decreased from USD 238.8
was higher than the cost of Urals and Brent oil, and from 2020 – billion in 2018 to USD 179.9 billion in 2019. Thus, 1% of the
the opposite. In 2020, due to restrictions caused by COVID-19, increase in sales accounted for an increase in profits of 0.85%.
oil prices during exchange trading fell to negative values for the
1st time, forcing a radical revision of the oil pricing process. The ExxonMobil’s revenue from sales in 2019 decreased by 8.49% to
dynamics of the average annual price of oil of the indicated brands USD 255.6 billion. The average crude oil sales price decreased
are shown in Figure 2. from USD 52.7/bbl. to USD 48.6/bbl. The discount of the price
of WTI crude oil to the price of Brent crude oil is 7.9% (OilPrice,
Consider the indicators of the break-even oil price for the global 2020). Variable unit costs decreased by 5.2% to USD 33.1/bbl. The
oil companies (Saudi Aramco, British Petroleum, ExxonMobil, growth rate of operating costs exceeded the growth rate of revenue.
and Rosneft). The break-even selling price of crude oil in 2019 decreased from
USD 35.1/bbl. to USD 33.3/bbl. (Table 5).
Saudi Aramco’s revenue in 2019 decreased by 14.32% compared
to 2018 and amounted to USD 329.8 billion. Saudi Aramco’s In 2018, the gross margin was USD 86.4 billion, in 2019 – USD
operating costs decreased by 2.34% and amounted to USD 146.3 75 billion. The operating profit decreased over this period from
billion. A decrease in revenue was caused by a decrease in the USD 20.8 billion to USD 11.6 billion, respectively. Thus, 1% of
average selling price of crude oil from USD 70/bbl. to USD 64.6/ ExxonMobil’s revenue growth accounted for 0.29% of profit growth.
bbl. The discount of Arab Light oil price to Brent oil price is 19.6%
(OilPrice, 2020). Crude oil sales were down 7.21% to 5,105.3 British Petroleum’s revenues in 2019 decreased by 6.8% to USD 278.4
million barrels. The break-even selling price of crude oil in 2019 billion, operating costs decreased by 4.65% to USD 270.7 billion. The
increased from USD 49.9/bbl. up to USD 52.9/bbl. (Table 4). average crude oil sale price changed over the period from USD 43.5/bbl.
to USD 38.0/bbl. The break-even selling price of crude oil in 2019
decreased from USD 37.0/bbl. to USD 30.9/bbl. (Table 6).
Figure 2: Dynamics of the average annual price of WTI, Brent, and
Urals, USD/bbl Table 4: The main cost indicators of the oil company
Saudi Aramco
Parameter 2018 2019
Variable costs, USD billion 124.1 124.2
Fixed costs, USD billion 22.0 25.7
Average selling price of Urals crude oil, USD/bbl. 70 64.6
Crude oil sales, million barrels 5,496 5,105.3
Break‑even crude oil selling price, USD/bbl. 49.9 52.9
Target comparable price for Brent, USD/bbl. 44.3
Operating leverage strength 0.85
Source: Investing.com, 2020; Saudi Aramco, 2020
Table 5: The main cost indicators of the oil company
Source: Interfax, 2020 ExxonMobil
Parameter 2018 2019
Table 3: Forecast of external break‑even oil prices Variable costs, USD billion 192.9 180.6
Countries External break‑even oil price, USD/bbl. Fixed costs, USD billion 65.6 63.4
Average selling price of Urals crude oil, USD/bbl. 52.7 48.6
2020 2021 Crude oil sales, million barrels 5,512 5,452
Algeria 95.5 109.5 Break‑even crude oil selling price, USD/bbl. 35.1 33.3
Angola 64.7 61.2 Target comparable price for Brent, USD/bbl. 30.9
Equatorial Guinea 76.2 72.2 Operating leverage strength 0.29
Gabonese Republic 66.8 63.8
Source: ExxonMobil, 2020; Investing.com, 2020; Statista, 2020a
Iran 83.3 83.0
Iraq 59.6 57.0
Table 6: The main cost indicators of the oil company
Kazakhstan 63.5 64.7
Kuwait 52.9 48.8 British petroleum
Nigeria 68.1 63.4 Parameter 2018 2019
Oman 84.4 84.6 Variable costs, USD billion 253.7 232.7
Qatar 55.2 53.8 Fixed costs, USD billion 30.1 38.0
Russia 42.0 38.7 Average selling price of Urals crude oil, USD/bbl. 43.5 38
Saudi Arabia 62.7 61.7 Crude oil sales, million barrels 6,866.7 7,563.2
UAE 37.1 36.1 Break‑even crude oil selling price, USD/bbl. 37.0 30.9
Venezuela 26.7 27.9 Target comparable price for Brent, USD/bbl. 30.9
Average, USD/bbl. 62.6 61.8 Operating leverage strength –0.09
Source: Energy Intelligence, 2020 Source: BP, 2020a; Investing.com, 2020
International Journal of Energy Economics and Policy | Vol 11 • Issue 4 • 2021 253Osintseva: Differentiation of Oil Production Break-even Level among World Oil Companies
In 2018, the gross margin was USD 45 billion, in 2019 – USD 45.7 USD 789.65 million, for ExxonMobil – USD 483.78 thousand, for
billion. Operating profit increased by 148.3% to USD 37 billion BP – USD 738.07 thousand, for Rosneft – USD 392.33 million.
because of the negative effect of operating leverage. The opposite situation, when oil prices will be around USD 40/
bbl. will ensure profit only for ExxonMobil and BP in the amount
Rosneft’s revenue from sales in 2019 increased by 2.05% to USD of 44.22 thousand dollars per day and 94.73 thousand dollars per
134.1 billion. The growth rate of revenue exceeded the growth day, respectively. For Saudi Aramco and Rosneft, the oil price level
rate of operating costs. The average crude oil sale price fell from being USD 40/bbl. will not allow making a profit under the current
USD 69.8/bbl. to USD 63.4/bbl. The discount of the price of Urals taxation regimes and the oil production technologies applied.
oil to the price of Brent oil is 8.3%. Unit costs rose by 3.8% to
USD 54.4/bbl. The break-even selling price of crude oil in 2019
5. CONCLUSION
increased from USD 52.7/bbl. up to 54.7 USD/bbl. (Table 7).
The price of oil is one of the most important global financial and
The gross margin changed insignificantly – USD 62.5 billion in
economic indicators, and its fall testifies not only to an economic
2018 against USD 61.1 billion in 2019, while operating profit
decline, but is per se capable of provoking economic crises. The
increased by 17.4% to USD 20.2 billion. A negative value of
factors affecting oil pricing are varied. However, in any case, the
operating leverage indicates a negative rate of change of EBIT.
oil price is within certain boundaries of the price corridor, where
Rosneft’s profit from sales is falling at a faster pace compared to
the break-even level is one of the targets. An analysis of the fiscal
revenue.
break-even of oil prices in the countries of the world’s largest oil
producers showed that the fiscal break-even price of oil production
Taking into account the fact that the average daily oil production
in Russia to cover government spending is significantly lower
in Saudi Aramco in 2020 will amount to 8.5 million barrels per
than in the Gulf countries (48.8% compared to Iraq, twice as low
day (Rambler News Service, 2020); BP – 10.41 thousand barrels
compared to Saudi Arabia and 3.7 times as low compared to Iran).
(BP, 2020b); ExxonMobil – 6.6 thousand barrels; Rosneft in the
The calculation of the target price for large global companies has
context of OPEC arrangements (Prime Business News Agency,
shown that Rosneft (Russia) h the highest price level due to high
2020) – 565.1 thousand tons or 4,142.9 thousand barrels, the
variable costs; the target price for Saudi Aramco (Saudi Arabia)
authors calculated the possible average daily loss/profit of the
considered oil companies under various options for Brent oil is approximately at the same level. For ExxonMobil (USA) and
prices (Table 8). BP (UK), the price target levels are lower. For Saudi Aramco
and Rosneft, the oil price level being USD 40/bbl. will not allow
From the data, it follows that the decline in Brent oil prices to –40 making a profit under the current taxation regimes and the oil
USD/bbl. will lead to an average daily loss for Saudi Aramco of production technologies applied. Thus, Saudi Aramco and Rosneft
are less resistant to price declines. Similarly, this conclusion
applies to ensuring the financial stability of the budget, since the
Table 7: The main cost indicators of the oil company economies of Russia and Saudi Arabia are dependent on the export
Rosneft of mineral wealth. In this context, it is necessary to continue the
Parameter 2018 2019 search for solutions to optimize costs to reduce the break-even
Variable costs, USD billion 68.9 73.0 level of oil production.
Fixed costs, USD billion 45.3 40.9
Average selling price of Urals crude oil, USD/bbl. 69.8 63.4
Crude oil sales, million barrels 1,882.5 2,072.6 REFERENCES
Break‑even crude oil selling price, USD/bbl. 52.7 54.7
Target comparable price for Brent, USD/bbl. 50.4 Adelman, M.A. (1993), The Economics of Petroleum Supply: Papers by
Operating leverage strength –0.13 M.A. Adelman, 1962-1993. United States: MIT Press.
Source: Investing.com, 2020; Rosneft, 2020 Analytical Center under the Government of the Russian Federation.
(2020), Measuring Sustainable Development in the Fuel and Energy
Sector, Energy Bulletin No. 82. Available from: https://www.ac.gov.
Table 8: Average daily loss/profit of oil companies under ru/uploads/2-Publications/energo_march_20.pdf. [Last accessed on
various options for Brent oil prices (from –40 USD/bbl. 2020 Aug 10].
to +40 USD/bbl.), thousand USD BP. (2020a), Annual Report and Form 20-F 2019. Available from: https://
Oil Company www.clck.ru/rphyw. [Last accessed on 2020 Sep 16].
price Saudi ExxonMobil British Rosneft BP. (2020b), Group Results, Fourth Quarter and Full Year 2019. Available
Aramco Petroleum from: from https://www.clck.ru/rpoph. [Last accessed on 2020
–40 –789,650 –483.78 –738.07 –392,333 Aug 06].
–30 –704,650 –417.78 –633.97 –350,904 Brealey, R., Myers, S., Marcus, A., Maynes, E., Mitra, D. (2009),
–20 –619,650 –351.78 –529.87 –309,475 Fundamentals of Corporate Finance. New York: McGraw-Hill
–10 –534,650 –285.78 –425.77 –268,046 Ryerson.
0 –449,650 –219.78 –321.67 –226,617 Caceres, C., Medina, L. (2012), Measures of Fiscal Risk in Hydrocarbon-
10 –364,650 –153.78 –217.57 –185,188 Exporting Countries. IMF Working Paper, International Monetary
20 –279,650 –87.78 –113.47 –143,759 Fund. Available from: https://www.imf.org/external/pubs/ft/
30 –194,650 –21.78 –9.37 –102,330 wp/2012/wp12260.pdf. [Last accessed on 2020 Aug 16].
40 –109,650 44.22 94.73 –60,900.6 Clayton, B., Levi, M.A. (2015), Fiscal Breakeven Oil Prices: Uses,
254 International Journal of Energy Economics and Policy | Vol 11 • Issue 4 • 2021Osintseva: Differentiation of Oil Production Break-even Level among World Oil Companies
Abuses, and Opportunities for Improvement. Available from: https:// and economic condition of the subjects of the oil and gas sector of
www.cfr.org/content/newsletter/files/Breakeven_Oil_Summary.pdf. Russia. Finance and Credit, 9(393), 64-69.
[Last accessed on 2020 Aug 16]. OilPrice. (2020), Oil Price Charts. Available from: https://www.oilprice.
Energy Intelligence. (2020), Break-Even Oil Prices: The Risks of com/oil-price-charts. [Last accessed on 2020 Sep 06].
an Extended Price War for OPEC-Plus. Available from: https:// OPEC. (2020), Available from: https://www.opec.org/opec_web/en. [Last
www.ru.scribd.com/document/454844318/Break-even-Oil-Prices- accessed on 2020 Oct 29].
Summary-pdf. [Last accessed on 2020 Sep 16]. Prime Business News Agency. (2020), Rosneft in 2020 Expects an Oil
ExxonMobil. (2020), Summary Annual Report 2019. Available from: Production Decrease by 24 Million Tons. Available from: https://
https://www.clck.ru/rph5m. [Last accessed on 2020 Aug 16]. www.1prime.ru/energy/20200515/831454783.html. [Last accessed
Garanina, O.L. (2014), Prospects for shale oil production in the United on 2020 Sep 06].
States and implications for the global oil market. Problems of Primova, R. (2015), The EU internal energy market and decarbonization.
National Strategy, 4(25), 185-204. In: Dupont, C., Oberthür, S., editors. Decarbonization in the European
Greenstone, M., Looney, A. (2012), Paying too much for energy? The Union. Energy, Climate and the Environment. London: Palgrave
true costs of our energy choices. Daedalus, 141(2), 10-30. Macmillan.
Gromov, A.I. (2018), The world oil market in the period of global energy Rambler News Service. (2020), Saudi Aramco Announced Oil Supplies
transformation: Expectations and concerns. Energy Policy, 3, 75-86. from May 1. Available from: https://www.finance.rambler.ru/
Grushevenko, D.A., Kulagin, V.A., editors. (2019), Unconventional Oil: business/44024144-saudi-aramco-nazvala-obem-postavok-nefti-s-
Technologies, Economics, Prospects. Moscow: Engineering and 1-maya. [Last accessed on 2020 Sep 06].
Economics Institute of the RAS. p62. Raputsoane, L. (2019), Temporal homogeneity between financial stress
Health Effects Institute. (2015), Strategic Research Agenda on the and the economic cycle. Journal of Eurasian Economic Dialogue,
Potential Impacts of 21st Century Oil and Natural Gas Development 4(2), 18-28.
in the Appalachian Region and Beyond. Available from: http://www. Rau, E.I. (2017), Assessment of the dependence of the GDP of oil
healtheffects.org/uogd/uogd.htm. [Last accessed on 2020 Aug 06]. exporting countries on the change in the factor of oil prices. Bulletin
IHS. (2014), Upstream Spend Report. of the Surgut State University, 1(15), 60-64.
Interfax. (2020), Available from: https://www.interfax.ru. [Last accessed Rosneft. (2020), Financial Results for the Fourth Quarter and 12 Months
on 2020 Sep 06]. of 2019. Available from: https://www.rosneft.ru/press/releases/
Investing. (2020), Commodities. Available from: https://www.investing. item/199847. [Last accessed on 2020 Sep 16].
com/commodities. [Last accessed on 2020 Sep 15]. Rystad Energy. (2016), Available from: https://www.rystadenergy.com.
Isain, N.V. (2015), World oil prices: Monetary, macroeconomic and [Last accessed on 2020 Sep 16].
geopolitical aspects. Energy Policy, 5, 94-102. Saudi Aramco. (2020), Annual Report 2019. Available from: https://www.
Jackson, R.B., Vengosh, A., Carey, J.W., Davies, R.J., Darrah, T.H., clck.ru/rpg9c. [Last accessed on 2020 Sep 16].
O’Sullivan, F., Petron, G. (2014), The environmental costs and Statista. (2020a), Petroleum Product Sales of ExxonMobil’s Downstream
benefits of fracking. Annual Review of Environment and Resources, Division from 2001 to 2019. Available from: https://www.statista.
39, 327-362. com/statistics/264126/petroleum-product-sales-of-exxon-mobils-
Kellogg, R. (2011), Learning by drilling: Interfirm learning and downstream-division. [Last accessed on 2020 Aug 16].
relationship persistence in the texas oilpatch. The Quarterly Journal Statista. (2020b), Value of Breakeven Oil Price in Saudi Arabia from 2000
of Economics, 126(4), 1961-2004. to 2018 with Projections up to 2020, by Account. Available from:
Khudoynatov, Z. (2014), Geopolitical factors of development of the oil https://www.statista.com/statistics/1106014/saudi-arabia-breakeven-
market. Questions of the New Economy, 4(32), 87-91. oil-price-by-account. [Last accessed on 2020 Sep 16].
Kleinberg, R.L. (2014), Technology on the horizon and over the horizon. Toews, G., Naumov, A. (2015), The relationship between oil price and
In: EIA Energy Conference, 15 July 2014. Available from: https:// costs in the oil and gas industry. The Energy Journal, 36(1), 1-26.
www.eia.gov/conference/2014. [Last accessed on 2020 Aug 16]. United States Environmental Protection Agency. (2016), The Social Cost
Kleinberg, R.L., Paltsev, S., Ebinger, C.K.E., Hobbs, D.A., Boersma, T. of Carbon. Available from: https://www3.epa.gov/climatechange/
(2018), Tight oil market dynamics: Benchmarks, breakeven points, epaactivities/economics/scc.html. [Last accessed on 2020 Aug 06].
and inelasticities. Energy Economics, 70, 70-83. Volkonskii, V.A., Kuzovkin, A.I. (2019), Prices and taxes for oil and oil
Kolpakov, A.Y. (2014), Analysis of the relationship between prices and products in the context of long-term development of Russia. Studies
operating costs for oil production. Academic Papers: Institute of on Russian Economic Development, 30, 252-260.
National Economic Forecasting of the RAS, 12, 279-296. Weijermars, R. (2015), Natural resource wealth optimization: A review of
Kuzmin, E.A., Volkova, E.E., Fomina, A.V. (2019), Research on the fiscal regimes and equitable agreements for petroleum and mineral
concentration of companies in the electric power market of Russia. extraction projects. Natural Resources Research, 24, 385-441.
International Journal of Energy Economics and Policy, 9(1), 130-136. World Bank. (2020), World Bank Open Data. Available from: https://
Miciuła, I., Stępień, P. (2019), Analysis of the global market of energy www.data.worldbank.org. [Last accessed on 2020 Oct 28].
resources. In: Bilgin, M., Danis, H., Demir, E., Can, U., editors. Ydyrys, S.S., Baimaganbetov, S.T., Munasipova, M.E. (2018), Study
Eurasian Economic Perspectives. Eurasian Studies in Business and of the influence of world oil prices on the real exchange rate of oil
Economics. Vol. 10/2. Cham: Springer. exporting countries based on panel data. Statistics Accounting and
Mukaydekh, E.A., Mukaydekh, A.R.A. (2017), Structural changes in Audit, 2(69), 163-167.
the system of pricing factors in the world oil market. Bulletin of the Yudin, S., Lutsko, I., Fomkina, I., Khvostik, K., Kosykh, N. (2020), New
educational consortium of the central Russian University. Series: Rules of the Oil Market. Available from: https://www.iticapital.ru/
Economics and Management, 9, 33-37. assets/files/analytics-reviews/article12029.pdf. [Last accessed on
Nurtdinova, G.A. (2010), The influence of the tax burden on the financial 2020 Sep 16].
International Journal of Energy Economics and Policy | Vol 11 • Issue 4 • 2021 255Osintseva: Differentiation of Oil Production Break-even Level among World Oil Companies
ANNEX
Table: Influence of the price factor on the budget balance of Russia
Indicators Oil price (Urals, USD/bbl.)
15 20 25 30 35 40 45 50
Average tax (Mineral extraction tax+export duty), USD/bbl. 0 4.2 8.8 13.3 17.8 22.4 26.9 31.4
Change in taxes (%) 112.0 51.1 33.8 25.3 20.2 16.8
Share of taxes in the price of oil (Urals) 35.3 44.5 51.0 –55.9 59.7 62.8
Oil and gas budget revenues, shock absorbers 16.2 13.8 10.8 8.4 7.2 4.8 3.6 1.1
Additional oil and gas budget revenues, USD billion –42 –36 –24 –15.6 –3.6 4.8 13.2 22.8
% of GDP –3.5 –2.7 –1.7 –1.0 –0.2 0.3 0.8 1.4
Budget deficit/surplus as % of GDP, including damping revenues –8.1 –6.1 –4.4 –2.9 –1.6 –0.5 0.4 1.4
Source: Yudin et al., 2020
256 International Journal of Energy Economics and Policy | Vol 11 • Issue 4 • 2021You can also read