Diffusion tensor imaging (tractography) in elderly people with dementia type Alzheimer's disease and mixed dementia
←
→
Page content transcription
If your browser does not render page correctly, please read the page content below
Revista Mexicana de Neurociencia

                                                                                                                      ORIGINAL ARTICLE

 Diffusion tensor imaging (tractography) in elderly people with
 dementia type Alzheimer’s disease and mixed dementia
 Paulina E. Bombón-Albán1, Alberto J. Mimenza-Alvarado2, Oscar R. Marrufo-Meléndez3,
 Johnatan Rubalcava-Ortega4, Lidia A. Gutiérrez-Gutiérrez5, and Sara G. Aguilar-Navarro6
 1Departament    of Neurology, Neuromedicenter, Quito, Ecuador; 2Departament of Geriatrics, Instituto Nacional de Ciencias Médicas y Nutrición
 Salvador Zubirán (INCMyNSZ), Mexico City; 3Departament of Neuroimaging, Instituto Nacional de Neurología y Neurocirugía Manuel Velasco
 Suárez, Mexico City; 4Departament of Neuroimaging, INCMyNSZ, Mexico City; 5Departament of Neurology, INCMyNSZ, Mexico City; 6Departament
 of Geriatrics, INCMyNSZ, Mexico City. Mexico

      Abstract
      Objective: The objective of the study was to evaluate the characteristics of white matter tracts by diffusion tensor imaging
      (tractography) in elderly people with dementia type Alzheimer’s disease (AD) and mixed dementia through the measurements
      of fractional anisotropy (FA) and mean diffusivity (MD). Methods: Eight patients with AD and eight patients with mixed de-
      mentia were studied. Clinical, cognitive, and neuroimaging evaluation was carried out. Variables are described using the
      arithmetic mean, standard deviations, and frequencies. Chi-square and U Mann–Whitney tests were used. Correlation analy-
      sis was performed between neuropsychological characteristics and the degree of affection by tractography (FA and MD).
      Results: Significant differences were found between the groups of AD versus mixed dementia in FA: right cerebral peduncle
      0.5733 versus 0.5557 (p < 0.05), left cerebral peduncle 0.5744 versus 0.5476 (p < 0.01), right external capsule 0.3619 versus
      0.3346 (p < 0.01), and left cingulum gyrus 0.4049 versus 0.3756 (p < 0.05). MD: right thalamic posterior radiation 0.0016
      versus 0.0010 (p < 0.03) and left external capsule 0.0015 versus 0.0012 (p < 0.03). Conclusion: Using tractography, it is
      possible to quantify the extent of damage to the white matter tracts (vascular and neurodegenerative).

      Key words: Tractography. Fractional anisotropy. Mean diffusivity. Alzheimer’s disease. Mixed dementia.

      Imagen de tensor de difusión (tractografía) en personas mayores con demencia tipo
      enfermedad de Alzheimer y demencia mixta
      Resumen
      Objetivo: Evaluar las características de los tractos de sustancia blanca por imagen de tensor de difusión (tractografía) en
      personas mayores con demencia tipo enfermedad de Alzheimer y demencia mixta, a través de la medición de la fracción
      de anisotropía y la difusividad media. Métodos: Se estudiaron 8 pacientes con demencia tipo enfermedad de Alzheimer y
      8 pacientes con demencia mixta, se realizó evaluación clínica, cognitiva y neuroimagen. Las variables se describen utilizan-
      do media aritmética, desviaciones estándar, Chi-cuadrada y U Mann-Whitney. Se realizó análisis de correlación entre carac-
      terísticas neuropsicológicas y el grado de afección por tractografía (fracción de anisotropía y difusividad media).
      Resultados: Se encontraron diferencias significativas entre los grupos enfermedad de Alzheimer vs. demencia mixta en la
      fracción de anisotropía: pedúnculo cerebral derecho 0.5733 vs. 0.5557 (p < 0.05), pedúnculo cerebral izquierdo 0.5744 vs.

      Correspondence:                                         Date of reception: 29-09-2020                          Available online: 17-03-2021
      *Sara G. Aguilar Navarro                                Date of acceptance: 09-12-2020                  Rev Mex Neuroci. 2021;22(2):42-50
      E-mail: sgan30@hotmail.com                              DOI: 10.24875/RMN.20000106                            www.revmexneurociencia.com
      2604-6180/ © 2020 Academia Mexicana de Neurología A.C. Published by Permanyer. This is an open access article under the CC BY-NC-ND license
      (http://creativecommons.org/licenses/by-nc-nd/4.0/).

42
P.E. Bombón-Albán, et al.: Tractography in dementia type Alzheimer’s disease and mixed dementia
0.5476 (p < 0.01), cápsula externa derecha 0.3619 vs 0.3346 (p < 0.01) y giro del cíngulo izquierdo 0.4049 vs 0.3756
(p < 0.05). Difusividad media: radiación posterior talámica derecha 0.0016 vs. 0.0010 (p < 0.03) y cápsula externa izquierda
0.0015 vs. 0.0012 (p < 0.03). Conclusión: Mediante la tractografía es posible cuantificar la magnitud de daño de los tractos
de la sustancia blanca (vascular y neurodegenerativo).
Palabras clave: Tractografía. Fracción de anisotropía. Difusividad media. Enfermedad de Alzheimer. Demencia mixta.
Introduction addition to other possible combinations11. From a clin-
ical viewpoint, loss of memory (especially episodic and
Tractography is used to correlate the integrity of white
semantic) is considered a typical feature of AD, where-
matter tracts with cognitive function in cognitively
as executive dysfunction has traditionally been associ-
healthy people and with dementia1. It is a special tech-
ated with MixD. Several MRI analysis methods can
nique of simple magnetic resonance imaging (MRI),
track structural atrophy in AD and the presence of
which consists of non-invasive diffusion tensor imaging
ischemic lesions on computed tomography or MRI is
(DTI), sensitive to the diffusion of water molecules2,
key in the diagnosis of individuals with MixD9.
which allows a live three-dimensional reconstruction of
Populations with high cardiovascular risk, patterns
the tracts within the central nervous system1,3. The fi-
are more frequently observed cognitive skills of mixed
bers of white matter are classified into three categories:
type and the pure forms of dementia or sole are not
(a) association fibers: those that interconnect cortical
the first diagnostic option in older subjects with mem-
areas of the same hemisphere, (b) commissural fibers:
ory complaints. This aspect is important because the
interconnect areas between both hemispheres, and (c)
adequate identification of these potentially risk factors
projection fibers, which connect the cortex with forma-
modifiable could help intervene in an entity still without
tions of lower levels4.
The interruption of the tracts can be detected as a a definitive therapeutic route9. Accurate diagnosis of
decrease in fractional anisotropy (FA) (diffusion orien- AD and MixD is of crucial significance for epidemio-
tation and directionality) and an increase in mean dif- logical purposes and for preventive and therapeutic
fusivity (MD) (degree of water diffusion)1,4,5,6. An strategies12.
anisotropy of “0” corresponds to a perfect sphere, while The objective of our study was to evaluate the char-
1 would be an ideal linear diffusion. Well-defined tracts acteristics of white matter tracts by DTI (tractography)
generally have an FA greater than 0.21,6,7. Preliminary in elderly people with dementia type AD and MixD
studies show a decrease in white-matter connections through the measurements of FA and MD.
in patients with Mild cognitive impairment and Alzhei-
mer’s disease (AD). Especially noticeable is the in- Methods
creased MD and decreased FA in these patients
compared to normal controls. These changes were Type of study and patients
found in the posterior cingulate fasciculus, the uncinate
fasciculus, or both at once1. Cross-sectional study carried out in a memory disor-
AD is the most common neurodegenerative disorder der clinic of a third-level hospital in Mexico City. All the
that causes dementia in elderly individuals. The cause patients were recruited in a period from March 2019 to
of AD is unknown in most cases. The most powerful December 2019. They all signed a consent form and
risk factor for developing AD is age, with AD affecting underwent clinical and cognitive evaluations by a spe-
as many as 40-50% of individuals older than 85 years8. cialist in neurology and/or geriatrics. From the compre-
Mixed dementia (MixD) represents the third leading hensive geriatric evaluation, sociodemographic variables
cause of dementia, only behind AD and vascular de- were obtained such as sex, age, education, Katz In-
mentia (VaD). The prevalence range of MixD varies dex13, Lawton and Brody Scale14, and Yesavage Geriat-
between 20% and 40%9,10. The Vascular Impairment of ric Depression Scale (GDS)15. The neuropsychological
Cognition Classification Consensus Study (VICCCS) evaluation consisted of applying the NEUROPSI test16,
proposes in its classification of vascular cognitive im- Mini-Mental State Examination (MMSE)17, verbal fluency
pairment (VCI) the definition of MixD, which includes test18, clock-drawing test19, frontal assessment battery
phenotypes that represent the combination of vascular (FAB)20, and the Clinical Dementia Rating (CDR)
and neurodegenerative diseases, that is, VCI-AD, in Scale21.
43Rev Mex Neuroci. 2021;22(2)
Patients with visual and auditory acuity deficits that a certain distance until a new direction of propagation is
would make it impossible to apply neuropsychological found with the help of the orientation of neighboring
tests were excluded, as well as patients with dysthy- voxels. From here on, it continues iteratively, adding a
roidism (hyper or hypothyroidism) without treatment, new segment to each step, thus forming a path with the
hypertension, dyslipidemia and/or uncontrolled diabe- points in each step3,25. The basis of the anisotropic dif-
tes mellitus, and those with glycosylated hemoglobin fusion of water in the nervous system is due to the in-
levels higher than 9%, patients with severe hypoglyce- volvement of longitudinally oriented structures within the
mia, other causes of dementia (vascular, frontotempo- axons, such as myelin, axonal membrane, microtubules,
ral, Lewy bodies), other uncontrolled medical conditions neurofilaments, or axonal transport, which hinders the
(cardiovascular, renal, or advanced lung disease), in- diffusion of water. MD measures the extent of diffusion
flammatory diseases, active smokers, patients with sig- in a voxel; the increase in MD may be related to a loss
nificant depressive symptoms (GDS score > 5/15), CDR of coherence in fiber alignment, a lower fiber density, or
> 1, and the presence of metallic objects, devices, or a loss of myelination1,6,8.
conditions that would make MRI impossible. The images obtained from DTI were assigned to
maps of FA and MD, the tracts were established using
Clinical diagnosis of dementia JHU White Matter Tractography Atlas. A standard color
scheme was used in the software to encode the FA
The patients were classified into two groups: AD maps, with blue indicating superior-inferior, red indicat-
n = 8 and MixD n = 8, according to their performance
ing transverse, and green indicating anterior-posterior26.
in neuropsychological evaluation and current clinical
Tracts were created in the Diffusion Toolkit using the
criteria. For the diagnosis of dementia type AD, the
Continuous Tracking Fiber Assignment method with 35°
criteria of the Diagnostic and Statistical Manual of Men-
angle threshold and a unique set of fibers was gener-
tal Disorders version 5 (American Psychiatric Associa-
ated for each patient by performing anatomically de-
tion DSM-5)22 and the criteria of the National Institute
tailed analysis. It was decided to study tracts that
of Neurological and Communicative Disorders and
correspond to association, commissural and projection
Stroke – Alzheimer’s Disease and Related Disorders
fibers (16 brains, 48 regions of interest – ROI). Mean
Association (NINCDS-ADRDA)23 were used. For the
values of FA and MD were analyzed for each tract,
diagnosis of MixD, the VICCCS11 criteria were used.
these being the most important indices for determining
For the dementia stage, the CDR score (Mild = 1) was
dementia according to the previous studies1,6. In
applied in both conditions.
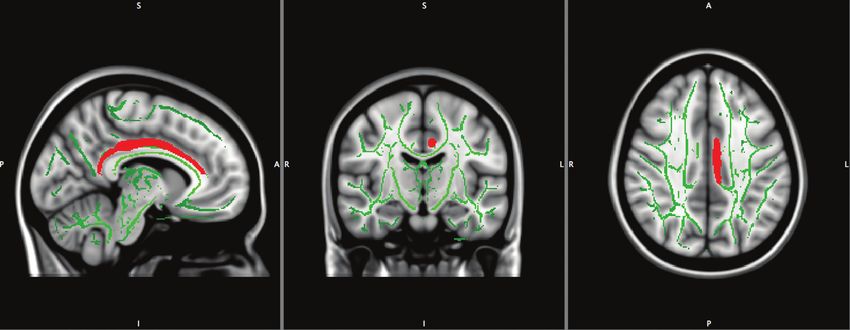
Figure 1, an example of the tract obtained with the pro-
posed protocol is shown, where the cingulum is seen in
Magnetic resonance DTI (tractography) red, corresponding to the left cerebral hemisphere.
All patients had a simple brain MRI, with T1 sequence
with DTI and volumetry. The images were obtained with Structural MRI
a 1.5T resonator (Siemens® Medical Systems). Image
processing was performed by the Neuroimaging Depart- Cortical thickness studies
ment of the National Institute of Medical Sciences and
Nutrition, Salvador Zubirán (INCMNSZ). The MRI was The T1 images were processed with the FreeSurfer
evaluated by a neuroradiologist (not knowing of patients 5.3 program, which is capable of constructing models
being in the clinical group). A high-resolution anatomical of the cortical surface of the nervous system. This soft-
scanner was used with a T1-weighted three-dimensional ware works in an automated way and the process con-
magnetization sagittal sequence, prepared with fast gra- sists of registering the input volumes determined by the
dient echo (MP-RAGE), field of view (FoV) 26 mm, spa- user to the atlas MNI305 (Montreal National Institute),
tial resolution 1 × 1 × 1 mm3, repetition time of 1500 ms then it performs an intensity normalization and a seg-
(TR), echo time (TE), rotation angle 9°, number of cuts mentation of the voxels according to this parameter and
176, with 25 independent diffusion gradient direc- their spatial location to classify them in different types
tions1,4,5,24. The process to perform the tractography be- of tissue: gray matter, white matter, and cerebrospinal
gins with the definition of an origin point (also called fluid27. For the present study, cerebral cortex was divid-
seed point), and the reconstruction process, which con- ed into 48 ROIs based on turns per hemisphere, and
sists of taking the orientation of the voxel and advancing in this manner, the geometric information derived from
44P.E. Bombón-Albán, et al.: Tractography in dementia type Alzheimer’s disease and mixed dementia
Figure 1. Left cingulum tractography (red).
the cortical model with the labels of the neuroanatom- evaluation. Variables with a value of p < 0.05 were tak-
ical parceling is incorporated. en as significant.
The entire protocol was acquired during a single SPSS version 22 for Windows® (SPSS Inc., Chicago,
25-min session, where the patient’s brain was aligned Illinois) was used for the analyses. The protocol was ap-
in the stereotactic space: the anterior commissure-pos- proved by the institutional Ethics Committee (REF. 3009).
terior commissure line was aligned with the axial plane,
and the interhemispheric fissure was aligned along the
sagittal plane and at right angles to the coronal plane. Results
The average age of the AD group members was 84.3
Statistics analysis ± 8.8 years old and of the MixD group, it was 85.3 ±
7.6 years old (p < 0.57) and 69% were women (p < 0.23).
The variables are described by using arithmetic The average schooling of AD patients was 10.2 ± 7.3
mean and standard deviations. The Chi-square test and of MixD was 11.3 ± 4.8 (p < 0.87). In the AD group,
was used for categorical variables and the Mann–Whit-
38% were hypertensive versus 100% in MixD (p < 0.00)
ney U test was used for continuous variables. Clinical
and none had obesity in the AD group versus 38% in
and demographic data were tested for normality using
MixD (p < 0.05). Regarding the global neuropsycholog-
a Shapiro–Wilk test. The voxel statistics in the skele-
ical assessment, patients with AD had a worse cogni-
tonized images were performed using the randomized,
tive performance in the cognitive assessment
an FSL tool for nonparametric permutation inference in
(NEUROPSI) 68.5 ± 11.6 points compared to the MixD
neuroimaging data. The carcass of mean FA (threshold
0.2) was used as a mask, the permutation number was group 83.2 ± 12.4 (p < 0.02) (Table 1).
set at 5000, meaning the difference between groups
was corrected for multiple comparisons using the DTI (Tractography)
no-threshold cluster enhancement method (TFCE) and
tested a p < 0.01. To identify the power of the selected Regarding the tractography findings, significant dif-
brain areas to discriminate between AD and MixD, a ferences were found in FA between the AD versus
stepwise discriminant analysis was performed using MixD groups in the following tracts: right cerebral pe-
the dementia subgroup (AD or MixD) as the dependent duncle 0.5733 versus 0.5557 (p < 0.05), left cerebral
variable and the mean values of ROI of FA and MD as peduncle 0.5744 versus 0.5476 (p < 0.01), right external
independent variables. Finally, by means of a Spear- capsule 0.3619 versus 0.3346 (p < 0.01), and left cin-
man correlation, the differences between the charac- gulum gyrus 0.4049 versus 0.3756 (p < 0.05). Regard-
teristics of the microstructure of the brain regions were ing MD, the differences found were in the following
searched in FA, MD, and the neuropsychological tracts: right thalamic posterior radiation 0.0016 versus
45Rev Mex Neuroci. 2021;22(2)
Table 1. Sociodemographic characteristics and cognitive performance in Alzheimer’s disease and mixed dementia
Total patients (n = 16) Alzheimer’s disease (n = 8) Mixed dementia (n = 8) p
Age years 84.8 ± 7.9 84.3 ± 8.8 85.3 ± 7.6 0.57
Sex (Female) % (11) 69 (4) 25 (7) 44 0.23
Years of education, % 10.8 ± 6.0 10.2 ± 7.3 11.3 ± 4.8 0.87
Hypertension % (11) 69 (3) 38 (8) 100 0.00
Mellitus diabetes % (3) 19 (1) 13 (2) 25% 0.52
Heart disease % (4) 25 (1) 13 (3) 38 0.24
Cerebral vascular event % (1) 6 (0) 0 (1) 13 0.30
Dyslipidemia % (9) 56 (3) 38 (6) 75 0.13
Hypothyroidism % (4) 25 (1) 13 (3) 38 0.24
Obesity % (3) 19 (0) 0 (3) 38 0.05
History depression % (4) 25 (2) 25 (2) 25 1.00
GDS – 15 2.0 ± 1.5 2.6 ± 1.5 2.2 ± 1.6 0.72
Functionality
KATZ 6.0 ± 0.2 6 ± 0.0 5.8 ± 0.3 0.72
LB 6.5 ± 2.5 5.3 ± 2.9 5.2 ± 2.3 0.72
NEUROPSI total 75. 8 ± 13.9 68.5 ± 11.6 83.2 ± 12.4 0.02
Orientation 4.0 ± 1.7 5.1 ± 1.3 2.8 ± 1.4 0.02
Attention 13.8 ± 5.2 13.88 ± 4.9 13.75 ± 5.8 0.72
Memory 20.6 ± 5.4 23.3 ± 4.9 17.8 ± 4.7 0.03
Language 23.1 ± 4.1 21.7 ± 5.1 24.5 ± 2.6 0.23
Visuospatiality/visuospatiality 9.22 ± 1.5 9.1 ± 1.6 9.3 ± 1.6 0.87
Executive functions 11.5 ± 3.5 11.8 ± 3.6 11.2 ± 3.6 0.50
MMSE 22.5 ± 3.2 22.6 ± 3.2 22.5 ± 3.5 0.03
Semantic verbal fluency (animals) 11.0 ± 3.8 13.0 ± 2.8 9.1 ± 3.8 0.06
Phonological verbal fluency (letter F) 8.9 ± 3.8 10.6 ± 4.0 7.0 ± 3.5 0.05
Clock-drawing test 2.3 ± 1.7 2.5 ± 2.0 2.13 ± 1.3 0.95
FAB 12.4 ± 3.2 12.88 ± 3.9 12.0 ± 2.5 0.44
GDS - 15: Yesavage Geriatric Depression Scale; LB: Lawton and Brody scale; MMSE: Mini-Mental State Examination; FAB: front evaluation battery.
0.0010 (p < 0.03) and capsule left external capsule orientation and left cingulate gyrus with a Rho of 0.73
0.0015 versus 0.0012 (p < 0.03) (Table 2). (p < 0.04), memory and left cerebral peduncle with a Rho
of −0.70 (p < 0.05), and phonological fluency and left ce-
rebral peduncle with a Rho of −0.72 (p < 0.04) (Table 3).
Correlations between cognitive domains
and DTI parameters
Cortical thickness studies
A correlation was observed between the cognitive do-
mains and the tractography parameters (FA and MD) in In the volumetric analysis, significant differences
both groups, finding a moderate correlation in the AD were found in the following ROIs between AD and
group between orientation and left cerebral peduncle with MixD: Brain segmentation volume 964.92 cm3 versus
a Rho of 0.72 (p < 0.04); in the MixD group between 877.95 cm3 (p < 0.02), brain segmentation volume
46P.E. Bombón-Albán, et al.: Tractography in dementia type Alzheimer’s disease and mixed dementia
Table 2. Comparison of tracts, fractional anisotropy, and mean diffusivity in Alzheimer’s disease and mixed dementia
Total Patients (n = 16) Alzheimer’s disease (n = 8) Mixed Dementia (n = 8) p
Fractional anisotropy
Right cerebral peduncle 0.5645 ± 0.0172 0.5733 ± 0.0176 0.5557 ± 0.0121 0.05
Left cerebral peduncle 0.5610 ± 0.0215 0.5744 ± 0.0209 0.5476 ± 0.0121 0.01
Right external capsule 0.3483 ± 0.0246 0.3619 ± 0.0246 0.3346 ± 0.0163 0.01
Left cingulum gyrus 0.3902 ± 0.0271 0.4049 ± 0.0224 0.3756 ± 0.0241 0.05
Mean diffusivity
Right thalamic posterior radiation 0.0013 ± 0.0004 0.0016 ± 0.0005 0.0010 ± 0.0000 0.03
Left external capsule 0.0013 ± 0.0003 0.0015 ± 0.0003 0.0012 ± 0.0001 0.03
Table 3. Spearman correlation between neuropsychological testing and DTI parameters in Alzheimer’s disease and
mixed dementia
Alzheimer’s disease Mixed dementia
Orientation Memory Fluency Orientation Memory Fluency
phonological phonological
Rho p Rho p Rho p Rho p Rho P Rho p
Fractional anisotropy
Right cerebral peduncle 0.31 0.44 0.03 0.93 −0.10 0.81 0.11 0.78 −0.32 0.43 −0.36 0.37
Left cerebral peduncle 0.72 0.04 0.07 0.86 −0.07 0.86 −0.27 0.51 −0.70 0.05 −0.72 0.04
Right external capsule 0.34 0.40 −0.27 0.50 −0.35 0.39 0.07 0.85 −0.18 0.67 −0.44 0.26
Left cingulum gyrus 0.60 0.11 −0.10 0.79 −0.12 0.76 0.73 0.04 0.25 0.54 0.32 0.43
Mean diffusivity
Right thalamic posterior radiation −0.16 0.69 −0.12 0.77 −0.10 0.81 −0.39 0.33 0.24 0.56 0.21 0.60
Left external capsule −0.46 0.25 −0.20 0.62 −0.12 0.76 −0.54 0.16 −0.46 0.24 −0.27 0.50
without ventricles 904.25 versus 837.76 (p < 0.01), brain left cingulate gyrus, and right thalamic posterior radia-
segmentation volume without ventricles from surf tion compared to patients with MixD.
903.46 versus 837.16 (p < 0.01), right hemisphere ce- Palesi et al. demonstrated in a tractography study in
rebral white matter volume 184.52 versus 168.32 patients with DVa, AD, and a control group that patients
(p < 0.03), subcortical gray matter volume 46.06 versus with AD had a greater affection in the parahippocampal
42.10 (p < 0.05), total volume of gray matter 514.03 tracts and in the knee of the corpus callosum, while pa-
versus 479.94 (p < 0.01), total intracranial volume tients with DVa showed a greater affection of white mat-
1471.92 versus 1324.38 (p < 0.05), left thalamus 5.86 ter in thalamic radiation28. Reginold et al., in a study
versus 5.37 (p < 0.02), left caudate 3.5 versus 2.71 which objective was to evaluate the affection of white
(p < 0.02), fourth ventricle 2.14 versus 1.54 (p < 0.05), matter in patients with AD, demonstrated a greater com-
right caudate 4.01 versus 2.90 (p < 0.02), and right mitment in the superficial white matter of the temporal
choroid plexus 0.92 versus 0.71 (p < 0.03) (Table 4). lobe than in the members of a control group25.
Tu et al. compared DTI parameters in members of a
control group, patients with AD and subcortical isch-
Discussion
emic vascular disease (SIVD; also called lacunar in-
Our study compared patients with AD and MixD farction), reporting a global decrease in FA in patients
through a standardized acquisition protocol to investi- with SIVD; while in patients with AD, the alterations
gate the parameters of FA and MD in terms of changes were in the left superior longitudinal bundle, knee and
in the anisotropy or magnitude of water diffusion splenium of the corpus callosum, anterior thalamic
throughout the brain, demonstrating that patients with radiation, uncinate bundle, and left cingulate gyrus,
AD have alterations in specific tracts, such as right and suggesting that DTI is effective in distinguishing pa-
left cerebral peduncle, right and left external capsule, tients with early stage of AD versus SIVD29. Another
47Rev Mex Neuroci. 2021;22(2)
Table 4. Volumetry in regions of interest in Alzheimer’s disease and mixed dementia
Total patients Alzheimer’s disease Mixed dementia p
(n = 16) (n = 8) (n = 8)
Brain segmentation Volume, cm3 921,44 ± 76.83 964.92 ± 69.93 877.95 ± 58.61 0.02
Brain segmentation volume without ventricles, cm3 871.00 ± 58.93 904.25 ± 47.37 837.76 ± 51.68 0.01
Brain segmentation volume without ventricles from surf, cm3 870.31 ± 58.87 903.46 ± 47.38 837.16 ± 51.67 0.01
Right hemisphere cerebral white matter volume, cm3 176.42 ± 16.08 184.52 ± 14.60 168.32 ± 13.83 0.03
Subcortical gray matter volume, cm3 44.08 ± 3.81 46.06 ± 3.36 42.10 ± 3.30 0.05
Total volume of gray matter, cm3 496.99 ± 34.42 514.03 ± (24.91) 479.94 ± 35.42 0.01
Total intracranial volume, cm3 1398.15 ± 150.91 1471.92 ± 118.28 1324.38 ± 149.58 0.05
Left thalamus, cm 3
5.62 ± 0.43 5.86 ± 0.39 5.37 ± 0.33 0.02
Left caudate, cm3 3.11 ± 0.69 3.5 ± 0.64 2.71 ± 0.47 0.02
Fourth ventricle, cm3 1.84 ± 0.53 2.14 ± 0.45 1.54 ± 0.45 0.05
Right caudate, cm 3
3.45 ± 0.10 4.01 ± 0,24 2.90 ± 0.51 0.02
Right choroid plexus, cm3 0.82 ± 0.25 0.92 ± 0.27 0.71 ± 0.21 0.03
study by Lee et al., which compared control group methods used but also on the particular morphological
members, patients with MCI and AD, showed that the process, the anatomical region being studied, and pos-
latter group had a greater decrease in FA, as well as sibly the underlying molecular pathology of the disease
lower integrity of white matter associated with a lower in particular27. One aspect of techniques for detecting
hippocampal volume, indicating that the pathology in changes in white matter tracts is that they are more
white matter follows the same degree of stages and sensitive than measurements of cortical thickness or
progression of neurodegeneration30. integrity; this is justified because the loss of cortical
Another finding in our study was the combined affec- volume in neurodegenerative disease probably rep-
tion of tracts corresponding to neurodegeneration (turn resents the loss of individual neurons (soma) and neu-
of the left cingulum, cerebral peduncles)31, as well as ropil (corresponding dendrites, axons)4,28.
areas related to the vascular component (thalamic ra- Regarding the cognitive domains and the affected
diation)25, a combination only observed, in our study, in tracts, we found an association between FA and orien-
patients with MixD. These alterations are the result of tation (left cerebral peduncle) in patients with a diagno-
changes in axonal density and myelination since the sis of AD; this anatomical structure is considered a
homogeneity in the orientation of the axons affects the vulnerable area from the vascular point of view34, in
degree of FA and MD in DTI, so a decrease in FA and addition, it is related to changes in AD29. An association
an increase in MD reflect a decrease in the integrity of was also observed between FA and the orientation
the brain tissue1,6,32. An important aspect to consider is domains (left cingulate), as well as in-memory and pho-
the fact that the vascular load in white matter in patients nological fluency (left cerebral peduncle) in patients
with MixD could be a potential confounder, similar to with MixD; these findings show that there is a discon-
other DTI studies in neurodegenerative diseases. nection of areas related to cortical memory (left cingu-
In relation to the results of volumetry, a lower volume late) since this structure is a fundamental part of the
was observed in twelve ROIs in patients with MixD. limbic system and one of the main fascicles of white
Some studies have established a correlation between matter that connects areas of cortical association35.
DTI parameters and volumetric parameters, indicating Our results suggest that DTI allows the identifica-
that these are measures of the same pathological pro- tion of alterations in specific tracts (cerebral peduncle
cess, that is, neurodegeneration33. The relative change and cingulate) in patients with AD compared to pa-
in the parameters that reflect cortical integrity and dif- tients with MixD. This shows that MixD shares a spec-
fusion is likely to vary not only depending on the trum of neurodegeneration (due to the affection of
48P.E. Bombón-Albán, et al.: Tractography in dementia type Alzheimer’s disease and mixed dementia
classic tracts affected in AD) but with alterations (de- Conflicts of interest
crease) in FA.
None.
The limitations of our study are based on the
cross-sectional design, which does not allow the inter-
pretation of the causal mechanisms underlying the as- Ethical disclosures
sociations of MRI and cognitive measurements. Another
Protection of human and animal subjects. The
important aspect is the size of the sample since this
authors declare that no experiments were performed
could limit the ability to detect more differences in DTI
on humans or animals for this study.
between patients with AD and MixD. Although there are
Confidentiality of the data. The authors declare
various computer programs available that allow tractog-
that they have followed the protocols of their work cen-
raphy to be carried out, some even free to use for re-
ter on the publication of patient data.
search purposes, the results obtained with one or the
Right to privacy and informed consent. The au-
other may vary, either due to the algorithm they use or
thors declare that no patient data appear in this
due to their processing, since the reproducibility de- article.
pends to some degree on the user’s interaction with the
computer program. In multicenter studies, there are also
variations due to different MRI equipment and the pro- References
tocol used to acquire DTI images; these can influence 1. Larroza A, Moratal D, D’ocón V, Arana E. Tractografía del fascículo
uncinado y el fascículo uncinado posterior en pacientes con deterioro
the quantification of the results using tractography, as cognitivo leve y enfermedad de Alzheimer. Neurology. 2014;29:11-20.
2. Vilanova A, Zhang S, Kindlmann G, Laidlaw D. An introduction to visualization
mentioned by Fischer et al. and Heiervang et al., who of diffusion tensor imaging and its applications. Vis Appl. 2006;15:121-53.
found differences in the quantification of the cerebral 3. Lazar M. Mapping brain anatomical connectivity using white matter trac-
tography. NMR Biomed. 2010;23:821-35.
fascicles applying different diffusion gradients. 4. Reginold W, Luedke A, Itorralba J, Fernandez J, Islam O, García A, et al.
Altered superficial white matter on tractography MRI in Alzheimer’s di-
Our study has several strengths: it is the first study sease. Dement Geriatr Cogn Disord Extra. 2016;6:233-41.
to describe tractography characteristics and their asso- 5. Kvickström P, Eriksson B, Van Westen D, Lätt J, Elfgren C, Nilsson C.
Selective frontal neurodegeneration of the inferior fronto-occipital fasci-
ciation with cognitive performance in elderly adults with culus in progressive supranuclear palsy (PSP) demonstrated by diffusion
AD and MixD. Our findings could lead to future studies tensor tractography. BMC Neurol. 2011;11:1-8.
6. Acosta J, Guy B, Pengas G, Peter J. Absolute diffusivities define the
in which MixD can be characterized better and the role landscape of white matter degeneration in Alzheimer’s disease. Brain.
2010;133:529-39.
of tractography and volumetry can be understood more 7. Le Bihan D. Looking into the functional architecture of the brain with di-
clearly. ffusion MRI. Nat Rev Neurosci. 2003;4:469-80.
8. Brickell KL, Steinbart EJ, Rumbaugh M, Haydeh P, Schellenberg G, Van
Our results support existing findings reported in the Deerlin V, et al. Early-onset Alzheimer disease in families with late-onset
Alzheimer disease: a potential important subtype of familial Alzheimer
literature and, most importantly, provide a complete disease. Arch Neurol. 2006;63:1307-11.
interpretation of microstructural alterations in the white 9. Moreno C, Mimenza J, Aguilar S, Alvarado P, Gutiérrez L, Juárez S, et al.
Factores asociados a la demencia mixta en comparación con la demencia
matter through the spectrum of dementia type AD and tipo Alzheimer en adultos mayores mexicanos. Neurology. 2017;32:309-15.
10. Korczyn A. Mixed dementia: the most common cause of dementia? Can
MixD using the tractography technique with parametric J Diagn. 2010;9:25-44.
analysis, and it could provide a useful standard for the 11. Skrobot O, O’Brien J, Black S, Chend C, DeCarlie C, Erkinjunttif T, et al.
Progress toward standardized diagnosis of vascular cognitive impair-
early diagnosis of AD and MixD in the future. ment: guidelines from the vascular impairment of cognition classification
consensus study. Alzheimers Dement. 2018;14:280-92.
12. Zekry D, Hauw JJ, Gold G. Mixed dementia: epidemiology, diagnosis,
and treatment. J Am Geriatr Soc. 2002;50:1431-8.
Conclusion 13. Katz S, Akpom CA. Index of ADL. Med Care. 1976;14:116-8.
14. Lawton MP, Brody EM. Assessment of older people: self-mantaining and
instrumental activities of daily living. Gerontologist. 1969;9:179-86.
Tractography is an effective method to distinguish 15. Sheikh JI, Yesavage JA. Geriatric depression scale (GDS): recent eviden-
alterations in brain tracts through the measurement of ce and development of a shorter version. Clin Gerontol. 1986;5:165-72.
16. Ostrosky-Solis F, Ardila A, Rosselli M. NEUROPSI: a brief neuropsycho-
the anisotropy fraction since these alterations show that logical test battery in Spanish with norms by age and educational level.
J Int Neuropsychol Soc. 1999;5:413-33.
MixD shares a spectrum of neurodegeneration and 17. Folstein M, Folstein S, McHugh P. Mini-mental state. A practical method
vascular affection. for grading the cognitive state of patients for the clinician. J Psychiatr
Res 1975;12:189-98.
18. Lima E. Role of neuropsychological assessment in the differential diag-
nosis of Alzheimer’s disease and vascular dementia. Dement Neuropsy-
Funding chol. 2009;3:214-21.
19. Aguilar S, Mimenza A, Samudio M, Hernández F, Gutiérrez L, Ramírez F,
et al. Validation of the clock drawing test scoring method in older adults
This research received no specific grant from any with neurocognitive disorder. Salud Ment. 2018;41:179-86.
funding agency in public, commercial, or not-for-profit 20. Rodríguez A. FAB: aplicación preliminar española de la batería neurop-
sicológica de evaluación de funciones frontales a 11 grupos de pacientes.
sectors. Rev Neurol. 2003;36:605-8.
49Rev Mex Neuroci. 2021;22(2)
21. Morris JC. The clinical dementia rating (CDR): current version and sco- 28. Palesi F, De Rinaldis A, Vitali P, Castellazzi G, Casiraghi L, Germani G,
ring rules. Neurology. 1993;43:2412-4. et al. Specific patterns of white matter alterations help distinguishing Al-
22. Guía de Consulta de los Criterios Diagnósticos del DSM-5®. Spani- zheimer’s and vascular dementia. Front Neurosci. 2018;274:1-14.
sh Edition of the Desk Reference to the Diagnostic Criteria From 29. Chien M, Chung-Ping L, Ching-Feng H, Yen-Hsuan H, Wen-Hui H,
DSM-5®. Philadelphia, PA: American Psychiatric Publisher; 2014. Deng J, et al. Effectiveness of diffusion tensor imaging in differentiating
p. 314-5. early-stage subcortical ischemic vascular disease, Alzheimer’s disease
23. McKhann G, Drachman D, Folstein M, Katzman R, Price D, Stadian and normal ageing. PLoS One. 2017;12:e0175143.
EM. Clinical diagnosis of Alzheimer’s disease; report of the 30. Seung L, Coutua J, Wilkensa P, Yendikia A, Rosasa D, Salata D, et al.
NINCDS-ADRDA work group under the auspices of department of heal- Tract-based analysis of white matter degeneration in Alzheimer’s disea-
th and human services task force on Alzheimer’s disease. Neurology. se. Neuroscience. 2015;20:79-89.
1984;34:939-44. 31. Canu E, McLaren D, Fitzgerald M, Bendlin B, Zoccatelli G, A lessandrini F, et
24. Reginold W, Itorralba J, Luedke A, Fernandez-Ruiz J, Reginold J, al. Mapping the structural brain changes in Alzheimer’s disease: the indepen-
Islam O, et al. Tractography at 3T MRI of corpus callosum tracts dent contribution of two imaging modalities. J Alzheimers Dis 2011;26:263-74.
crossing white matter hyperintensities. Am J Neuroradiol. 32. Alves G, Oertel V, Knöchel C, Carvalho A, Pantel J, Engelhardt E, et al.
2016;37:1617-22. Integrating retrogenesis theory to Alzheimer’s disease pathology: insight
25. Reginol W, Luedke A, Tam A, Itorralba J, Fernandez J, Reginold J, et al. from DTI-TBSS investigation of the white matter microstructural integrity.
Cognitive function and 3-tesla magnetic resonance imaging tractography Biomed Res Int. 2015;2015:291658.
of white matter hyperintensities in elderly persons. Dement Geriatr Cogn 33. Avants B, Cook P, Ungar L, Gee J, Grossman M. Dementia induces
Disord Extra. 2015;5:387-94. correlated reductions in white matter integrity and cortical thickness: a
26. Sedrak M, Gorgulho A, Bari A, Behnke E, Frew A, Gevorkyan I, et al. multivariate neuroimaging study with sparse canonical correlation analy-
Diffusion tensor imaging (DTI) and colored fractional anisotropy (FA) sis. Neuroimage 2010;50:1004-16.
mapping of the subthalamic nucleus (STN) and the globus pallidus inter- 34. Narayana S, Glikstein R, Hanagandil P, Chakraborty S. Role of neuroi-
na (GPi). Acta Neurochir (Wien). 2010;152:2079-84. maging in multidisciplinary approach towards non-Alzheimer’s dementia.
27. Santillo A, Martensson J, Lindberg O, Nilsson M, Manzouri A, Insights Imaging 2015;6:531-44.
Landqvist M, et al. Diffusion tensor tractography versus volumetric ima- 35. Bozzali M, Giulietti G, Basile B, Serra L, Spanò B, Perri R, et al. Dama-
ging in the diagnosis of behavioral variant frontotemporal dementia. ge to the cingulum contributes to Alzheimer’s disease pathophysiology
PLoS One. 2013;8:1-9. by deafferentation mechanism. Hum Brain Mapp. 2012;33:1295-308.
50You can also read