Toward understanding COVID 19 pneumonia: a deep learning based approach for severity analysis and monitoring the disease - Nature
←
→
Page content transcription
If your browser does not render page correctly, please read the page content below
www.nature.com/scientificreports
OPEN Toward understanding COVID‑19
pneumonia: a deep‑learning‑based
approach for severity analysis
and monitoring the disease
Mohammadreza Zandehshahvar1, Marly van Assen2, Hossein Maleki1, Yashar Kiarashi1,
Carlo N. De Cecco2 & Ali Adibi1*
We report a new approach using artificial intelligence (AI) to study and classify the severity of
COVID-19 using 1208 chest X-rays (CXRs) of 396 COVID-19 patients obtained through the course of
the disease at Emory Healthcare affiliated hospitals (Atlanta, GA, USA). Using a two-stage transfer
learning technique to train a convolutional neural network (CNN), we show that the algorithm is able
to classify four classes of disease severity (normal, mild, moderate, and severe) with the average
Area Under the Curve (AUC) of 0.93. In addition, we show that the outputs of different layers of the
CNN under dominant filters provide valuable insight about the subtle patterns in the CXRs, which can
improve the accuracy in the reading of CXRs by a radiologist. Finally, we show that our approach can
be used for studying the disease progression in a single patient and its influencing factors. The results
suggest that our technique can form the foundation of a more concrete clinical model to predict the
evolution of COVID-19 severity and the efficacy of different treatments for each patient through
using CXRs and clinical data in the early stages of the disease. This use of AI to assess the severity
and possibly predicting the future stages of the disease early on, will be essential in dealing with the
upcoming waves of COVID-19 and optimizing resource allocation and treatment.
COVID-19 was declared a global health emergency by the World Health Organization in January of 2020, and
governments have put unprecedented measures to halt the transmission of the virus1. However, the healthcare
systems are still struggling with the massive influx of patients. The virus mostly emerges with mild or no symp-
toms in the early stages. However, it can rapidly cause pneumonia and lung opacity in patients resulting in fatality
or long-term damages to the l ung2–4. This emphasizes the importance of timely diagnosis and evaluation of the
severity degree and other features of the disease to optimize resource allocation for extensive treatments such
as intensive care unit (ICU).
From the beginning of the pandemic, researchers started to develop different platforms and test kits for the
diagnosis of COVID-19. Prior to the availability of reverse-transcription polymerase-chain-reaction (RT-PCR)
tests, chest X-rays (CXRs) and computed tomography (CT) scans were used to diagnose COVID-195,6. However,
there have been many cases with positive COVID-19 without any pulmonary manifestations7. The significant
efforts and advances to foster the development of inexpensive, more accurate, faster, and easier-to-use test
kits and the aforementioned reasons raise questions about using medical imaging as a tool for detecting the
disease. Instead, these modalities can play a crucial role in determining the severity degree of the disease and
understanding the dynamics of its development from mild to severe in different patients as well as predicting
its evolution and assessing the efficacy of different t reatments2,3,8–13, which are not feasible in RT-PCR and other
laboratory test kits.
Predicting the severity degree of COVID-19 and its impacts on the lung are of great importance, enabling
monitoring the progress of the disease over time and helping resource allocation in h ospitals14–16. Several stud-
ies have shown that the severity classification and severity progression of COVID-19 are highly related to ICU
admission, length of hospital stay, and optimal planning of follow-ups6,8,10,12,13. Despite being less sensitive than
chest CT for diagnosis of COVID-19-related pneumonia, especially in the early phases of the disease, CXRs are
often being utilized in the first-line assessment of patients due to their affordability and accessibility. In its recent
1
School of Electrical and Computer Engineering, Georgia Institute of Technology, Atlanta, GA, USA. 2Department
of Radiology and Imaging Sciences, Emory University School of Medicine, Atlanta, GA, USA. *email: ali.adibi@
ece.gatech.edu
Scientific Reports | (2021) 11:11112 | https://doi.org/10.1038/s41598-021-90411-3 1
Vol.:(0123456789)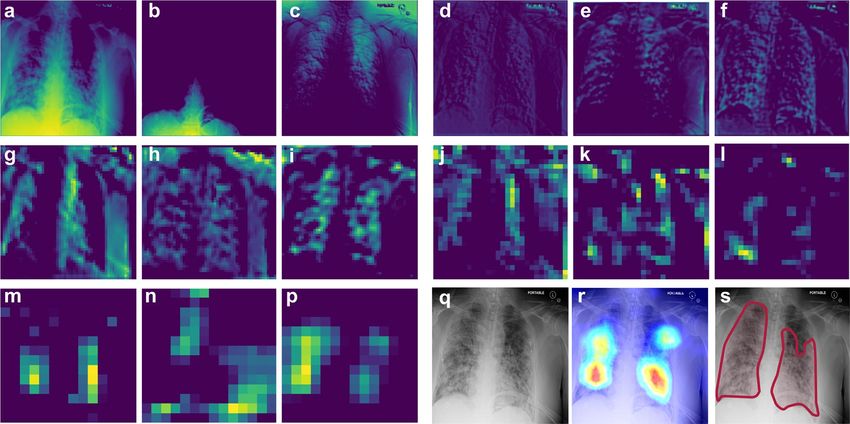
www.nature.com/scientificreports/
guideline, the American College of Radiography (ACR) recommends portable CXR in ambulatory care facili-
ties over CTs17. The British Medical Journal (BMJ) Best Practice recommendations for COVID-19 management
also endorses the use of CXR in all patients with suspected p neumonia18. A retrospective study by Wong H.Y.F.
et al.4 on 64 patients with an RT-PCR-confirmed COVID-19 diagnosis found that the most common COVID-
19-related signs on CXRs were consolidation (47%) and ground-glass opacities (33%). These alterations mostly
had a bilateral, peripheral, and lower zone distribution and were rarely associated with pleural effusion. In their
study, 69% of patients had CXR abnormalities on the baseline X-ray, and another 11% developed CXR altera-
tions later on in the study. As a result, CXR can be a very effective modality for monitoring the progression of
the disease and its effect on the pulmonary system. However, the increasing number of patients and the large
number of CXRs burden an unprecedented workload on radiologists and calls for automatic severity prediction
and monitoring systems more than any time.
Artificial intelligence (AI) may be a viable solution for the automatic diagnosis and prognosis of COVID-19
and unburdening physicians and radiologists of the high workload. Recent studies in using AI for diagnosis of
the disease from CXRs and CT scans shows the capabilities of these methods in providing automatic and rapid
diagnosis19–25. However, despite the unique opportunities enabled by AI, most of the existing works focus on
classification and detection of COVID-1926–30, rather than classifying the severity degree of the d isease31–35 and
providing intuition about its potential evolution and the decision making process, which can facilitate unprec-
edented knowledge discovery in COVID-19. In this paper, we demonstrate an effective AI approach for this
important purpose.
While most of the reported works on CXR for diagnosis of COVID-19 use online datasets that might com-
bine CXRs from different sources and different settings34, in this study, we use an authentic dataset from Emory
Healthcare affiliated hospitals (Atlanta, GA, USA), which is labeled by an expert radiologist (CNDC) with 15+
years of experience. Here, we report an AI model based on training a deep convolutional neural network (CNN)
for predicting the severity of COVID-19 using CXR images. We will also use interpretable models through
dimensionality reduction and visualization of the outputs of different layers of the trained CNN to obtain valuable
insight about the evolution of the disease as well as the decision-making process36–39. We show that our model
can predict the severity degree of pneumonia caused by COVID-19 from CXR images with the average area
under the curve (AUC) of 0.97, 0.90, 0.90, and 0.95 for normal, mild, moderate, and severe COVID-19 classes
over unseen test sets. We will also visualize the most important and dominant features that the CNN extracts
from CXR images at each layer of the CNN by applying a pruning algorithm based on the average percentage of
zeros (APoZ)40,41. Finally, we leverage the uniform manifold approximation and projection (UMAP) m ethod42
to form the low-dimensional manifold of the input-output relation (i.e., X-ray images to COVID-19 severity
classes) to clearly monitor the disease progression.
Results
Emory hospital COVID‑19 X‑ray dataset for training and evaluation. In total, 1208 CXRs from
396 patients are used in this study. CXRs are consecutive samples from patients who had a clinically-performed
positive COVID-19 RT-PCR test during the same admission as their CXR imaging at Emory-Healthcare-affili-
ated hospitals (Atlanta, GA, USA). An expert cardiothoracic radiologist with 15+ years of experience in reading
CXRs has labeled all CXRs. These CXRs are blinded and randomized for the classification of the disease sever-
ity and the reader has had no insight into clinical data and/or outcomes. The CXRs are classified into normal,
mild, moderate, and severe classes depending on the consolidation and opacity degrees (see “Methods” for more
details about the labeling process). The number of images are 178, 506, 384, and 140 for the normal, mild,
moderate, and severe classes, respectively (see Table 1). The dataset includes 196 males and 200 females with an
average age of 63.1. We use 966 CXRs for training and keep the rest for evaluating the performance of the model
(see “Methods” section for more details about the training and test data splitting and validating process over
independent test sets).
Deep‑learning (DL)‑based model for classifying the severity of COVID‑19. The CNN (shown in
Fig. 1) is trained using 80% of the CXRs through a two-stage transfer-learning algorithm to assess the sever-
ity of COVID-19 for an input CXR (see “Methods” for details)43,44. We used class weights during the training
to address the unbalanced distribution between the severity classes in the training set instead of over/under-
sampling, which causes bias in the decision (see “Methods” for details). The receiver operating characteristic
curve (ROC) for the average performance of the DL-based model over 10 unseen CXR test sets (sampled from
the dataset using the bootstrap method45,46) is shown in Fig. 2a (see “Methods” section for more details regarding
the validation and sampling process). The average AUC over 10 test sets for normal, mild, moderate, and severe
classes are 0.97, 0.90, 0.90, and 0.95, respectively. The lower AUC for mild and moderate classes in comparison
with normal and severe classes is in line with their larger overlap with other classes and the fairly subtle differ-
ences between these categories (i.e., mild and moderate) and surrounding categories (i.e., normal and severe).
Based on the confusion matrix of the model (Fig. 2b), the average recall (i.e., sensitivity) for normal, mild, mod-
erate, and severe classes is 0.83, 0.80, 0.68, and 0.65, respectively. According to Fig. 2b, the misclassification rate
for non-adjacent classes (e.g., normal vs. moderate, severe vs. normal, etc.) is zero with the exception of 0.01 for
the severe vs. mild case, which is negligible. The model specificity is 0.93, 0.81, 0.87, and 0.95 for the normal,
mild, moderate, and severe classes, respectively. Similar to the AUC, the specificity of the model is lower for
intermediate classes (i.e., mild and moderate) due to the reasons explained earlier.
Deep inside the layers of CNN. To assess the consistency of the results, we use the Gradient-weighted
Class Activation Mapping (Grad-CAM) method for saliency map visualization of the input CXRs37. Figure 3a–c
Scientific Reports | (2021) 11:11112 | https://doi.org/10.1038/s41598-021-90411-3 2
Vol:.(1234567890)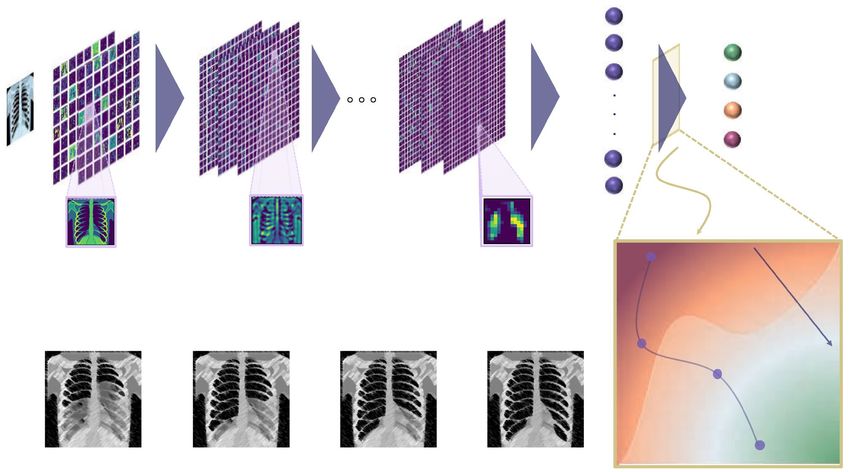
www.nature.com/scientificreports/
Figure 1. Workflow of COVID-19 severity assessment and prognosis model. The input CXR is fed into the
CNN and will be processed by the network to extract the features and classify the severity degree of the disease.
At each layer of the CNN, the outputs of the most dominant channels will be visualized using a pruning
approach to understand the decision-making process and extracted features by the CNN. To monitor the
progress of the disease, we reduce the dimensionality of the last fully connected layer using UMAP and use
the Gaussian Mixture Model (GMM) to cluster the space into different severity regions. For series of input
CXRs of a patient, we use the trained CNN to assess the severity degree at each visit and use the latent-space
representation to visualize and monitor the progress of the disease in 2D space. Note that the X-ray images
(from VectorStock) and figures are conceptual and the results for each part are presented in the following
sections.
Total number of patients 396
Total number of CXRs 1208
Normal 178 (14.7%)
Mild 506 (41.9%)
CXRs class distribution
Moderate 384 (31.8%)
Severe 140 (11.6%)
Min 18
Mean 63.10
Age statistics
Max > 90
Standard deviation 16.19
Male 640 (53%)
Gender distribution in CXRs
Female 568 (47%)
Male 196 (49.5%)
Gender distribution in patients
Female 200 (50.5%)
Table 1. Patients cohort utilized in the study. All the patients in this study are diagnosed with COVID-19
using RT-PCR test. CXRs for training and testing the model are chosen randomly from 1208 CXRs.
show the original CXRs and regions of interest (ROI) labeled by our expert radiologist for three images with
mild, moderate, and severe conditions; the corresponding saliency maps obtained from the AI algorithms are
shown in Fig. 3d–f. All of the images have been classified correctly by our model, and the probability of the true
classes are 0.96, 0.67, and 0.89, respectively. The saliency maps demonstrate consistent activation in the regions
that are affected by COVID-19 pneumonia.
Scientific Reports | (2021) 11:11112 | https://doi.org/10.1038/s41598-021-90411-3 3
Vol.:(0123456789)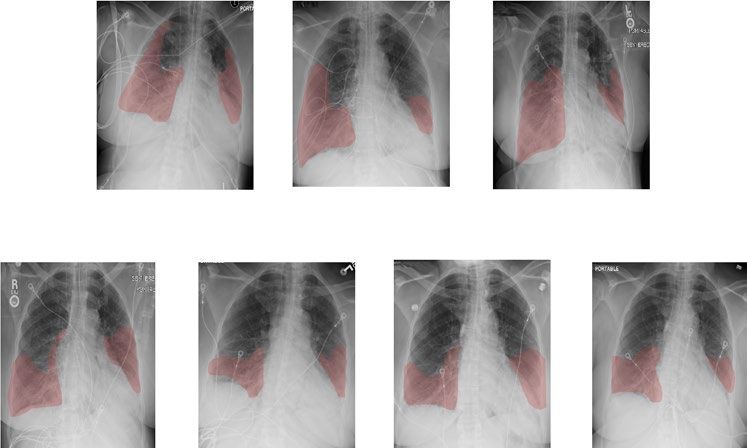
www.nature.com/scientificreports/

                                            Figure 2.  Model performance. (a) The receiver operating characteristic (ROC) curves for normal, mild,
                                            moderate, and severe classes and the micro- and macro-average ROCs. The solid lines show the means of ROCs
                                            over 10 independent test sets, sampled using the bootstrap method. The standard deviations for the ROCs
                                            are represented as shadows with a similar color for each class. (b) Confusion matrix of the model for the test
                                            datasets. The values are shown as the average performance of the model over 10 independent test sets (same as
                                            a) with the corresponding standard deviations. The error in non-adjacent classes (e.g., normal vs. moderate) is
                                            zero for all classes (except for severe vs. mild, which has a low error of 0.01).

                                                To understand the decision-making process in the CNN and visualize the extracted features, we use a pruning
                                            algorithm based on APoZ method to find the most dominant filters in each convolutional layer of the CNN. The
                                            outputs of the corresponding CNN layers under these dominant filters are shown in Fig. 4a–p for an input CXR of
                                            a patient with severe COVID-19 pneumonia. Comparing the filters to our expert radiologist’s perspective of the
                                            traditional CXRs shows that each filter highlights specific relevant parts of the CXRs similarly to the radiologist’s
                                            workflow examination. The filters from the first block of the CNN (Fig. 4a–c) focus more on highlighting different
                                            parts of the image (e.g., lung area, lower body part, etc.). In Fig. 4d–f, the filters highlight different heterogenei-
                                            ties of the images. Depending on the underlying anatomical structure, different parts of the CXR will have more
                                            homogenous intensities, such as the fat layers and the upper abdominal area. The aerated parts show different
                                            types of heterogeneity, caused by differences in air and fluid content. In these filters the lung fields and projected
                                            ribs are highlighted, which can help in understanding the COVID-19 disease, where we see an increased het-
                                            erogeneity in the intensities of the lung fields, caused by pulmonary infiltrates. The deeper layers of the CNN
                                            extract more complex and difficult-to-interpret features (yet potentially more insightful) from the CXRs, and the
                                            final layers localize the ROIs in the image. It is clear that the large number of filters in our algorithm provides a
                                            larger range of important features and CXR areas that might offer new insights to radiologists about the disease.

                                            Manifold learning for better CXR image visualization and analysis. We reduce the dimensionality
                                            of the output of the penultimate layer in the CNN in Fig. 1 using UMAP to visualize the distribution of the data
                                            in a two-dimensional (2D) space, called the latent space, and compare different COVID-19 severity classes (see
                                            Methods for details). Next, we cluster the latent space using GMM into different severity regions. Fig. 5 shows
                                            the output of the model and the regions of normal, mild, moderate, and severe classes in green, blue, orange, and
                                            red colors. The results shown in Fig. 5 support the robustness of our model in classifying non-adjacent classes,
                                            as there is no overlap between their corresponding regions in the latent space. More importantly, this approach
                                            provides a visualization tool for monitoring the progression of the disease and studying the changes in the sever-
                                            ity degree of COVID-19 for a specific patient over time. Progressions of the disease in consecutive follow-up
                                            visits for two patients are shown in Fig. 5 with their corresponding CXRs. Patient 1 is a 79 years old Asian female
                                            with body mass index (BMI) of 22.5. As it is shown in Fig. 5, the patient has normal CXR in the first visit and the
                                            severity increases in the follow-ups and unfortunately dies. The severity path and CXRs for patient 2 (60 years
                                            old African American female with BMI of 29.8) are also shown in Fig. 5. This patient starts from mild stage and
                                            as the disease progresses, the CXR shows severe condition in the 5th follow-up and fortunately starts recovering
                                            in the next visits.

                                            Discussion
                                            With the availability of the simpler, more reliable, and faster RT-PCR test kits, the strength of AI approaches must
                                            be utilized to provide early prognostication and more subtle details about the disease than just the basic detection.
                                            With pneumonia being a catastrophic feature of COVID-19, there is an urgent need for better understanding

          Scientific Reports |   (2021) 11:11112 |               https://doi.org/10.1038/s41598-021-90411-3                                                      4

Vol:.(1234567890)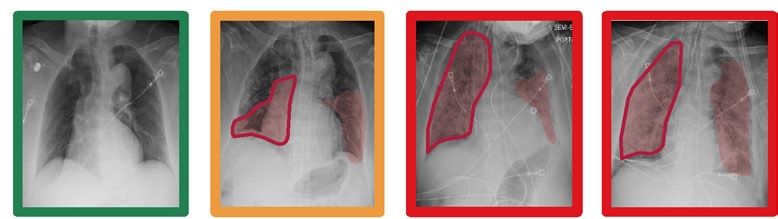
www.nature.com/scientificreports/

                                  Figure 3.  CXRs and saliency maps for three patients chosen from the unseen test dataset. The CXRs and
                                  affected areas for patients with (a) mild, (b) moderate, and (c) severe COVID-19 pneumonia (analyzed by our
                                  expert radiologist). (d–f) The corresponding saliency maps for CXRs (found by our AI approach). The true class
                                  probability for the images are 0.96, 0.67, 0.89, respectively. The saliency maps and regions of interest match well
                                  for all CXRs.

                                  the dynamics of the progression of the adverse effects of COVID-19 on the lung. X-ray imaging can play an
                                  important role in this endeavor as the first-line imaging tool, which is an important part of the standard protocols,
                                  requiring a low radiation dose, easy to disinfect, inexpensive, and widely available, especially in low-income/
                                  rural areas and countries.
                                      In this study, we developed an AI system to assess the severity degree of COVID-19 pneumonia using CXRs
                                  and monitor the progression. Figures 2, 3, and 5 clearly show that our algorithm can learn to assess the severity
                                  degree of COVID-19 and can be employed for monitoring the disease progression over time. Our algorithm can
                                  also provide more features than a typical CXR using the outputs of the CNN layers under dominant filters. As
                                  shown in Fig. 4, the initial layers of the CNN extract low-level features (e.g., lung areas, ribs, edges, etc.) while
                                  the final layers extract high-level and more abstract features and are not easy to interpret. Having these differ-
                                  ent views of a single CXR can help radiologists to better evaluate the severity of the disease and understand the
                                  decision-making process of the model. To the best of our knowledge, this is the first time that an interpretable
                                  model beyond saliency maps is presented in the literature for severity analysis of COVID-19. The accuracies
                                  obtained for the severity classification (Fig. 2) are good, especially knowing that the comparison is made with the
                                  labeling of only one expert radiologist. Aside from the actual classification accuracies, the separation of different
                                  severity classes in Fig. 5 clearly shows that our algorithm successfully distinguishes different classes with maxi-
                                  mum spatial distance in the latent space between the normal and severe classes. It is also trivial why the errors
                                  in classifying mild and moderate classes are higher than those in the other two. A valuable use of the manifold-
                                  learning approach in Fig. 5 is the observation of the disease progression path for each patient. Interestingly we
                                  see that these patients take two different disease progression paths with different specifics. Patient 2, initially
                                  worsens, showing increasing signs of COVID-19-related pneumonia on sequential CXRs. However, after day 5,
                                  the patient starts recovering, showing improvement on CXRs and on day 20 is successfully discharged without
                                  re-admission. Patient 1 does not show this turning point and shows increasing disease severity on the CXRs and
                                  unfortunately dies. Understanding such turning points based on available data and relating them to the influenc-
                                  ing factors on the disease progression are essential to create more insight into the disease trajectory to enable
                                  intelligent prediction of the disease evolution and assessment of treatment options for specific patients early on.

Scientific Reports |   (2021) 11:11112 |               https://doi.org/10.1038/s41598-021-90411-3                                                    5

                                                                                                                                                Vol.:(0123456789)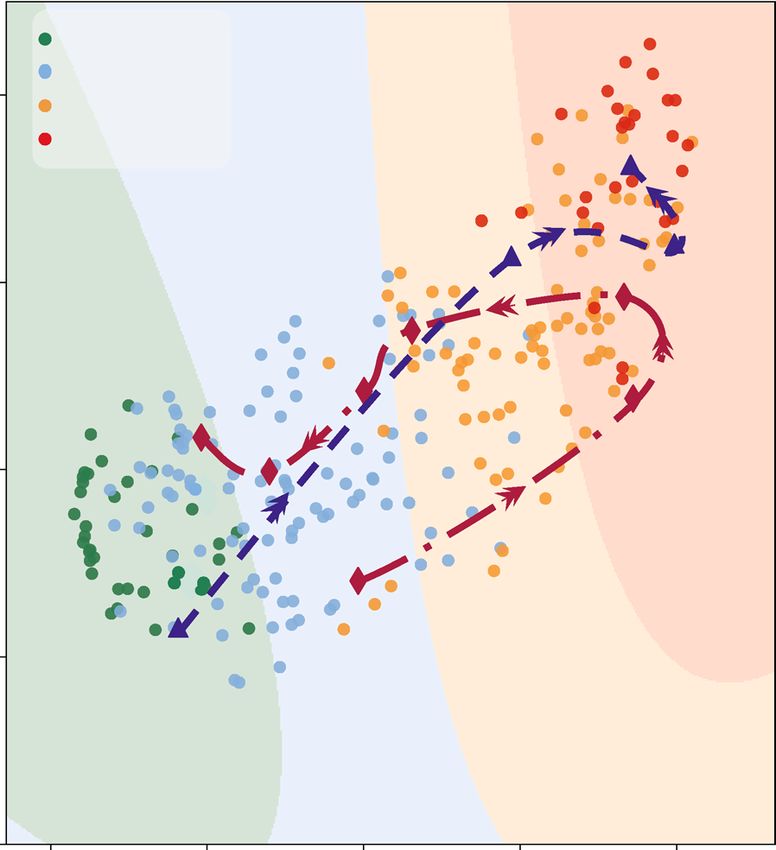
www.nature.com/scientificreports/

                                            Figure 4.  Deep inside the CNN. The representation of the dominant filters of CNN for an input CXR of a
                                            patient with severe COVID-19 pneumonia. (a–p) Outputs of the different CNN layers (from the first to the
                                            last convolutional layer) through the dominant filters. Each three filters correspond to one block of the CNN
                                            (see “Methods” for details). (q) The original input CXR for the patient. (r) Saliency map of the input CXR. (s)
                                            Affected regions labeled by our expert radiologist.

                                            Figure 5.  Latent space representation of the X-rays. The dimensionality of the penultimate layer of the network
                                            is reduced using UMAP, and the resulting latent space is clustered into 4 regions corresponding to different
                                            severity degrees using GMM. Green, blue, orange, and red are related to the normal, mild, moderate, and
                                            severe classes, respectively. The datapoints for each class are shown as circles with the corresponding color. The
                                            progressions of the disease over time for two patients are shown by the dashed blue (following a progression
                                            path) and red (following a recovery path after progression) paths in the latent space. Image segmentation is
                                            used as an indication of areas of interest and they are not necessarily quantitative measures for the severity (see
                                            Methods for more details about the severity assessment).

          Scientific Reports |   (2021) 11:11112 |               https://doi.org/10.1038/s41598-021-90411-3                                                   6

Vol:.(1234567890)
www.nature.com/scientificreports/
One of the limitations of this study is using the labels from just one radiologist for training the model. That
also limits the performance and confidence of the model in the intermediate severity classes (i.e., Mild and
Moderate) more than the others. To improve the performance of the model and have a better comparison with
the readings of human experts, we need to gather labels from multiple radiologists for training and testing the
presented approaches. Besides, having more frequent CXRs for more patients will enable the algorithm to provide
valuable insight about the dynamics of the disease progression and its relation to the clinical data and treatment
details over time. This can also help us to develop a more concrete model to predict at an early stage the future
course of the disease for different patients and identify the patients that might need more intensive treatment
form those that are more likely to recover. It can also be used to predict the best treatment approach at each stage
of the disease for each patient. In addition, evaluation of the performance of the model over online benchmark
datasets and multinational datasets will be needed to understand the efficacy of AI methods in clinical practice.
Unfortunately, this is not a straightforward task at this stage since available online data lack, in most cases, the
source of the data and related clinical features (e.g., the results of the PCR test).
It is important to note that the applicability of our AI approach for clinical data analysis is not limited to
COVID-19 and can be extended for classification and severity analysis of a variety of different lung diseases, e.g.,
COVID-19 and different types of pneumonia24,30 . Once the algorithm is trained to learn the patterns of a disease
through a series of training CXRs, the outputs of the different CNN layers under dominant filters can identify
subtle patterns in the imaging data (as seen in Fig. 4 for CXRs) that can provide more detailed information than
a single image. This can improve the accuracy of CXR reading by a radiologist. In a bigger picture, our algorithm
can be adopted and extended to include other forms of imaging data for a wider range of medical diagnosis.
Methods
COVID‑19 dataset population and labeling procedure. Patients included retrospectively for this
study are selected as a consecutive sample who had a clinically performed positive COVID-19 RT-PCR test
related to their CXR imaging date at Emory Healthcare affiliated hospitals (Atlanta, GA, USA). The CXRs are
collected from January 1st, 2020 to May 1st, 2020, and the need for informed consent is waived by Emory
University institutional review board (IRB). Both in-patients and out-patients are included. All CXRs during
the entire hospital admission of the patient are collected, ranging from 1–30 images. CXRs are acquired in the
posteroanterior (PA) or anteroposterior (AP) projection according to standard clinical protocols. Lateral X-rays
were present for some patients, however not used for the current study. Depending on patient status, CXRs are
taken with a portable X-ray unit and in a supine, erect, or semi-erect position. All CXRs have been labeled by
an expert cardiothoracic radiologist with 15+ years of experience reading CXRs. All the images are blinded and
randomized for the qualification of disease severity, and the reader had no insight into clinical data and/or out-
comes. The CXRs are classified into normal, mild, moderate, and severe categories. This is done based on clinical
experience of the reader in addition to the following guidelines:
Normal no opacities and/or abnormalities, indicative of pneumonia, are present.
Mild less than 50% of the lung area is affected by pneumonia-related abnormalities. Patchy (partly periph-
eral) opacities are present in the lower and mid lung zones.
Moderate approximately 50% of the lung area is affected by pneumonia-related abnormalities. Opacities are
present, often bilateral, in the mid and lower zones.
Severe more than 50% of the lung area is affected by pneumonia-related abnormalities. Opacities are dense,
often bilateral, and can affect all lung zones (lower, mid, and upper).
In addition to the images, basic demographics are collected such as age (at the scan time), body-mass index
(BMI), and gender. All images are de-identified according to Health Insurance Portability and Accountability Act
(HIPAA) and hospital-specific guidelines. Patients with an age above 90 were noted as > 90. DICOM headers are
anonymized and only contain technique-related information, such as information about position of the X-ray
(supine, semi-erect etc.) and whether it is a portable X-ray machine or not; all patient-related data are removed.
Patients and imaging dates are coded to keep the longitudinal information between CXRs from the same patient.
In addition, the date and time stamp, burned into the CXRs, are removed.
DL‑based severity classification model. To validate the performance of the model, we use a bootstrap
sampling method (i.e., sampling with replacement) to create 10 sets of training and testing sets (80% for train-
ing and 20% for testing in each set). We keep 10% of the training set for validation and train the model on the
remaining part after data augmentation. We train and test the performance of the model over each of these 10
sets independently and report the mean and standard deviation of the performances. Due to the limited number
of CXRs, we use a two-stage transfer-learning approach for training the DL-based method for predicting the
severity of COVID-19. We first use the pre-trained convolutional layers of the VGG-1647 network for the clas-
sification task over the Radiological Society of North America (RSNA) pneumonia dataset that includes 25,684
CXRs corresponding to normal, lung opacity, and other classes of lung pathologies (e.g., pulmonary edema,
atelectasis, lung cancer, etc.). Then, we transfer the fine-tuned convolutional layers of the network and add fully
connected layers to the transferred network, trained by our CXRs, for classifying the severity of COVID-19.
All the CXR images are resized to 224 × 224 and preprocessed to scale the pixels between −1 and 1. We use
random rotations, horizontal and vertical shifts, random shears, and random zooms to augment the training
set for better generalization. The input of the network is an image with dimensions 224 × 224 × 3 followed by
5 blocks of convolutional layers. The first block includes two convolutional layers with 64 channels and 3 × 3
filters with same padding and rectified linear unit (ReLU) activation function, followed by a max pooling layer
Scientific Reports | (2021) 11:11112 | https://doi.org/10.1038/s41598-021-90411-3 7
Vol.:(0123456789)www.nature.com/scientificreports/
with stride of (2,2). The second block includes 128 channels with 3 × 3 filters and a max pooling layer with
stride of (2,2). Next, there are three convolutional layers with 256 channels and 3 × 3 filters and a max pool-
ing layer with stride (2,2). The fourth and fifth block each have 3 convolutional layers with 512 channels and
3 × 3 filters and ReLU, followed by max pooling layer with stride of (2,2) and same padding. Next, the network
includes a global average pooling layer, a flatten layer followed by a fully connected layer with 256 neurons and
ReLU activation function. The last layer has 4 neurons with sigmoid activation function. The categorical cross
entropy loss function is minimized using Adam optimizer during the training of the model. Since the dataset
has unbalanced distribution over different severity classes, we used class weights during the training process to
avoid high errors in the less common classes as well as the classes with higher clinical risk of misclassification
(e.g., Severe). The cost for each class is selected to 1.5, 2, 2, 3 (normal, mild, moderate, and severe, respectively)
to handle the unbalanced dataset.
To find the regions of interest for the CNN, we use the Grad-CAM method. The output of our severity classi-
fication model will be the saliency map of the input CXR and the class probabilities. Algorithms are implemented
in Python using the Keras package and trained on a workstation with an NVIDIA RTX2080 GPU, a Core i7
CPU, and 32 GB of RAM.
Filter representation model. To understand the role of convolutional layers in the CNN and the details
of the decision-making process, we visualize the outputs of each layer of the CNN under different applied filters.
We first find the most dominant filters by applying the APoZ pruning method over the training dataset. We keep
1% of the filters at each CNN layer with highest average activity (i.e., ℓ0-norm) over the training set and visualize
the corresponding outputs of those CNN layers for any given input CXR.
Dimensionality reduction and latent space representation model. The output of the penultimate
layer (i.e., the last fully connected layer before the output layer of the CNN) is used for the latent space repre-
sentation. We reduce the dimensionality of the data from 256 to 2. The number of neighbors in the UMAP algo-
rithm are 5; the distance measure is correlation; and the minimum distance is 0.3. The UMAP is trained using
the same training dataset on which the CNN is trained; none of the test samples are used during the training
stage of the latent space representation model. After reducing the dimensionality to 2, we train a GMM to cluster
the latent space into the regions for normal, mild, moderate, and severe COVID-19 pneumonia. The number of
Gaussians (i.e. the constituents of the mixture in the GMM that model the distribution of the data) is selected as
4, and the labels are imposed as colors to specify the regions after training (Suppl. Information).
Compliance. All the approaches and methods used the anonymized CXR data according to the guidelines of
Emory University and Georgia Tech and approved by the IRB. All procedures followed HIPAA guidelines. The
Emory IRB approved the collection of this data and waived the need of informed consent.
Data availability
The dataset that is used for the first stage of the transfer learning during the training is publicly available on
https://www.kaggle.com/c/rsna-pneumonia-detection-challenge/data. The datasets generated during and/or
analyzed (i.e., Emory COVID-19 CXR dataset) during the current study are available upon reasonable request.
For more information, please contact Dr. Carlo De Cecco and Dr. Ali Adibi.
Received: 16 December 2020; Accepted: 21 April 2021
References
1. Sohrabi, C. et al. World Health Organization declares global emergency: A review of the 2019 novel coronavirus (COVID-19). Int.
J. Surg. (2020).
2. Chen, H., Ai, L., Lu, H. & Li, H. Clinical and imaging features of COVID-19. Radiol. Infect. Dis. (in press). https://doi.org/10.
1016/j.jrid.2020.04.003 (2020).
3. Yp, L. E. E. E. et al. Imaging profile of the COVID-19 infection: Radiologic findings and literature review. Radiology (2020).
4. Wong, H. Y. F. et al. Frequency and distribution of chest radiographic findings in COVID-19 positive patients. Radiology (in press).
ISSN: 0033-8419. https://doi.org/10.1148/radiol.2020201160 (2019).
5. Franquet, T. Imaging of pulmonary viral pneumonia. Radiology 260, 18–39 (2011).
6. Fang, Y. et al. Sensitivity of chest CT for COVID-19: Comparison to RT-PCR. 395. https://d oi.o
rg/1 0.1 001/j ama.2 020.2 648 (2020).
7. Yang, W. & Yan, F. Patients with RT-PCR-confirmed COVID-19 and normal chest CT. Radiology 295, E3–E3 (2020).
8. Pan, F. et al. Time course of lung changes on chest CT during recovery from 2019 novel coronavirus (COVID-19) pneumoni.
Radiology (in press) (2019).
9. Li, L. et al. Artificial intelligence distinguishes COVID-19 from community acquired pneumonia on chest CT lin. Radiology (in
press). https://doi.org/10.1148/radiol.2020200905 (2020).
10. Bernheim, A. et al. Chest CT findings in coronavirus disease-19 (COVID-19): Relationship to duration of infection. Radiology (in
press). https://doi.org/10.1148/radiol.2020200463 (2020).
11. Li, M. et al. Coronavirus disease (COVID-19): Spectrum of CT findings and temporal progression of the disease. Acad. Radiol.
27, 603–608 (2020).
12. Liu, F. et al. CT quantification of pneumonia lesions in early days predicts progression to severe illness in a cohort of COVID-19
patients. Theranostics 10, 5613–5622. ISSN: 18387640 (2020).
13. Zhao, W., Zhong, Z., Xie, X., Yu, Q. & Liu, J. Relation between chest CT findings and clinical conditions of coronavirus disease
(COVID-19) pneumonia: A multicenter study. Am. J. Roentgenol. 214, 1–6. ISSN: 0361-803X (2020).
14. Feng, Z. et al. Early prediction of disease progression in COVID-19 pneumonia patients with chest CT and clinical characteristics.
Nat. Commun. 11, 1–9 (2020).
15. Booth, A. L., Abels, E. & McCaffrey, P. Development of a prognostic model for mortality in COVID-19 infection using machine
learning. Mod. Pathol. 1–10 (2020).
Scientific Reports | (2021) 11:11112 | https://doi.org/10.1038/s41598-021-90411-3 8
Vol:.(1234567890)www.nature.com/scientificreports/
16. Zhang, J. et al. Viral pneumonia screening on chest X-ray images using confidence-aware anomaly detection. IEEE Trans. Med.
Imaging (2020).
17. ACR Recommendations for the Use of Chest Radiography and Computed Tomography (CT) for Suspected COVID-19 Infection |
American College of Radiology.
18. Beeching, N. J., Fletcher, T. E. & Fowler, R. Coronavirus disease 2019 (COVID-19)—Symptoms, diagnosis and treatment | BMJ
Best Practice (2020).
19. Harmon, S. A. et al. Artificial intelligence for the detection of COVID-19 pneumonia on chest CT using multinational datasets.
Nat. Commun. 11, 1–7 (2020).
20. Wang, B. et al. AI-assisted CT imaging analysis for COVID-19 screening: Building and deploying a medical AI system. Appl. Soft
Comput. 106897, (2020).
21. Oh, Y., Park, S. & Ye, J. C. Deep learning covid-19 features on cxr using limited training data sets. IEEE Trans. Med. Imaging (2020).
22. Murphy, K. et al. COVID-19 on the chest radiograph: A multi-reader evaluation of an AI system. Radiology 201874 (2020).
23. Jin, C. et al. Development and evaluation of an artificial intelligence system for COVID-19 diagnosis. Nat. Commun. 11, 1–14
(2020).
24. Rajpurkar, P. et al. CheXaid: Deep learning assistance for physician diagnosis of tuberculosis using chest x-rays in patients with
HIV. NPJ Digit. Med. 3, 1–8 (2020).
25. Rajpurkar, P. et al. Deep learning for chest radiograph diagnosis: A retrospective comparison of the CheXNeXt algorithm to
practicing radiologists. PLoS Med. 15, e1002686 (2018).
26. Wang, L., Lin, Z. Q. & Wong, A. Covid-net: A tailored deep convolutional neural network design for detection of covid-19 cases
from chest x-ray images. Sci. Rep. 10, 1–12 (2020).
27. Ozturk, T. et al. Automated detection of COVID-19 cases using deep neural networks with X-ray images. Comput. Biol. Med.
103792 (2020).
28. Mahmud, T., Rahman, M. A. & Fattah, S. A. CovXNet: A multi-dilation convolutional neural network for automatic COVID-19
and other pneumonia detection from chest X-ray images with transferable multi-receptive feature optimization. Comput. Biol.
Med. 122, 103869 (2020).
29. Heidari, M. et al. Improving the performance of CNN to predict the likelihood of COVID-19 using chest X-ray images with
preprocessing algorithms. Int. J. Med. Inform. 144, 104284 (2020).
30. Karthik, R., Menaka, R. & Hariharan, M. Learning distinctive filters for COVID-19 detection from chest X-ray using shuffled
residual CNN. Appl. Soft Comput. 99, 106744 (2021).
31. Cohen, J. P. et al. Predicting covid-19 pneumonia severity on chest x-ray with deep learning. Cureus 12 (2020).
32. Wang, S. et al. A fully automatic deep learning system for COVID-19 diagnostic and prognostic analysis. Eur. Respir. J. (2020).
33. Zhu, J. et al. Deep transfer learning artificial intelligence accurately stages COVID-19 lung disease severity on portable chest
radiographs. PloS one 15, e0236621 (2020).
34. Cohen, J. P. et al. Covid-19 image data collection: Prospective predictions are the future. J. Mach. Learn. Biomed. Imaging (MELBA)
(2020).
35. Fridadar, M., Amer, R., Gozes, O., Nassar, J. & Greenspan, H. COVID-19 in CXR: From detection and severity scoring to patient
disease monitoring. IEEE J. Biomed. Health Inform. 1–1 (2021).
36. Zeiler, M. D. & Fergus, R. Visualizing and Understanding Convolutional Networks in European Conference on Computer Vision
818–833 (2014).
37. Selvaraju, R. R. et al. Grad-cam: Visual explanations from deep networks via gradient-based localization. In Proceedings of the
IEEE International Conference on Computer Vision. 618–626 (2017).
38. Zhou, B., Khosla, A., Lapedriza, A., Oliva, A. & Torralba, A. Learning deep features for discriminative localization. In Proceedings
of the IEEE Conference on Computer Vision and Pattern Recognition 2921–2929 (2016).
39. Bronstein, M. M., Bruna, J., LeCun, Y., Szlam, A. & Vandergheynst, P. Geometric deep learning: going beyond euclidean data. IEEE
Signal Process. Mag. 34, 18–42 (2017).
40. Hu, H., Peng, R., Tai, Y.-W. & Tang, C.-K. Network trimming: A data-driven neuron pruning approach towards efficient deep
architectures. arXiv preprint arXiv:1607.03250 (2016).
41. He, Y., Zhang, X. & Sun, J. Channel pruning for accelerating very deep neural networks. In Proceedings of the IEEE International
Conference on Computer Vision 1389–1397 (2017).
42. McInnes, L., Healy, J. & Melville, J. Umap: Uniform manifold approximation and projection for dimension reduction. arXiv preprint
arXiv:1802.03426 (2018).
43. Bengio, Y. Deep learning of representations for unsupervised and transfer learning. In Proceedings of ICML Workshop on Unsu-
pervised and Transfer Learning. 17–36 (2012).
44. Pan, S. J. & Yang, Q. A survey on transfer learning. IEEE Trans. Knowl. Data Eng. 22, 1345–1359 (2009).
45. Horowitz, J. L. Handbook of Econometrics 3159–3228 (Elsevier, 2001).
46. Hastie, T., Tibshirani, R. & Friedman, J. The Elements of Statistical Learning: Data Mining, Inference, and Prediction (Springer,
2009).
47. Simonyan, K. & Zisserman, A. Very deep convolutional networks for large-scale image recognition. arXiv preprint arXiv:1409.
1556 (2014).
Author contributions
The main idea for the AI approach was initially conceived by M.Z., C.D.C., A.A., and it has been discussed with
all authors for validation, formal analysis, and final development. M.Z., H.M., Y.K., and A.A. designed the AI
approaches and performed the statistical analysis of the results. M.Z. implemented the methods and prepared the
results. M.v.A. and C.D.C. gathered and anonymized the Emory COVID-19 CXR dataset and the related clinical
features, performed clinical interpretation of the results, and contributed to the labeling of the CXRs. C.D.C.
led the labeling of the dataset. M.Z. prepared the code for CXR data extraction and preprocessing. All authors
participated in regular discussions of the results and improvement of the approach. In addition, all authors
participated in writing and critically revising the paper. A.A. and C.D.C. supervised the study.
Funding
This study was funded by Dr. Ali Adibi’s Joseph M. Pettit Chair account and Dr. Carlo De Cecco’s startup funding.
Competing interests
The authors declare no competing interests.
Scientific Reports | (2021) 11:11112 | https://doi.org/10.1038/s41598-021-90411-3 9
Vol.:(0123456789)www.nature.com/scientificreports/
Additional information
Supplementary Information The online version contains supplementary material available at https://doi.org/
10.1038/s41598-021-90411-3.
Correspondence and requests for materials should be addressed to A.A.
Reprints and permissions information is available at www.nature.com/reprints.
Publisher’s note Springer Nature remains neutral with regard to jurisdictional claims in published maps and
institutional affiliations.
Open Access This article is licensed under a Creative Commons Attribution 4.0 International
License, which permits use, sharing, adaptation, distribution and reproduction in any medium or
format, as long as you give appropriate credit to the original author(s) and the source, provide a link to the
Creative Commons licence, and indicate if changes were made. The images or other third party material in this
article are included in the article’s Creative Commons licence, unless indicated otherwise in a credit line to the
material. If material is not included in the article’s Creative Commons licence and your intended use is not
permitted by statutory regulation or exceeds the permitted use, you will need to obtain permission directly from
the copyright holder. To view a copy of this licence, visit http://creativecommons.org/licenses/by/4.0/.
© The Author(s) 2021
Scientific Reports | (2021) 11:11112 | https://doi.org/10.1038/s41598-021-90411-3 10
Vol:.(1234567890)You can also read