DIGITIZING CONSUMERS IN INDIA - Future of Indian ConsumerTech Challenges and Opportunities
←
→
Page content transcription
If your browser does not render page correctly, please read the page content below
DIGITIZING
CONSUMERS
IN INDIA
Future of Indian ConsumerTech
Challenges and Opportunities

April 2023
Boston Consulting Group partners with leaders in business and                              Early-stage investors targeting companies in the Indian consumer
society to tackle their most important challenges and capture their                        and enterprise market. Matrix Partners began in Boston in 1977,
greatest opportunities.                                                                    and today invests actively in the USA, India and China. Matrix
                                                                                           Partners India was established in 2006 and invests across a
BCG was the pioneer in business strategy when it was founded in                            variety of sectors including consumer technology, B2B, enterprise
1963. Today, we help clients with total transformation—inspiring                           and SaaS, and Fintech, among others. We look for the best and
complex change, enabling organizations to grow, building                                   brightest founders and teams. In our experience, the quality,
competitive advantage and driving bottom-line impact. To succeed,                          passion and commitment of a company’s core team are more
organizations must blend digital and human capabilities. Our                               important than any other element.
diverse, global teams bring deep industry and functional expertise
and a range of perspectives to spark change.                                                                                We invest in between seed and series B initially in each company.
                                                                                                                            We like to get to know founders early, ideally well before they are
              BCG delivers solutions through leading-edge management                                                        ready to raise capital, with a focus on companies primarily targeting
              consulting along with technology and design, corporate and                  eo¶eW orbesthladinvfpW ethIndiamrk n
              digital ventures—and business purpose. We work in a uniquely                                                  invest on our own but also co-invest with other investors.
osthefir
     maivlbdcr elsofthugavmndr
              client organization, generating results that allow our clients to thrive.   sfir
                                                                                           y aelwoundr F es‰
                                                                                                           tinoury ejustavohwry
                                                                                                        nascent idea or are already running a business, let us help you turn
                                                                                                        your ideas into reality and grow your business.

DIGITIZING CONSUMERS IN INDIA                                                                                                                                                                       3
OUR APPROACH

To explore the ConsumerTech         The founder survey underlying     We corroborated and
space in India, we conducted a      this report was conducted in      substantiated our findings
series of in-depth discussions      late 2022 and 2023. Over 250      through extensive research
with 25+ founders and senior        founders and senior executives    and data analysis from
executives in leading startups      were approached for the survey.   Center for Customer Insight
in India. In addition to this, we   The goal of the survey was        (CCI) and global knowledge
surveyed founders and senior        to derive a comprehensive         teams within BCG. We also
executives on a broad range of      understanding of the              conducted a thorough analysis
topics in ConsumerTech space.       ConsumerTech landscape, and       of investment flows in the
We also leveraged the deep          the trends in the space along     ConsumerTech space.
expertise across BCG’s global       with outlook for the industry.
network of partners
and research teams.

DIGITIZING CONSUMERS IN INDIA 5

DIGITIZING CONSUMERS IN INDIA 6

EXECUTIVE SUMMARY
owth‰
gr ainedsu how t oniuesc my India The eaunc sigr wth • Rise of emerging technologies such as generative AI could have multiple
and discretionary spending. The pandemic accelerated digital penetration by potential applications in e-commerce (e.g., automating product descriptions,
MNP months osacr di«eentr ors‰
ect yebthr bosting the adoptin of personalized marketing content, assortment planning etc.); ONDC could
e-commerce and reaching a total of 350–400Mn online shoppers by 2025. In the videafurthfil
op oe´clipt ationepcrm
midst of this, the Indian ConsumerTech space has seen large value creation with With the landscape evolving rapidly, it is crucial for companies to navigate the
USD 250Bn+ in valuation and 40+ unicorns as of December 2022. landscape strategically to ensure higher odds of success. Our in-depth discussions
As India’s ConsumerTech ecosystem matures with 4K+ deals and USD 54Bn fund with founders and CXOs, and analysis of a larger set of successful ConsumerTech
·ows in the las Q er‰
y we xpct ha we il ontuc seaindutowhgr companies reveal critical factors for success:
in the next decade as key enablers fall into place across digital payments, physical Scaling startups from 0–to–10
infrastructure and logistics, and internet data connectivity. This is further bolstered
1. Identifygomru‰
cs pain´pointsrfcexg«eoringst
by a deepening market with 630Mn+ internet users and 98Mn+ digital natives
create a disruptive consumer proposition
in 2022, setting a robust platform for multiple large ConsumerTech companies
to be built. 2. Making the right choices across pricing, optimizing unit economics and
customer acquisition costs
While there is relatively high penetration and maturity of ConsumerTech in
categories such as electronics, appliances, fashion and apparel, the next wave 3. Building the supply side as a potential competitive moat through deep
of growth is likely to be driven by beauty and personal care, food & beverages, partnerships and capability build
FMCG, and furniture and décor. Proprietary consumer research conducted by 4. Internalizing the test & learn philosophy for quicker iterations and faster route
BCG’s Centre for Consumer Insight, along with our discussions with 25+ start-up oetfit
ducmarkp
founders and CXOs, have revealed a set of key trends which are shaping the Indian Driving sustainable growth in 10–100 phase
ConsumerTech landscape.
1. Sources of next wave of growth
• Democratization of online commerce with a large proportion of new shoppers
being 35+ years old, women and from tier 2+ cities A. Maximzng oercust imlf auev yb expandig o«erings‰ drivng alty o
through customer retention, and focusing on cross-sell/up-sell
• easingIcrlv of mni´chanel wit RTX owthgr in alydgt in·uednc
retail spending, reaching USD 207Mn in 2021 from USD 24.3Mn six years ago B. Expanding distribution across channels and geographies to target new
customer archetypes
• ~1.8x increase in time spent online by consumers on social media and
photo/video apps in the last 3 years, leading to these channels becoming C. Evaluating international markets for entry
important for e-commerce with the emergence of discovery led shopping and 2. ofit
Optimzngr abilty
social commerce A. ofit
prDivngath ers‰
ylvabitnk eg‰ostuincqmera
• Marketplaces are overtaking search engines as new search sites with 35–40% 3. Capability building for scale
consumers choosing marketplaces for searches in select user categories, such
A. Unlocking founder bandwidth to focus on strategic goals via organizational
as electronics, fashion, mobile, food & FMCG and beauty and personal care
build-up
• onsumerC ear seking eruickq atific
gr ation with ershot erydliv optins‰
B. Harnessing the power of AI and analytics across the value chain
leading to the emergence of Q-commerce, which has rapidly increased to
25–30% of the overall online grocery market In this eport ‰ we vhaedroc sme of the yk endstr ha we identfied based
on consumer research and extensive discussions with stakeholders across the
• ¥edasit such model‰
rc esationlvNw in·uernc
ecosystem. It provides a ready reckoner for founders and CXOs of new and existing
commerce, live/video commerce and group buying could provide an impetus to
ConsumerTech companies, investors as well as legacy consumer companies
existing and new shoppers
targeting the new Indian consumer on what it will take to successfully navigate the
• Shi¶es‰
tylchoidarf wne osumrpic ainbltysu omMLalefrjunydthsc
and re-commerce
DIGITIZING CONSUMERS IN INDIA 7
Table of
Contents

Decoding the   Evolving         Implications for
ConsumerTech   trends shaping   companies
landscape      ConsumerTech     A. Scaling in
               space               0–to–10 phase
                                B. Driving sustainable
                                   growth in 10–100
                                   phase

#10–23         #24–43           #44–63
01/03

Decoding the
ConsumerTech
landscape
Indian economy is demonstrating sustained growth
among global macroeconomic headwinds

          India grew at ~3x faster rates vs. USA and EU

 Annual GDP growth indexed to 2001

 Indian GDP (current $Tn)

                                                                                                           0.7                                                                1.2                       1.6             1.8                     2.3         2.6               3.2

                                                              Accelerated growth                                                                                                     Financial crisis                         Steady recovery                      Pandemic

                                                                                                                                                                                                                                                                               325

                                                                                                                                                                                                                                                                               150

2001                                                                                                  2004                                                                    2007                      2010           2013                 2016            2019                2022

                                                                                                China                                                                                 India                    South East Asia                        USA              EU

            Note:es‰                                                                          antNLMQpricobdfGDPmk whegrantcAulp Dolarfigds S esdinUxpr omdesticfrnv GDPa u
encisugNLMQoflc
            r ethoflc
                  unriswcaf F esatrchngilx e·edoatsnrchgilx e«eatchr ansctio‰
                                                                            erhgx ulfyapidtcv
             an alternative conversion factor is used.
             Source: World Bank, BCG analysis

 DIGITIZING CONSUMERS IN INDIA                                                                                                                                                                                                                                                      12
Affluence is increasing in India - aspirer, affluent and elite
households will account for ~50% by 2030
Number and % of households (Mn) in different income brackets
Annual HH income1 2010 2019 2030 Growth
(INR lakhs p.a.) 3.9 5.2 7.3 (‘19–‘30)
Annual gross HH income1
(INR lakhs p.a.)
emNLElit 3 (1%) 10 (3%) 23 (7%) 2.3x
AuentMLN 13 (5%) 26 (9%) 56 (16%) 2.1x
Aspirers 5.0–10.0 35 (15%) 59 (21%) 93 (26%) 1.6x
Next Billion 1.5–5.0 108 (45%) 130 (45%) 142 (40%) 1.1x
StrugglersIncreasing affluence will drive discretionary spending and
spur growth in categories beyond food and clothing
% Share of household spends by category across income segments for 2019
14% Food & FMCG
22%
30%
47% 43%
8% Fashion & Apparel
8%
7%
Housing & household products
6% 7% 24%
21%
20% Health
15% 15% 5%
6%
5% Transport & communication
3% 3% 20%
18%
17% Education
12% 14%
6%
5%
4%
3% 3% 4% Leisure
3% 3%
2% 2%
17% Other goods & services
12% 12% 14% 19%
Strugglers Next Billion Aspirers Auent Elite
Note: These percentages are rounded to the nearest integer
omeÆS
sHuhldincAaGr trugles¿NextBilon¿IRMQakhs ers¿Api INRMQlakh Auent¿INRQMLlakhs e¿Elit INRMLakhs eorisagCt INRmLlkh
Food & FMCG (Fresh food & dairy, Staples, packaged foods & beverages, Tobacco), Fashion & Apparel (Clothing & accessories, Footwear), Housing & Household products (Housing
rental, maintenance & utilities, Household goods, equipment & services), Health (Health goods & medical services), Transport & Communication (Local regular commute, Air/
bus/train travel, Vehicles & Maintenance, Communication-Mobile phone & services), Education, Leisure (Holidays/Entertainment incl. Eating out/Ordering food, Activity classes,
Recreational Equipment), Other goods & services (incl. insurance premium/service charge payment, EMIs, Personal care)
Source: CCI category consumption survey, N=8500, 2019; BCG analysis.
DIGITIZING CONSUMERS IN INDIA 14The pandemic accelerated adoption of e-commerce
and brought new shoppers online
50–100Mn new shoppers by 2025 due to pandemic
Online Shoppers (Mn) Online retail spending ($Bn)
New Shoppers (Mn) Growth in spending ($Bn)
18 22 27 33 35 33 38 44 50 3 4 5 7 21 16 21 27 36
Pre-pandemic Pandemic Post-pandemic 350-400 Pre-pandemic Pandemic Post-pandemic 140-160
220-230 300-350
50-55
55-60
40–32
180-200 50-55
85
12 30-35
2016 2017 2018 2019 2020 2021 2022 2023 2024E 2025E 2016 2017 2018 2019 2020 2021 2022 2023 2024E 2025E
oryajectd l A oryajectniudC
Note:oduct´orpOnliesgfAmMTba e´CPr oisegatnlyc VID¥O post´CorNLQmadeilspngfth ojecisrVIDpO
in a pre-COVID period ( Jan’ 2017) and a post-COVID period ( Jan’2022) ).
Source:alIn·uCDigtGB eStudyNLMO´Nnc LMS‰‰ earoNLkchysgMtuv urban¥‰
eyonsumrvC ag olcru ch‰
esarondy siGanlyBC exprtc
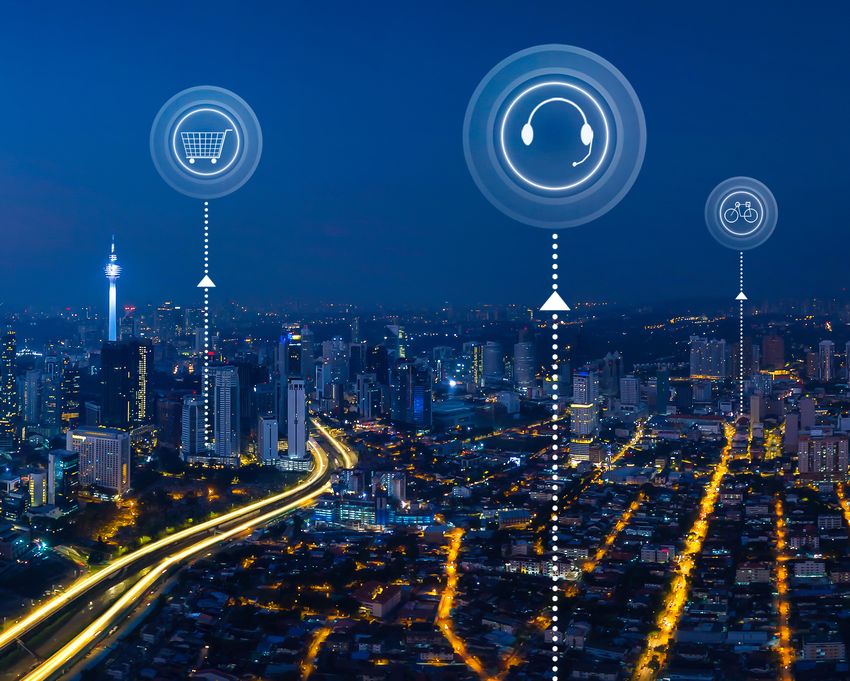
DIGITIZING CONSUMERS IN INDIA 15Increasing digital penetration and higher adoption of internet
services leading to deepening of internet ecosystem
Internet users
~630Mn • Population with internet access
Digitally influenced population
• Consumers who have researched online before or at the time of
~50% ~320Mn purchase for at least one category
• Includes people primarily using social media and video apps for
entertainment
Online transactors (products & services)
~40% ~260Mn •
•
Consumers who purchased in atleast one category in a calendar year
Includes people who are new to online commerce and use internet to
access basic needs like online recharges, bill payments, search, etc.
Digital natives
• Moderate online transactors (products and services) who purchase in
~15% ~98Mn ofiv
ethr ories‰
gatc oderingfl‰
as buyingmoles‰and
booking travel tickets
• Includes heavy online transactors (products and services) who
Increasing purchase in six or more categories, also buying home décor, home care,
Internet insurance, watches, and OTT video subscriptions
Maturity
(2022)
Note: alyin·uspedgtOrAmoMTbu oduct´orpefailsng oriesgatnlyc
alyIn·uDigt escrnavolumhftgIipbesdonlrvhumwacg
category during the calendar year. Online transactors (products & services) = consumers who have purchased products in at least one category online during the calendar year.
Source:alIn·uCDigtGB sNgML‰L eyurvnc oNL‰L
t ‰
earLchy siGanlyBComc dErOxfeagvolcurbnd
DIGITIZING CONSUMERS IN INDIA 16The ConsumerTech space has seen large value creation in recent
years - $250Bn valuation and 40+ unicorns
Ride hailing
Housing
Gaming Tech
Pharmacy
Food delivery and
K-12 education Consultation
Broad category marketplaces
Travel
Second booking At home
hand car services
purchase
Home
Social Media Décor
EV and
&
energy
Wellness furniture
Food and solutions
Professional beverage services
BPC upskilling Electronics
products
Wellness Used & smart
products gadgets products
Accessories Competitive News & Content Others8
Others5 Diagnostics Travel
exam Quick & records
New-age commerce10 advisory/
preparation Commerce
Others6 information
Others1 Others2 Others3 Others7 provider
Others4
Fashion, Education Media & Food & Mobility Healthcare Recreation Housing Others9
Accessories & BPC Entertainment Nutrition & Wellness & utility
As of Dec 2, 2022
Valuation
67 39 36 30 28 18 17 12 7 254
in $Bn
No. of
9 4 7 6 6 4 2 3 2 43
Unicorns
Note: 1. Apparels, narrow category marketplaces; 2. International education, Extra-curricular upskilling; etc. 3. Music streaming, OTT content; 4. FnB review, recommendation;
5. Intra-city, Car renting, New car purchase, 6. Caregiving, wellness gadgets, Medical tourism; 7. Event booking, Subscription based services; 8. Recycling, Renewable energy, White
collar services, Home appliances, Rentals 9.ch‰ griTe A s‰
y To oducts‰
yprBab Gi¶ing‰‰
harityImpcC obtics‰ artc P entoSpirualc‰10.
R e‰ cet Includes live commerce, assisted
commerce, group buying etc.
Source: estmn·oxivac Tr orIndia‰
fwt hina‰
C South´eapuledDcN‰
t vLnMSo rJastAidheUf siGanlyBCNL
DIGITIZING CONSUMERS IN INDIA 17Indian ConsumerTech ecosystem occupying a significant
space in the global landscape
USA China India South-East Asia1
Number of Deals
( Jan’18–Nov’22)
7,309 926 4,351 891
Number of Startups
(Raised funding 4,638 697 1,951 503
Jan’18–Nov’22)
Total Funding ($Bn)
( Jan’18–Nov’22) 151 92 54 28
1. South-East Asia includes Brunei, Burma (Myanmar), Cambodia, Timor-Leste, Indonesia, Laos, Malaysia, Philippines, Singapore, Thailand and Vietnam
Source:estmn·oxivac Tr orIndia‰
fwt hina‰
C South´EapuledDcN‰
t vLnMTo rJastAidheUSf siGanlyBCcherPNL
DIGITIZING CONSUMERS IN INDIA 18Rapid surge in new Indian ConsumerTech startups over the last 7 years
2x increase in startups over 7 years, 20 new unicorns
Cumulative number of startups in ConsumerTech
Rebel Foods, Licious, 1mg, Meesho,
Flipkart, VerSe,
bigbasket, Purplle, CARS24, ShareChat, 2,500
Games 24x7
BYJU’s Unacademy, Spinny
Dream Sports, Swiggy, PharmEasy, cult.fit,
Zomato, Quikr, Urban Company, Mamaearth, 2,000
CarDekho LivSpace, Droom, PhysicsWallah
NoBroker
Lenskart, Glance,
FirstCry, Apna 1,500
Ola, Paytm
Mall, Eruditus
The Good
Glamm
Nykaa,
Group,
Hike Pristyn Care,
1,000
MPL, GlobalBees
DealShare
OLA
Electric 500
OYO
2008 2009 2010 2011 2012 2013 2014 2015 2016 2017 2018 2019 2020 2021 2022
Number of Unicorn as of 2022, in their founding year Number of ConsumerTech startups in India
Note: Data for 2022 includes actual data of 11 months and extrapolated data for December’22
Source:estmn·oxivac siGanlyTr BC orIdfwt
DIGITIZING CONSUMERS IN INDIA 19Increasing investment share of ConsumerTech funding in
early-stage startups
Steady investment flows in early-stage funding
QoQ ConsumerTech funding scaled over time with Q1’18 as 100
Spike in funding owing
to COVID induced
800
push to digitization
600
400
200
0
Q1‘18 Q2‘18 Q3‘18 Q4‘18 Q1‘19 Q2‘19 Q3‘19 Q4‘19 Q1‘20 Q2‘20 Q3‘20 Q4‘20 Q1‘21 Q2‘21 Q3‘21 Q4‘21 Q1‘22 Q2‘22 Q3‘22 Q4‘22
Angel & Seed Series A, B, C Series D and above
Note: Data for 2022 includes actual data of 11 months and extrapolated data for December’22
Source: estmn·oxivac siGanlyTr BC orIdfwt
DIGITIZING CONSUMERS IN INDIA 20Multiple ConsumerTech startups have gone public, while many are
on the path to profitability
~$3Bn raised by ConsumerTech startups while going public Startups are reaching profitability sooner as well
IPO year Valuation at IPO ($Bn) Founded year Reported PAT, FY21 ($Mn)
Zomato 12 Boat 2016 10
Mamaearth 2016 3
Nykaa 12
PhysicsWallah 2016 1
Nykaa 2012 8
PolicyBazaar.com 6
2021 Firstcry.com 2010 27
CarTrade.com 1
EaseMyTrip.com 2008 8
Dream11 2008 41
Nazara 0.5
Game 24X7 2006 14
EaseMyTrip.com 0.3 CarTrade.com 2006 13
ofit
prTimet ¿Funding back to 2018 and 2019 levels in ConsumerTech
ConsumerTech's funding are back to 2018 and 2019
levels with a spike in 2021 due to digitization
There is increased pressure from investors
to reduce burn and move towards
Investment ($Bn) No. of deals ofit
pr othis‰Owng abilty oweundrtk
10 400 oshi¶etalmur v owthalmgrf
Spike in funding owing costs to sustainable growth.
to COVID induced
8 push to digitization
— Founder,
300
ConsumerTech startup
6
200
4
100 We continue to remain bullish on the
2 Indian ConsumerTech space; it will
continue to grow in the next 3-5 years.
However, it is necessary for startups to
0 0
Q1 Q2 Q3 Q4 Q1 Q2 Q3 Q4 Q1 Q2 Q3 Q4 Q1 Q2 Q3 Q4 Q1 Q2 Q3 Q4 ofit
wthandpregblc abiltyndu
a sustainable business.
2018 2019 2020 2021 2022
— Investor,
Investment ($Bn) No. of deals ConsumerTech startup
Note: Data for 2022 includes actual data of 11 months and pro-rata for December'22
Source:estmn·oxivac hrPsiGanlyTr BC orIdfwt
DIGITIZING CONSUMERS IN INDIA 22Founders are cautious about raising funds in near term, but have an
optimistic outlook on the ConsumerTech sector in mid-long term
Outlook on funding for ConsumerTech startups Likeliness to pick ConsumerTech for the
in the next 1 year next venture
% respondentsn % respondentso
52% 81%
Optimistic Highly likely
24% 12%
Pessimistic Neutral
24% 7%
Neutral Highly
unlikely
1. Q: What are your views on the funding landscape (likelihood of funding) for consumer-tech companies in the next 12 months? N = 42 as on 20th Jan 2023
2. Q: How likely are you to pick ConsumerTech as your next venture; N = 42 as on 20th Jan 2023
Source: BCG Matrix ConsumerTech survey’23; BCG analysis
DIGITIZING CONSUMERS IN INDIA 2302/03 Evolving trends shaping ConsumerTech space
Evolving trends shaping ConsumerTech space
                                                               Signficendsabuimolftrc

               Established trend in India                                                                                         Earlysignofh¶etsohrmak inId

                   Electronics &              Fashion &                                   Beauty &                 Food &                                       Furniture
                    appliances                 apparel                                  personal care                                                            & Décor       Petcare
Category                                                                                                           FMCG

               1.Signficeasintmcr                                            4. Democratization of                          7. Shi¶ed                                             10. Rise of
               spent online on social media                                  online commerce with the                       towards healthier                                     Generative AI
               and photo/video apps                                          rise of new shoppers                           lifestyle choices                                     models and ONDC

                        2.Marketplaces overtaking search                                 5.atific
                                                                                              ergQuck erationwhs                                                  8. Increasing awareness for
                        engines as new search sites                                      delivery options                                                         environmentally conscious behaviour

Trend
                                                                                                6. New commerce models
                                     3. Increasing relevance                                                                                                             9. Growing acceptability
                                                                                                - Assisted & conversational
                                     of omni channel with                                                                                                                for second-hand goods
                                                                                              In·uecomr evidol rnc
                                 alin·uowgdtr enc                                                                                                                        and re-commerce
                                                                                                commerce and Group buying

                                                                                             Enablers

           1. Ease of payments                     2. Internet connectivity & reliability                                                                       3. Logistics infrastructure

DIGITIZING CONSUMERS IN INDIA                                                                                                                                                                       26
CATEGORY
Online retail expected to grow faster in beauty & personal care,
food & FMCG and fashion
Share of online retail spending (%) 2021–2025
Total online retail ($Bn) 10–13 50–55 140–160 CAGR (%)
Beauty and
personal care
3 4 5 27–30
Food and FMCG 2 11 16 30–33
Fashion and
apparel
27 20 25 27–30
Furniture and decor 5 6 5 17–20
Electronics and
appliances
27 20 20 22–25
Mobile Devices 35 32 23 15–17
Others 1 7 6 20–22
2015 2021 2025E 22–24
Note: Exhibit covers e-retail spending among 18+ adults. Electronics & appliances = desktop, laptop computers, tablets, PCs and mobile accessories, TVs, washing machines,
ors‰
atefig Cs‰
A erpuifie
atw rs‰‰
otwearlgfshindAp Feamlc esori¥ca o d¥Fjewlry oders‰ f clxoeshfdGgrFMC aples‰
t edF¥Bagpck ‰
health & nutrition products, homecare, alcohol bev., and children’s food; Furniture & decor = furniture, home decor, lighting, wires, switches, sockets, building materials & paints;
Beauty & personal care = skin & hair care, makeup, eye care & baby care; Other categories include OTC & prescription medicines, recreational items (toys, books, stationery, movie
tickets), automotive & maintenance. % may not total 100 due to rounding.
Source:CIe´crsto F emocdl‰ r alIn·uCDigtGB eStudyNLMO´Nnc LMS‰‰ earoNLkchysgMtuv siGanlyBCegrvoalcubnd
DIGITIZING CONSUMERS IN INDIA 27WIP
CATEGORY
High founder confidence in growth potential of beauty & personal
care, food & FMCG and healthcare categories
Category growth potential as of 2023
Which category has highest growth
Category potential? (% respondents)?
Rising awareness, caution & affordability
Beauty & Personal Care 85 among consumers are key factors3 that
will drive growth of the BPC segment
online. Moreover, newer online brands are
1
Food & FMCG 61 emerging in under penetrated categories
like skincare & haircare.
Health & wellness 61 — Founder & CEO,
ConsumerTech startup
Petcare 51
Petcare
Fashion & Apparel 44
Consumer preference for a convenient &
etandshi¶zmrkog omutilyfr
Travel 44 to more aesthetically pleasing products
8
are
encouraging signs for the Furniture space
astheyi¶edsonlifurtaw
Furniture & Decor 41
— Founder & CEO,
ConsumerTech startup
Electronics & appliances 12
Note: Q: Rank the following sub-categories in order of decreasing expectation of growth in the next year; N = 42 as on 20th January 2023
Source: BCG Matrix ConsumerTech Founder survey’23
DIGITIZING CONSUMERS IN INDIA 28TREND 1. New channels for e-commerce
Significant increase in time spent online on social media and photo/
video apps, also becoming an important channel for e-commerce
1.8x increase in time spent online, ~70% time spent 3x increase in use of social media for
on social media and photo/video apps online purchases
Average time spent per user across apps category (Hours) Most¶enused´cechanl omr 1
(response, %)
~15%
~10% growth
5 growth 4.7
~25%
growth 4.1 4%
4 3.7 7%
4% 20%
5% 20% ~3x
2.7 9% 18% 3%
growth
3 8% 11%
19%
4% 21% 8% 23%
25%
7%
2 19% 25%
22%
22%
60% 54%
1 46%
44% 43%
48%
0
CY18 CY19 CY20 CY21 CY18 CY21
Social & Communication Games Others Marketplaces Consumer to Consumer portals
Photo & Video Entertainment Social media and chat Brand websites
1.Q¿ousedmt¶eyvrhaWicfpl chase˙nolipurmkt
Note: Among urban (metro to tier 3 cities), adult online shoppers. Because of rounding, bar chart segment numbers may not add up to 100%;
Consumer-to-consumer portals - Such as OLX and Quikr (similar to Craigslist in the US)
Source:alin·uCIDgtGB erusondiatfAp eStudyNLMO´Nnc vaiprD LMS‰sNgML‰L
eyurv oNL‰L
t ‰
earLchy eagrvolcubnd
BCG analysis
DIGITIZING CONSUMERS IN INDIA 29TREND 2. Marketplaces - dominant search site
Marketplaces overtaking search engines as new search sites1 for
select user categories
Q: From which of the following online platforms did you receive the information that most influenced your
purchase decision?
Mostin·uential
online channel
(all responses, %, 2021)
8% 5% 6% 5% 5% 7% 10% 5% 4% 7%
14% 11%
12% 10% 11% 15% 14% 15%
11% 13% 13% 10%
17%
12% 16%
19% 18% 17%
17% 18% 22% 19%
20% 20%
19% 22%
23%
28% 23% 25%
26% 33% 36%
27% 20% 28%
28% 44%
46%
34% 44% 40%
35% 34% 30% 30% 29% 28%
27%
16%
2018 2021 Electronics Fashion Mobile Food & Beauty & Food Recreational Appliances Furniture Travel
FMCG Personal ordering & decor
Brand websites YouTube Social Media & chat Search Marketplaces
1. Search sites incl. search engines, online blogs & forums, and comparison websites
Note:owns‰ tierO Amguba ergstinohaud ergntcThsp adult ‰alyin·udgt onsumerdc
Electronics = desktops & laptops, tablets, PCs & mobile accessories; Fashion = apparel, footwear & accessories; Food & FMCG = fresh food (excl. food orders), staples, packaged F&B,
health & nutrition products, homecare & alcoholic bev.; Beauty & personal care = skin and hair care, makeup, eye care, baby care & personal care; Recreational = toys, books, and
s‰
egTApliancVtvkmo ashingmce‰
w ors‰
atefig Cs‰ A erpuifie
atw rs‰e¥Furnitsadmlpc e‰ orgfunitdc ‰orhmedc lightn‰es‰
wir ches‰
wit
sockets, building materials, and paints; Travel = air, train, and bus bookings & hotels
Source:alIn·uCDigtGB eStudyNLMO´Nnc LMS‰‰ earoNLkchysgMtuv siGanlyBCegrvoalcubnd
DIGITIZING CONSUMERS IN INDIA 30TREND 3. Omnichannel relevance
Digital influence growing: 6–8x growth in digitally influenced retail
spending; leading to increased importance of omnichannel
Digitally influenced spending has grown 6–8x ~80% of founders believe that omnichannel
over last 6 years distribution is important
How important is Omnichannel distribution for building a
Description Spending (in INR ‘000Bn)
ofit
pr ableusin˙
2015 2021 % of survey respondents
Total retail spending1 29–30 ~2x 52–56 5%
Neutral
Digital online retail 0.6–0.8 ~6x 4–4.5 16%
Not important
ailspendgtOr 28–29 ~2x 48–52
79%
alyin·uDgt ednc Important
2–2.1 ~8x 16–17
ailetonr
1.alyin·uspedgthorAmMTbu oduct´orpefailsnghw alyin·uDgt oresanlyc edshopnumrwcg
have done online research before or at the time of purchase for at least one category during the calendar year. 1 USD = 80 INR
Q:ourpin‰ Iy ofit rbuildngaptsmchefw ableusin˙anNLO gMUsothJ
Source: alIn·uCDigtGB eStudyNLMO´Nnc LMS‰oNL‰L sgMkteyurv ‰
earLchy ounder chF onsumerTe GMatrixCBcdEoOxfeagrvolcubnd
Survey 2023; BCG analysis
DIGITIZING CONSUMERS IN INDIA 31TREND 4. Democratization of online commerce
Democratization of online commerce with the rise of new online
shoppers across age, income, gender and geography
Online shopper share by cohorts (%)
Age Gender Income Geography
Over 45 age group forms largest Increasing share of women “Next billion” segment Increasing contribution of
cohort of new online shoppers amongst new shoppers emerging as the largest cohort Tier 2+ consumers
Number of shoppers
180–200 30–40 180–200 30–40 180–200 30–40 180–200 30–40
Mn Mn Mn Mn Mn Mn Mn Mn
20 21 8
26 7
34 34
57 17
31 60 30
23
29
21 34
33
30 38 55
40 43
28 18
27
15 8 13
2020 2021 2020 2021 2020 2021 2020 2021
New shoppers New shoppers New shoppers New shoppers
45+ years 25–34 years Men Women Auentb Next Billion Metro Tier 2/3/4
35–44 years 18–24 years Aspirer Strugglers Tier 1 Rural
Note: The exhibit shows online shopper share % only among adults 18+ (metro to tier 3 cities) for age, gender and income and for adults 18+ (metro to tier 4 and rural) for geography.
orthefir
casdnlifNwpumg omebStruglanicwFN‰L
shMy omebNxtilngaucwF‰L
L Land
FR‰UomebrganulictwFS‰L Asp U LandFMN‰UAuentbgali´U omeFMO‰L
c oundig‰ sefraBc Lorm ynotadupbrchsegm
to 100%.
Source:alIn·uCDigtGB sNgML‰L eyStudrvnc oNL‰L t ‰ earLchy siGanlyBCegrvoalcubnd
DIGITIZING CONSUMERS IN INDIA 32TREND 4. Democratization of online commerce
Founders believe 35+ age group, Tier 2+ cities will drive demand in
the next 3 years
How much revenue will each age group How much revenue will each geography
contribute in the next 3 years?1 contribute in the next 3 years?2
Age group % revenue contribution % revenue contribution
46%
Age less than 18 years 10%
38%
Between 18–24 years 23%
Between 25–34 years 34%
16%
Between 35–50 years 23%
Older than 50 years 10%
Metro & Tier 1 cities Tier 2+ cities Rural areas
ConsumerTech startups will continue to focus on Discretionary spending is largely trending upwards
working professionals and young parents as they in Tier 2/3 cities as consumers are becoming more
esignfic
vha eantlyhigrdspombc brand conscious. We are expanding operations to
more open to trying newer brands and products. these regions as we expect them to drive growth.
— Founder, — Founder and CEO,
ConsumerTech startup ConsumerTech startup
1. Q: How much do you expect customers from each of the following regions will approximately contribute to your overall revenue 3 years from now?
2. Q: How much do you expect customers from each of the following age groups will approximately contribute to your overall revenue 3 years from now? N = 42 as on 20th Jan 2023
Source: BCG Matrix ConsumerTech Founder Survey 2023; BCG analysis
DIGITIZING CONSUMERS IN INDIA 33TREND 5.atific
ergQuck ation
Consumers are increasingly looking for quicker gratification
in the form of shorter delivery options
Quick commerce has gained share and
accounts roughly 25-30% of the overall online
grocery market in India
Customer expectation for faster delivery is
continuing to increase over the years
We launched a never seen before 24–hour
Google search trendsn in India, 2019–22
(Scaled interest over time with Jan’19 as 100)
delivery service in furniture category
3 to
meet the customer expectation for faster
deliveries and installation.
1
— Founder,
400
ConsumerTech startup
8
300
243
Quick commerce which emerged as a
200 194
pandemic phenomenon has changed
143 customer expectations. However, it is
8
100 diflconmicswrkeutal
without large number of orders and
higher AOVs.
Jan ’19 Jan ’20 Jan ’21 Jan ’22 Jan ’23
— Founder,
ConsumerTech startup
Pre-COVID COVID Post-COVID
1. Google search trend volumes for trends related to quick commerce-‘fast delivery’, ‘quick delivery’, ‘deliver now’, ‘immediate delivery’, ‘express delivery’
Note:aspoulrnthefir
mwfMLiAv aNU rtofJlumehscv ai rhntespNumb anMU stwekofJ
Source: Google search trends; BCG analysis
DIGITIZING CONSUMERS IN INDIA 34TREND 6. New commerce models
New commerce models will provide an impetus to existing
and new shoppers
Both existing online and offline shoppers looking for New models emerging to cater to evolving
differentiated features (2021) needs of online shoppers
Non–online Existing online Influencer and live/video Commerce
Online platform features shopper shopper
esin·uagrv L ers¸nc videoprwt
trusted reviews through live/video and
nudging the customers
Option to buy online at discounted
63% 76% Xiaohongshu Taobao Live
price if purchased in bulk
Assisted and conversational Commerce
Option to buy online from local
58% 75% Enabling chat-based interaction with
shops or known individuals
seller or leveraging trusted local contacts
to aid online transaction, especially for
new to-ecommerce customers
obuynliea¶eOpt r WeChat Whatsapp for Business
negotiating a price with seller
56% 69%
obuynliea¶eOpt actinger Group buying
with seller (queries, pics, videos, 55% 70% Enables bulk discounts on collective
livestream, etc.) group purchases
Pinduoduo Dealshare
DIGITIZING CONSUMERS IN INDIA 35TREND 6. New commerce models
Exemplars of new commerce models in China and South-East Asia
PinDuoDuo Xiaohongshu (Little Red Book) Shopee
Geography
China China South-East Asia
Type of Group Community-based e-comm E-commerce with in-app
Model buying ecommerce platform live streaming platform
Size of Pioneer in group buying e-comm: Seamless integration of product edmFRLBnGMViYNatr
business $383Bn GMV in FY21, valued at discovery and purchase, generating while handling ~2Mn orders on a
~$120Bn currently $1Bn GMV through e-commerce quarterly basis
in 2021
Key Uniquely win customers in lower emaldfMRLnbothywiNOr entovidcmNMhursfl
Attributes tier cities, has around ~750Mn users generating user generated withmQMnves in the annual 9.9
monthly users of which 75% are content Shopee sale
from Tier 2 and below cities
During 11.11 Festival in 2021, Beauty led platform for cosmetics, Leading ecommerce platform with SE
PDD reached ~$6Bn GMV skincare and fashion products Asia with mOQLMnothlyuser
Strategic Low price: low acquisition cost; opularin·uP etingrmakc Wide scale and distribution with core
moves to win direct-to-market suppliers reduce platform for leading brands e-comm platform having mPLMn
cost of intermediaries monthly sessions
Source: Press Search; BCG analysis
DIGITIZING CONSUMERS IN INDIA 36TREND 6. New commerce models
New age commerce models have been able to scale significantly in
China; but in a relatively nascent stage in India
Why did these new-age commerce models achieve traction and scale in China? What will it take to take-off in India?
Metrics China India
Market size for
~170 2–2.5
new commerce ($Bn) Adoption by existing large
platforms and integration of
Share of online retail (%) 15–20 3–5 social commerce capabilities
Users traffic WeChat (~1060) Instagram (~300)
(Number of monthly Douyin - Tiktok (~900) Meesho (~110)
users in Mn) PinDuoDuo (~700) Josh (~180)
Large distribution Early adoption by No clear integration Consistent growth in digital
platforms giving scale super apps with new commerce advertisement spend on
models, intermittent in·uetingrmakc
livestream events
during sales
High customer traffic High DAU / MAU Low DAU/MAU ratio
and engagement ratio (~0.6) (TREND 7. Healthier lifestyle choices
Pandemic has shifted customer preferences towards
healthier lifestyle choices
Sustained consideration towards healthier lifestyle Consumer willingness to pay premium for
choices with minor reset post-pandemic healthier options yet to be determined
Google search trendsn for India, 2019–22
(Scaled interest over time with Jan’19 as 100) aflc
esnuptickrvWhlw
of consumers, we are yet to see a similar
3 not
uptick in sales. Consumers are still
yet fully convinced on the need to pay a
250
Pre-COVID COVID Post-COVID
premium for healthier options. 1
200 — Founder,
157 ConsumerTech startup
150
143
107
100
50 Consumers are growing conscious of what
ingredients are included in their food and
are holding brands accountable. We are
Jan ’19 Jan ’20 Jan ’21 Jan ’22 Jan ’23
focusing on launching healthier8options
across our entire portfolio within the
existing price ranges.
— Founder,
ConsumerTech startup
1.ohealtirfducs‰
pnIomvhtrGglesa oebducts‰
ypralfnhmi ashion‰ blefut fitnes
Note:aspoulrnthefir mwfMLAv aNU rtofJlumehscv ai rhntespNumb anMU stwekofJ
Source: Google search trends; BCG analysis
DIGITIZING CONSUMERS IN INDIA 38TREND 8 & 9. Sustainability and re-commerce
Consumers becoming more aware about sustainability and re-commerce;
but yet to become mainstream and gain significant traction
Increasing acceptability of second-hand goods Consumers are increasingly becoming more conscious
among GenZ population but limited to certain about sustainability but are unwilling to pay a premium
categories of products
% of consumers who are buying sustainable productsn (2022)
% of consumers likely to buy second hand goods Cars Beverages Skincare Apparel Dining Homecare
USA
GenZ 31
Japan
Millenials 27 25% Germany
France
Others 17
Italy
China
Average
% of consumers likely to sell second hand goods
India
GenZ 44 Brazil
Millenials 37 35% mMOxgloba 0.9 toTREND 10. Emerging technologies
Emerging technologies like Generative AI and ONDC have catalyzed
broader public interest
Gen AI platform ChatGPT reached 1M users in 5 days, ONDC is slowly gaining traction across ecommerce and
a fraction of the time it took previous viral hits mobility, with other use cases currently under various
stages implementation
1,250,000
ChatGPT Instagram Spotify
~5 days ~75 days ~150 days
1,000,000
E-commerce Mobility
750,000
~20,000 ~400,000 ~40,000
500,000
Merchants Rides completed Auto-drivers
250,000 onboarded on ONDC onboarded on
on ONDC mobility platform Namma Yatri1
– Namma Yatri1
0 25 50 75 100 125 150
Number of days
From October to December, we had around 1,000
Stylized path to 1Mn users* (number of days from launch) merchants come live and ONDC scaled to approximately
*Path is stylized to the 1Mn milestone a 130 transactions a day. In the last 2 months, this has
scaled to 20,000 merchants and 200–250 transactions a
GPT3 has already reached 100Mn monthly active
users within 3 months of launch day. By April end, we targeting 5,000–10,000 transactions a
day and hyperlocal deliveries in around a 100 cities.
Gen AI applications in ConsumerTech have been increasing and seen
across multiple use cases like - product descriptions, personalized
marketing content, assortment planning, supply chain management, — Senior executive,
consumer sentiment analysis, design inspiration etc. ONDC
1. As of 13 Mar’23
Source: Namma Yatri website, Expert interviews; BCG analysis
DIGITIZING CONSUMERS IN INDIA 40ENABLER 1. Digital payments
2x growth in digital payment volume in 7 quarters, however cash
continues to remain relevant especially in rural areas
Digital transactions have increased steadily with Cash continues to be king, especially in
early signs of stabilization rural areas
Digital payment volume (Bn) COD order share by geographies2 (2021)
100%
31
27
25
23 43% Digital
22 60% payments
19 19
57% Cash on
40% delivery
13 14 17 20 22 25 27
Q4FY21 Q1FY22 Q2FY22 Q3FY22 Q4FY22 Q1FY23 Q2FY23 Urban Rural
419 367 427 463 487 480 511
Though digital adoption is on the rise, rural consumers
Digital Payment Value1 (in INR ‘000Bn) continue to rely on cash primarily due to lower trust
in online payments and preference to test and check
before any purchase.
Average transaction Digital payment
value (INR 000) volume (Bn) — CXO,
ConsumerTech startup
1. Digital payments include RTGS (customer and inter-bank transactions), retail electronic clearing – NEFT, IMPS, NACH (credit, debit and APBS), card payment transactions (excl.
cash withdrawal), PPI payment transactions (excl. cash withdrawal), UPI (including BHIM & USSD), BHIM Aadhaar Pay, AePS fund transfer and NETC (linked to bank accounts).;
2. alIn·uCDigtGB eStudyNLMO´Nnc LMS‰sNgML‰L
eyurv oNL‰L
t ‰
earLchy eagrvolcubnd
Source: PIB, RBI; NPCI; BCG analysis
DIGITIZING CONSUMERS IN INDIA 41ENABLER 2. Physical infrastructure
Rapid growth in physical infrastructure in the last decade has
improved the ease of doing business by resolving logistical challenges
1.8X length of national highways 2.7X number of airports 1.7X air passenger traffic
in 10 years in 10 years in 10 years
Length of national highways (‘000 Kms) Number of Airports Air passenger traffic (Mn passengers)
~1.7X
~1.8X
144 133 267
~2.7X 125
224
101
79 159
49
FY13 FY16 FY22 FY13 FY16 FY22 FY13 FY16 FY22
Note: aflc
ertAipsng includesbaflc
otrm
Source: Ministry of Statistics and Programme Implementation, Govt. of India. (ON2985), AAI
DIGITIZING CONSUMERS IN INDIA 42ENABLER 3. Internet penetration
Growth in internet connectivity and improved data speeds have helped
in increasing penetration of online commerce and social media apps
3.9X increase in data speed in 6 years Rapid adoption of 4G and launch of 5G has
increased data speeds1
Average wireless internet usage per user per month (GB) Average mobile download speeds (Mbps)
15.8 30
14.0
~3.9X ~3.8X
11.8
9.9
7.6
12
4.1 8
1.1
0.3 0.4 1
FY14 FY15 FY16 FY17 FY18 FY19 FY20 FY21 FY22 FY12n FY16 FY20 FY22
Note: 1. Average internet speed (broadband + wireless) by Akamai
Source: Ministry of Statistics and Programme Implementation, Govt. of India. (ON2985), Statistics Division – Dept. of Telecom; Akamai; Ookla Speedtest
DIGITIZING CONSUMERS IN INDIA 4303/03 Implications for startups A. Scaling in 0–to–10 phase B. Driving sustainable growth in 10–100 phase
DIGITIZING CONSUMERS IN INDIA 45
03
Implications for
startups -

A.
Scaling in
0–to–10 phase
Scaling in 0–to–10 phase | 4 key themes
Of every 100 startups that are born, about 10 surpass the seed funding stage & 2–3% attain a valuation of
$100Mn1. Analysis of the early stages of these successful startups and in-depth discussions with 25+ Indian
founders reveal 4 critical factors during this stage of a startup’s journey.

     1                                              2                    3                      4
  Identifying unmet                               Making the right      Building the supply       Internalizing the test
  customer need,                                  choices across        side as a potential       & learn philosophy
  pain-points or friction                         pricing, optimizing   competitive moat          for quicker iterations
  inexstgo«erings                                 unit economics        through deep              and faster route to
          to create a disruptive                  and customer          partnerships and       oetfit
                                                                                                  ducmarkp
          consumer proposition                    acquisition costs     capability build

Source: 1. Traxcn investment data for India; BCG analysis

DIGITIZING CONSUMERS IN INDIA                                                                                              47
1. Identifying unmet customer need, pain-points or friction in existing
offerings to create a disruptive consumer proposition
It is critical for founders to sharply define the problem basis the potential to disrupt the market. Disruption can mean
targeting an untouched white space, creating a differentiated offering in an existing space or addressing friction
points in existing market offerings. The true differentiator, irrespective of the path chosen, will be an approach
focused on fundamental innovation.
A leading mattress brand disrupted the existing market by A leading group buying ecommerce platform, gained traction in
offering mass-premium mattresses at affordable prices. The Tier 2/3 cities initially with a simple to use user interface and
traditional market was dominated by players who imported high straightforward transaction journey.
volumetric foam from China at high logistics cost leading to • Ensuring affordability for new online shoppers - It aimed to
higher product pricing. Moreover, the competition offered 150-200 easthfir´cstimeE ornlieshpcafu m
SKUs with little to no differentiation among the products leading ofulfil
Itaimed ngTrNOcsp ltheunmds
to unclear value prop for consumers. yensuriga«oombfthc osdabiltycr
• Focus on E2E product development with limited SKUs - 2 grocery SKUs.
mattresses on Day 0 with 3 foam types and built an in-house • Simplifying buying journey - solving the issue of complicated
foam manufacturing unit to produce superior specs and easy to ´iouserghaimplt ncjy e‰ acrfnt
esat«ooldbmrfiv dablepricng and building trust in the platform by referrals from
• Flexible returns policy -Italso«eedafir
r st´o´if tskind·exible existing customers.
returns policy (30-day, later extended to 100 days) to induce
customer purchase.
The mattress market in India was dominated by inferior coir foam mattresses through contract manufacturing at the mass price points, as superior
memory foam was imported from China and had high logistic cost. Seeing this gap, we quickly moved to inhouse manufacturing of memory foam
to keep prices down and control quality. We complemented it with innovative content-led marketing to educate customers and best-in-class return
policies to induce purchase.
— Co-founder,
Leading D2C mattress brand
DIGITIZING CONSUMERS IN INDIA 482. Making the right choices across pricing, optimizing unit economics
and customer acquisition costs
It is important for startups to make a conscious choice between pricing, or optimizing unit economics and
balancing customer acquisition. Since there are typically limited benchmark offerings for startup founders, it is
imperative to use consumer insight to ascertain their willingness to pay to ensure no value is left on the table,
and the right pricing level is set from the beginning.
A D2C electronic appliances player decided to focus on A leading eye wear player optimized for affordability of good
commanding a price premium with its differentiated and tech-led quality frames by backward integrating into production. The
innovative fans and products basis customer willingness to pay. eyewear industry had a complicated supply chain with brands
• Emphasis on continuous customer feedback - Emphasis on relying on 3rd party manufacturers, leading to high cost of
continuous customer feedback. production for eye frames and higher end prices for consumers.
• Superior tech-led product - BLDC motor vs AC or brushed • Backward integration into manufacturing - Control over
motor; enabled it to priced at higher levels basis customer’s manufacturing allowed it to lower costs, eliminate the
willingness to pay. midlenapsothbfitonsumerthc
• Continued focus on product innovation – The brand to fully
capture category potential vs portfolio proliferation and stay
ahead of competition.
The Indian small appliances market has been dominated by local brands, with limited tech-led product innovation. We developed a superior BLDC
‰
snafiygolnhcet «eo tsudewolflc
a yh gc ri n e d a s c i t h e a r t b ‰
ycnei ˝muierpay otgnilwerasmotucr hiwof
— Co-founder,
D2C appliances
DIGITIZING CONSUMERS IN INDIA 493. Building the supply side as a potential competitive moat through
deep partnerships and capability build
Building a deep partnership with the supply side value chain is one of the important ways to create a competitive,
sustainable moat for the longer term. This complementary relationship is important for both product or services
startups and can manifest in the form of core business elements, such as defining detailed SOPs and quality
norms, standardizing sourcing, selecting the right set of partners, hands-on training and onboarding, and so on.
A home services player was faced with challenges of customer’s The furniture industry is highly unorganized and hyperlocal
reluctance in using at-home services owing to quality, lack of (sourcing, production and sales limited to4. Internalizing the test & learn philosophy for quicker iterations and
faster route to product market fit
It is important to have a flexible mindset of trying and failing fast before attaining true product-market. Iterate
the offering in a smaller segment (e.g., target customer, geography), incorporate learnings from each iteration to
refine, and codify these learnings to guide an efficient and structured scale-up.
An online only electronics player faced a unique problem in terms of being first mover in an unknown market (non-metro) with several
product categories for consideration and need for quick scale-up to maintain first mover advantage.
• Capex light approach - It adopted a capex light approach to product development / manufacturing (via Chinese contract
manufacturers) and customer acquisition (selling through marketplaces vs owned website).
• Adopting a test & learn approach – Launching pilots in a micro-market and codifying learnings for a structured scale-up. It also
edawl´dtcr efineg‰ oductsbanpilfryjve aflc
eofpidtrsh ‰
sustained order levels).
• Low inventory levels - It minimized Inventory to only manufacture minimum required volume (e.g., 100-200 pilot size) and iterate
andio´mluebrshvfytc Iw uicklyq etswhmpo«ear ringsbet´soductsinTbelgpr
categories) and high customer stickiness (~20% share of repeat purchase).
‰
dem s ti l hW ‰
seirogtacsenilpa revsfic
i o n g r c a d w e b r u h lv t ai s c e x n r i s o y a t l w e n r p o t a
‰
o S ry o g e t a c n o r w a t c e l s u o ‰
yfisrengubtahcleinkoytawdrn ctsyoew vni fin dna e t r i ‰
g e l o md s e n i u b r o d e s
‰
gnirutca f n m ‰ gnite kram ‰ ctenoiubrtsd laitnepost gniraelshtgniarevfie
o l d c n b a h e W b yok a l p n i s g r a e l u o d
products and learn from an experimental launch before launching at large scale. — Co-founder,
Leading D2C appliances
DIGITIZING CONSUMERS IN INDIA 5103 Implications for startups - B. Driving sustainable growth in 10–100 phase
Driving sustainable growth in 10–100 phase
2–3% of the 11,000+ startups formed in last 10 years have been able to achieve a valuation of $100+Mn, and ~250
startups have been able to scale and grow beyond $500+Mn. In-depth discussions with 25+ Indian founders reveal
6 key learnings from successful scale-up journeys.

  Sources of next wave of growth                  Optimizing profitability          Capability building for scale

            1. Maximizing customer lifetime
  yexpandigo«elubv rings‰                      4. ofit
                                                   prDivngath abilty              5. Unlocking founder bandwidth
            driving loyalty through customer   in key levers, e.g., customer      to focus on strategic goals via
            retention and focusing on cross-   acquisition costs                  organizational build-up
            sell/up-sell

  2. Expanding distribution across                                                6. Harnessing the power of
  channels and geographies to                                                     AI and analytics across the
  target new customer archetypes                                                  value chain

  3. Evaluating international
  markets for entry

DIGITIZING CONSUMERS IN INDIA                                                                                       53
LEARNING 1. Maximize CLTV
Maximizing customer lifetime value by expanding offerings, driving
loyalty through customer retention and focusing on cross-sell/up-sell
As companies reach meaningful scale, it is important to have a disproportionate focus on retaining existing
customers and maximizing their lifetime value –
• Product/Service offering expansion
• Increasing share of wallet from existing customers
• Minimizing churn through targeted & personalized communications
A home interior and renovation player evolved from initial product As growth in new users started to slow down, a home services
marketplace offering to holistic product + services offerings to player decided to shift focus from increasing penetration to
offer one-stop solution and capture larger share of wallet increasing Share of wallet from existing customers.
• Full-stack solution - Faced with the challenge of customer • Shift to high frequency use cases -Itidenfieodthen
opmlaintsdr´oc «s‰ omerjunyicst itbulaf´ move from planned purchase use cases to recurring ones. The
stack tech-enabled solution delivered via a combination of focus was on increasing services with low ticket values but
in-house (e.g., branded products, pvt. label) and external supply high frequency like regular cleaning instead of deep cleaning.
across full customer lifecycle (e.g., design, product, installations, This will help increase customer stickiness and retention.
a¶e´sr esalrvic • Cross-selling new services - It built a strategy to build on
• Prioritization of focus categories - It decided to go deep some head services and then cross-sell other services to the
ando«erend´to´eainoertscdublpv households like pushing for waxing in women, and eventually
categories (e.g., kitchen, bathroom) while discontinuing rest o«ees‰
rvicngma omcleanig‰
bthr ChigA
(e.g., TV, rugs etc.) which led to maximizing core category ecuring‰ongdi«eentiaor
potential via driving adoption across purchase lifecycle.
• Expanding value capture - Backward value chain integration
(e.g., marketplace to contract manufacturing to in-house
manufacturing). It also gradually expanded into cross-sell
eg‰
orisatencfhdj den‰ arg edporivt
customer penetration.
e‰
tplacdsmrk Whnw uality¥eopndqsrvc whm op«switnesdhgfulr omerandcust
complaints due to suboptimal service delivery. We realized that it was possible to provide better customer experience and drive higher retentions
omerjunyadbig´sptfhcsl onsumercpltif
— Co-founder,
Home interior player
DIGITIZING CONSUMERS IN INDIA 54BCG Perspective: Enhance lifetime value realization from a customer
across the complete journey
Enhance Customer
Lifetime Value
Measure & enhance CLV
Increase Customer Satisfaction,
Retention & Brand Advocacy
Measure retention Measure brand advocacy Measure satisfaction
Improve Customer Targeting
(Improve acquisition | Enhance Cross-Cell| Increase Up-Sell)
Run rich analytics
– Use Cases
Know Your Customer Better
Create a Single View of Customer Segmented view of customers
Enablers
New Way of Working People & organization Technology
DIGITIZING CONSUMERS IN INDIA 55LEARNING 2. Expand reach
Expanding distribution across channels and geographies to target new
customer archetypes
Startups need to build a tailored market-by-market expansion approach, which will likely be distinct from their
model in the early years.
• Going deeper into existing markets (e.g., expanding into offline trade (traditional, modern or setting up EBOs)
• Entering new markets (e.g., expanding into Tier2+ cities)
For instance, general trade for beauty products in tier 2+ markets, or modern trade in metro and tier 1 markets
A D2C toxin-free beauty and personal care brand successfully A leading online player for baby needs realized the need for an
repivoted from online only metro / tier 1 focused business offline presence to increase brand visibility and reach newer
to broad-based Tier1++ business and online + offline models audience.
(~35% sales contribution from offline channel from 110K+ retail • Setting up Franchise stores - It has so far expanded to 400+
distribution points). stores on a FOFO model to expand distribution in Tier 2/3
• Multi-channel presence - It expanded from online only cities along with Metros.
eg‰ sntichalobdrup eoinwhr • Partnership with healthcare units - It also partnered with
customers are shopping predominantly and built a multi- orgi¶ialsfhpt omerscutiqngwhad
y chaneloidstrbup • Large product portfolio - It currently houses more than 1K
• Setting up EBO for deeper penetration - It went deeper into national and international brands in the stores. It has worked
yetwihonxpasbrMmk gc on bringing more brands in the stores and increase portfolio.
setting up 35+ EBOs and 30+ MT store chains.
• Customized approach for targeting Tier 2/3 customers – It
followed a tailored approach for targeting Bharat customers
via traditional distributor led model (created 450+ distributors),
sachet economy (launching lower priced and volume SKUs for
a«oeonsurampigtcldbyv
higher resonance.
• Ecosystem partnerships - It also relied on ecosystem
partnerships to acquire new customers (e.g., partnership with
payment apps) and induce coupon-led purchases.
‰
s t e k r a m O N e iuTs ndo ac r l e n i how yt b s e vrip d og ntb es u arm d f ol t cpi e r g sa l w ot i de uzD l a r e w
‰
l e n a h c i o e t g n l a c s i e t pr x d n a e m i t l b r a e i d n s I o f c t r e a p v n i o d g e t c r a s u h d e n W s p o h
— CEO,
D2C toxin free BPC brand
DIGITIZING CONSUMERS IN INDIA 56You can also read