Discovering Opportunities in Canada - Corporate Presentation - TSX-V:GWM Clarence Stream Gold Project
←
→
Page content transcription
If your browser does not render page correctly, please read the page content below
TSX-V:GWM

                                Discovering Opportunities in Canada

Estrades Polymetallic Project                                     Clarence Stream Gold Project
          Quebec                                                         New Brunswick

                                     Corporate Presentation
                                            January 2018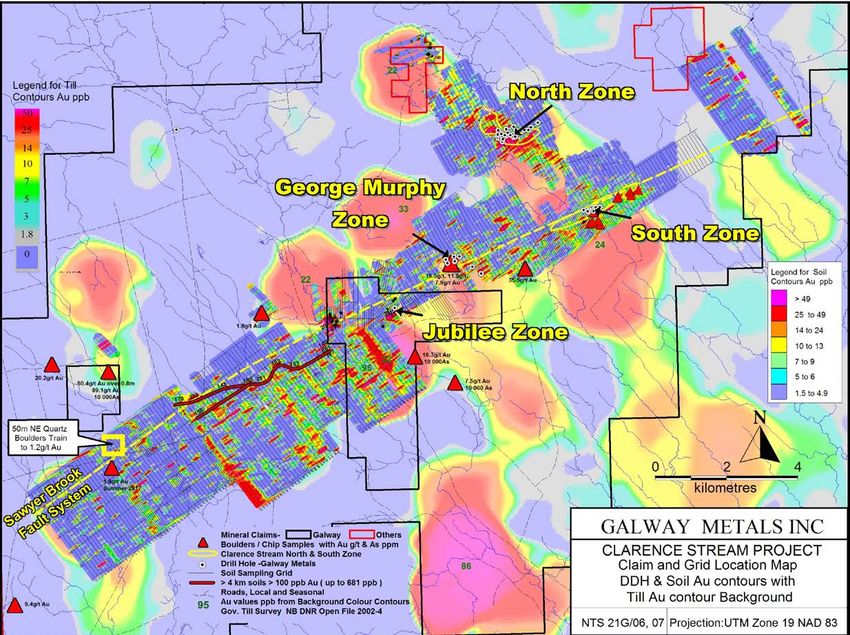
Forward Looking Statement
    This presentation contains "forward-looking information" (also referred to as "forward looking statements") which may include, but are not limited to, statements
    with respect to the future financial or operating performance of the Company, its subsidiaries and its projects, the future price of metals, the estimation of
    mineral reserves and resources, the realization of mineral reserve estimates, costs and timing of future exploration, the timing of the development of new
    deposits, requirements for additional capital, foreign exchange risk, government regulation of mining and exploration operations, environmental risks,
    reclamation expenses, title disputes or claims, insurance coverage and regulatory matters. Often, but not always, forward-looking statements can be identified
    by the use of words such as "plans", "hopes", "expects", "is expected", "budget", "scheduled", "estimates", "forecasts", "intends", "anticipates", or "believes" or
    variations (including negative variations) of such words and phrases, or state that certain actions, events or results "may", "could", "would", "might" or "will" be
    taken, occur or be achieved.
    Forward-looking information involves and is subject to known and unknown risks, uncertainties and other factors which may cause the actual results,
    performance or achievements of the Company and/or its subsidiaries to be materially different from any future results, performance or achievements
    expressed or implied by the forward-looking information. Such factors include, among others, general business, economic, competitive, political and social
    uncertainties; the actual results of current exploration activities and feasibility studies; assumptions in economic evaluations which prove to be inaccurate;
    fluctuations in the value of the United States dollar and the Canadian dollar relative to each other; future prices of metals; possible variations of ore grade or
    recovery rates; accidents, labour disputes or slow downs and other risks of the mining industry; climatic conditions; political instability, insurrection or war;
    arbitrary decisions by governmental authorities; delays in obtaining governmental approvals or financing or in the completion of development or construction
    activities. Although the Company has attempted to identify important factors that could cause actual actions, events or results to differ materially from those
    described in forward-looking information, there may be other factors that cause actions, events or results to differ from those anticipated, estimated or
    intended. Forward-looking information contained herein is made as of the date of this presentation and the Company disclaims any obligation to update any
    forward-looking information, whether as a result of new information, future events or results or otherwise. There can be no assurance that forward-looking
    information or statements will prove to be accurate, as actual results and future events could differ materially from those anticipated in such information or
    statements. Accordingly, readers should not place undue reliance on forward-looking statements.
    Michael Sutton, a consultant to the Company, is a Qualified Person as defined in National Instrument 43-101 - Standards of Disclosure for Mineral Projects
    and has reviewed the disclosure of a technical or scientific nature contained in this presentation.
    SPECIAL NOTE REGARDING ADJACENT PROPERTY INFORMATION
    The Company cautions that information in these Slides contains information regarding adjacent properties, which has been derived from public sources,
    generally company websites, and has not been verified by the Company’s Qualified Person (as that term is used in National Instrument 43-101 – Standards of
    Disclosure for Mineral Projects). The information contained in these Slides relating to adjacent properties does not include any information regarding
    mineralization on the projects of, or properties of, the Company, and no assurance can be given by the Company that any discovery of comparable
    mineralization will be made on any of the projects or properties of the Company.
    NOTICE TO CANADIAN RESIDENTS
    These Slides are not, and under no circumstances are to be construed as, an advertisement or a public offering of the securities referred to herein. These
    Slides are not an offer to sell these securities and is not a solicitation of offers to purchase these securities where the offer or sale is not permitted. No
    securities commission or similar authority in Canada has reviewed or in any way passed on the merits of the securities described herein and any representation
    to the contrary is an offence. No person has been authorized to give any information or to make any representation other than as provided for herein.
    NOTICE TO U.S. PERSONS
    These Slides are not, and under no circumstances are to be construed as, an advertisement or a public offering of the securities referred to herein. The
    securities of the Company have not been registered under the United States Securities Act of 1933, as amended (the "U.S. Securities Act"), or any state
    securities laws and may not be offered or sold within the United States or to U.S. Persons unless registered under the U.S. Securities Act and applicable state
    securities laws or an exemption from such registration is available. These Slides are not an offer to sell these securities and is not a solicitation of offers to
    purchase these securities where the offer or sale is not permitted. No securities commission or similar authority in United States has reviewed or in any way
    passed on the merits of the securities described herein and any representation to the contrary is an offence. No person has been authorized to give any
    information or to make any representation other than as provided for herein. U.S. investors are advised that the terms “inferred” and “indicated” resources are
    recognized and required by Canadian regulations, however the U.S. SEC does not recognize the terms. U.S. investors are cautioned not to assume that any part
    or all of mineral deposits in these categories would ever be converted to reserves.
    CURRENCY: All monetary amounts herein refer to Canadian dollars unless otherwise specified.

2                                                                                                                                                             TSX-V:GWM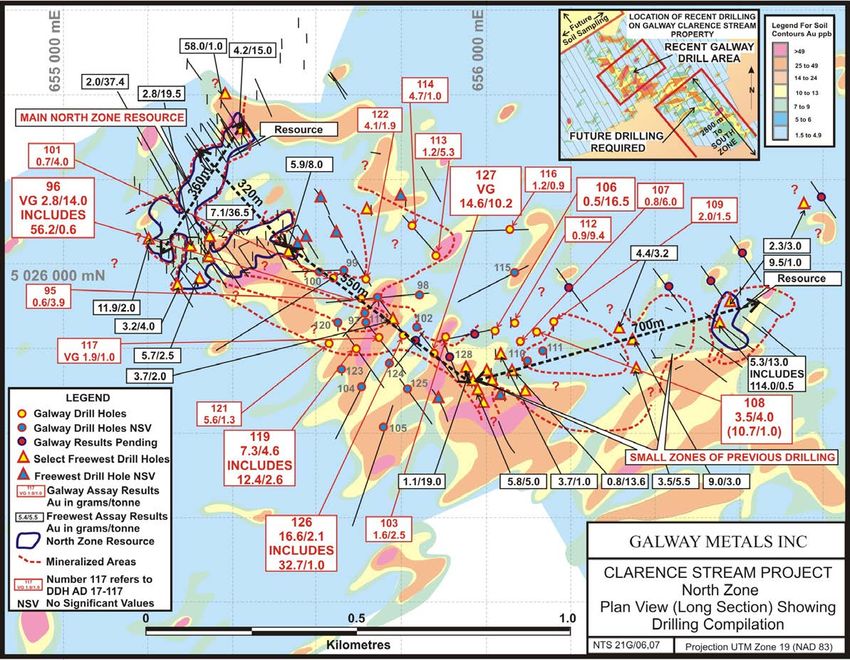
Investment Highlights
Two Canadian Projects in
A new vision for 2 previously misunderstood projects present Galway with a golden opportunity!
Mine Friendly Jurisdictions
Recent geological success has proven that the east coast can have multi-million ounce gold
deposits
First mover advantage in New Brunswick enabled Galway to secure large, 65 km land position, to
exploit district scale potential - First company to look at open pit potential at Clarence Stream
Clarence Stream – Galway increased gold resource by 54% within 12 months of drilling - M&I 390k oz @ 1.96 g/t Au +
Canada’s New Emerging Inf. 277k oz @ 2.53 g/t Au; Updated resource estimate increased ounces by >140% in the North
Gold District Zone in addition to expanding the South Zone by 30%
Successfully filled in North Zone drilling gaps to increase size of single zone to 1.6 km
Drilling at Jubilee established first satellite zone. All zones are open for expansion
Looking to 2018: The company is focused on discovering new satellite zones to demonstrate the
district scale potential of Clarence Stream, and on expanding existing zones
Resource expanded by 300% using current metal prices. The resource update put the most recent
resource at 800,000 oz AuEq or 1.0B lb ZnEq - 31 km of Strike length, 3 mineralized horizons
Estrades –
2017 drilling in gap areas to increase resource; updated resource estimate expected in Q3/18
High Grade Resource with
Utilize geological and new I.P. data to drill deep holes to try to find copper source vent systems
Deep Copper Potential
Undertaking Gravity and TITAN geophysical surveys to delineate best deep targets, probe Newiska,
Casa Berardi and along strike at Estrades
GWM Shares are GWM shares trading at Cdn$17 EV/oz for gold only, or Cdn$10 EV/oz on an AuEq basis vs market
Undervalued Opportunity average of Cdn$48 EV/oz
>$15mm in Historic Galway continues to take advantage of 230,000 metres of historic drill data, extensive soil
Exploration sampling and geophysical data
Management/Directors
3 Management interests are aligned with shareholders
own 21%
Management Track Record Prior Company (Galway Resources) was sold at an all time high of US$340 million
TSX-V:GWM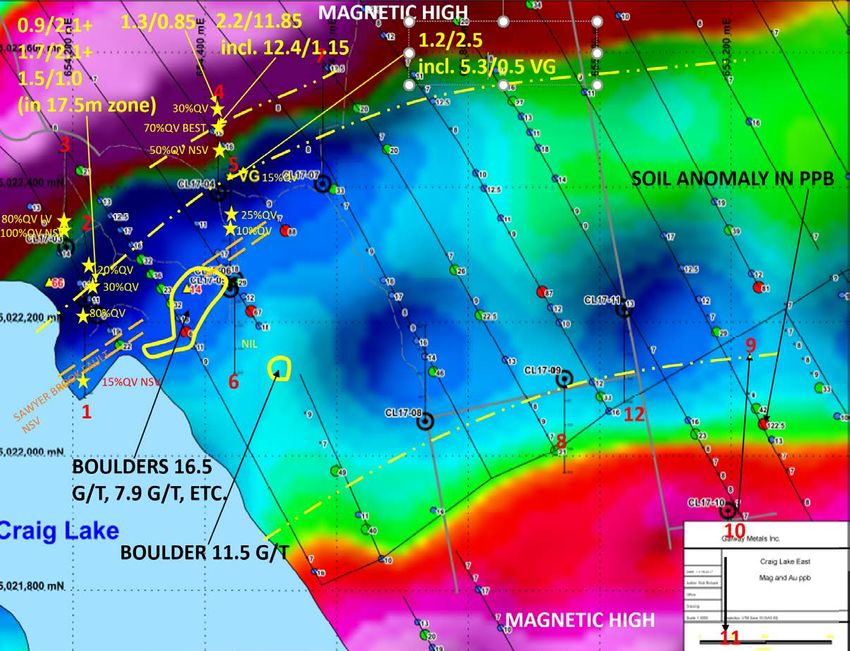
Capital Profile – Well Funded for 2018

                                                                  Cash                                C$8.5 mln (Q3/17
                                                                                                      + Financing)
                                                                  Debt                                $0.0
                                                                  Market Cap                          C$27 mln
                                                                  Shares O/S                          74,765,908
                                                                  Warrants                            7,809,992
                                                                  Options                             6,725,000
                                                                  52-week (H-L)                       C$0.45 - C$0.23
                                                                  Management / Directors /            30% - 35%
                                                                  Friends / Family

    Board of Directors

    Robert Hinchcliffe – President and CEO                                        Robb Doub – Director

    Mike Sutton – Vice President of Exploration, Director                         Joseph Cartafalsa–Director

    Larry Strauss – Vice President of Corporate Development, Director             Alfonso Gomez–Director

4                                                                                                                  TSX-V:GWM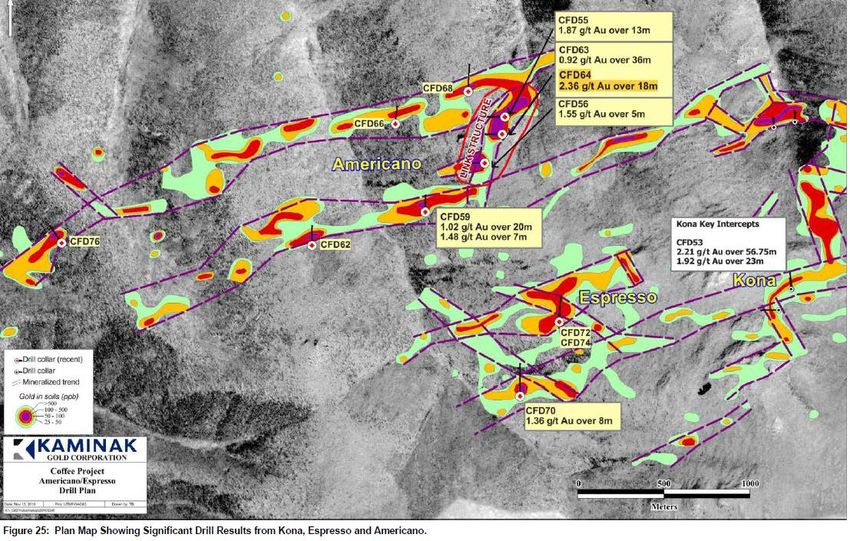
5
$0
$100
$120
$140
$160
$20
$40
$60
$80
Zn (mm lb)
Sb (mm lb)
Cu (mm lb)
Ag (mm oz)
Excluded are:
Osisko Mining Corp
Monarques Gold Corp
EV/oz Au M&I
32.1
Auryn Resources Inc
228.0 115.5
39.1
Source: ThomsonOne, RCKS Estimates
22.0
5.8
Pure Gold Mining Inc
Nighthawk Gold Corp
IDM Mining Ltd
2.7
Marathon Gold Corp
Average
M&I
Golden Reign
Resources Ltd
Corvus Gold Inc
Inferred
Eastmain Resources
Inc
Granada Gold Mine Inc
• Note: Galway Metals EV/oz represents gold resources only; Gold represents 57.5% of Galway’s in-situ resource value.
Red Pine Exploration
Inc
Red Eagle Exploration
Ltd
Alexandria Minerals
Corp
Sarama Resources Ltd
Galway Metals Inc *
Atacama Pacific Gold
Corp
Coral Gold Resources
TSX-V:GWM
Ltd
Exploration and Development Comparables (C$ EV/oz Au)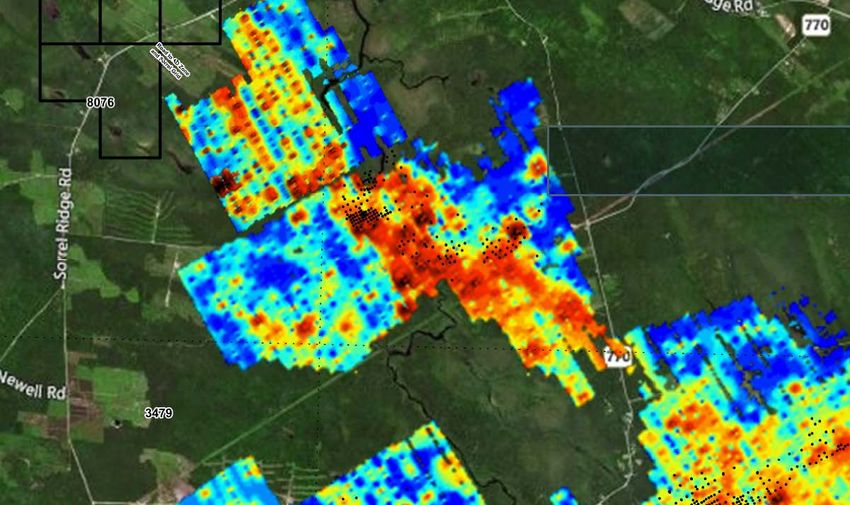
Clarence Stream – New Emerging Gold District

6                                           TSX-V:GWM
Clarence Stream Project Highlights
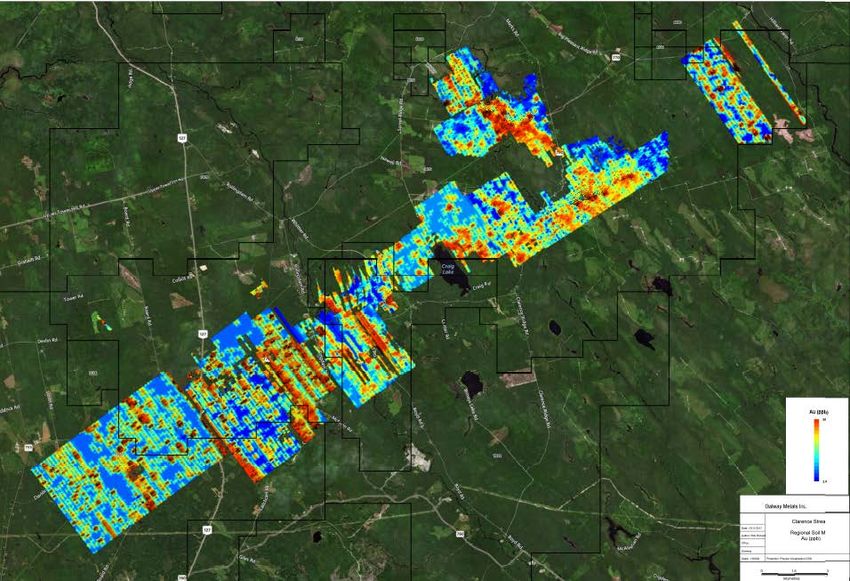
First mover advantage – 65 km strike length (60,465 hectares) showing strong gold-in-till,
soil, boulder and chip samples along magnetic lows – Most anomalies are untested and line
up along the Sawyer Brook fault
East Coast gold deposits on the rise – Marathon Gold @ 2.9M oz (MOZ Cdn$150M Mkt Cap),
Vision for New East Atlantic Gold over 2M oz (AGB Cdn$275M Mkt Cap), Halie Mine over 4M oz (OGC Cdn$2.1B
Coast Gold District Mkt Cap)
Maiden open pit resource – More than doubled ounces in the North Zone and increased North
Zone strike length by 400%
Expanded and better understand Jubilee Zone, 5km SW of and along strike of the South Zone
North, South and Jubilee Zones open in all directions for resource expansion
Clarence Stream 100% option: Cdn$3.5 mm in Aug 2016 (Cdn$1.75 mm paid to date)
Historic: 54,000 m of drilling, 10,000 soil samples. GWM: 20,000 m of drilling, 15,000 soil
samples
Metallurgical Tests: 90% gold and antimony recoveries via gravity, flotation and carbon-in-leach
Work Done to Date
(CIL) milling
Mount Pleasant Mine and Mill: Located adjacent to Galway’s property; closed since 1985 but
permitted tailings facility, buildings and power line
Drilling: 12,000 meters or 70 holes with a focus on new satellite discoveries
Soil Sampling: Take 5,000-10,000 additional soil samples for target generation
Plans for 2018 Drilling Craig Lake and other areas in between South Zone and Jubilee, and drill 4km+ target
west of Jubilee in search for additional satellite discoveries
Drill North, South and Jubilee zones that are open in all directions for resource expansion
7 TSX-V:GWM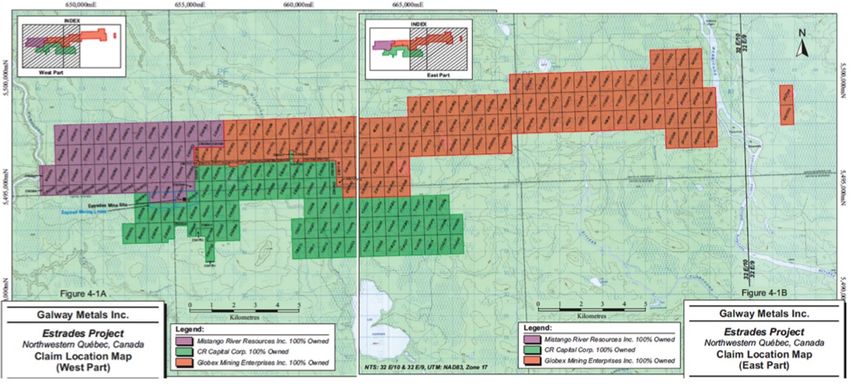
New Clarence Stream Resources
                   M&I 390k oz @ 1.96 g/t Au + Inf. 277k oz @ 2.53 g/t Au
                Updated Mineral Resource Statement for Gold, Clarence Stream Gold Deposit,
                  New Brunswick, Canada, by SRK Consulting (U.S.) Inc., August 21, 2017
                                        Cutoff Grade                                       Tonnes                   Au Grade         Au Ounces
    Area                                                           Class
                                          Au (g/t)                                          (000)                     (g/t)            (000)
                                                                   Measured                     28                      2.96              2.7
                                                                   Indicated                 1,593                      1.96            100.4
    North Pit                                   0.42
                                                                   M&I                       1,622                      1.98            103.0
                                                                   Inferred                  1,838                      2.09            123.3
                                                                   Measured                    207                      1.66             11.0
                                                                   Indicated                 4,081                      1.81             38.0
    South Pit                                   0.42
                                                                   M&I                       4,289                      1.81            249.0
                                                                   Inferred                    709                      1.31             29.9
                                                                   Measured                    236                      1.81             13.7
                                                                   Indicated                 5,675                      1.86            338.4
    Total Pit                                   0.42
                                                                   M&I                       5,910                      1.85            352.2
                                                                   Inferred                  2,723                      1.87            153.1
                                                                   Indicated                   267                      4.39             37.8
    Underground                                 2.55
                                                                   Inferred                    862                      4.48            124.1
                                                                   Measured                    236                      1.82             14.0
                                                                   Indicated                 5,941                      1.97            376.0
    Total Gold Resource                    Variable
                                                                   M&I                       6,178                      1.96            390.0
                                                                   Inferred                  3,409                      2.53            277.0
                         Updated Mineral Resource Statement for Antimony, Clarence Stream Gold
                       Deposit, New Brunswick, Canada, by SRK Consulting (U.S.) Inc., August 21, 2017
                                                                                                                   Au Eq
                                                    Tonnes        Sb Grade        Sb Pounds
                    Area                Class                                                             Grade             Ounces
                                                     (000)           (%)            (000)
                                                                                                           (g/t)             (000)
                    North Pit                       1,153          0.50           12,746                    1.1            42.5
                    South Pit                       1,421          0.28            8,633                    0.6            28.8
                                        Inferred
                    Underground                       162          0.18              650                    0.4             2.2
                    Total Sb Resource               2,736          0.37           22,030                    0.8            73.4
                                        Please see Resource Notes on the last slide of the presentation

8                                                                                                                                                TSX-V:GWM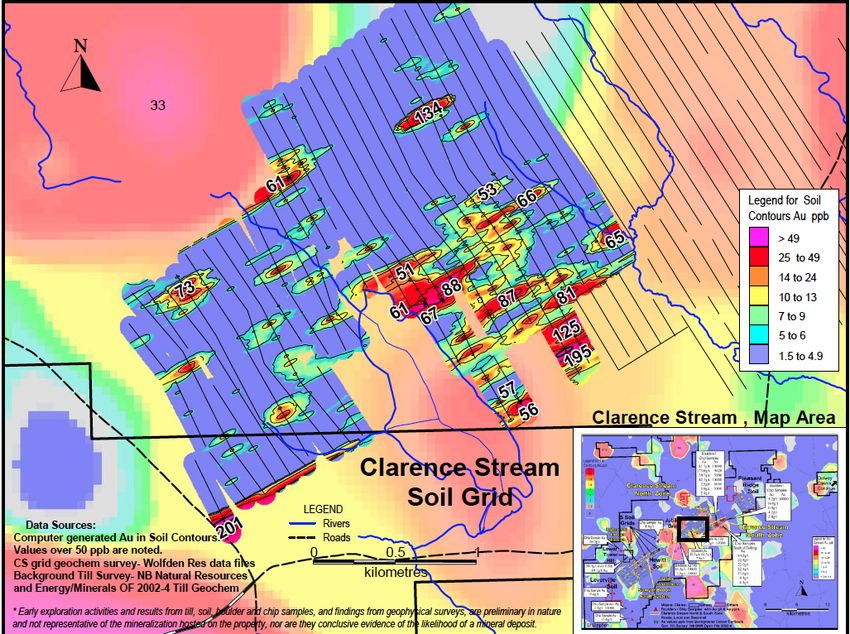
Marathon’s Newfoundland Project Provides a Similar Geological Setting,
                    Current Resource at 2.9 million ounces – GWM 2X the Strike Length

    Geological Map of Galway’s Clarence Stream Project

9                                                                                   TSX-V:GWM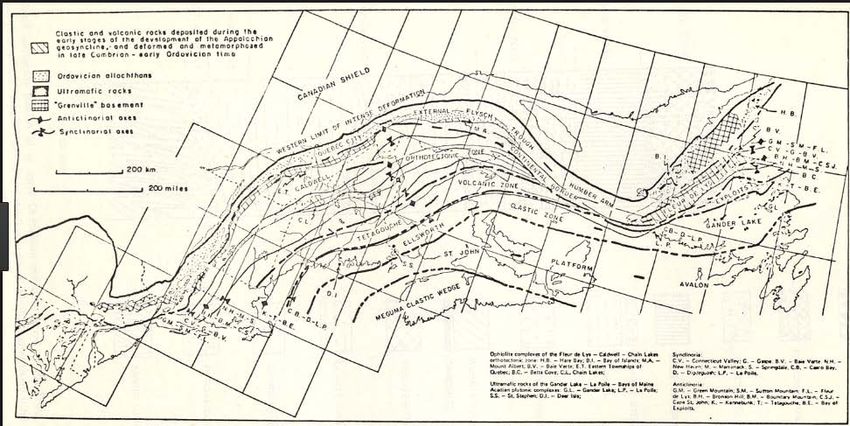
Soil Anomalies are Great Pathfinders for New Discoveries …
      Particularly Along the Sawyer Brook Fault System

     New Discovery!

10

                                                              TSX-V:GWM
SOIL SAMPLES PROVE UP MINERALIZATION
North of the North Zone
Potential strike extension
Clarence Stream North Zone
More than doubled ounces in the North
Zone and increased North Zone strike
length by 400%
South of the North Zone
Potential strike extension
Clarence Stream
South Zone
35.5 g/t Au Boulder. To be
drilled Potential new zone
Craig Lake East
Currently being drilled
Drilling to Occur soon West of Craig Lake
5 soil samples >200 ppb
Jubilee Zone
Expanded by drilling
>4 km anomaly with 11
soils > 100 ppb Au up to
681 ppb
11 TSX-V:GWMLooking to Expand High Grade Gold Lenses in the South Zone
Source: SRK Consulting (U.S.)
12 TSX-V:GWMNorth Zone Significantly Expanded by Drilling Anomalies
Step out drilling resulted
in a more than doubling
of the North Zone
Resource
Total length of the
mineralized corridor is
now
1.6 km, up from 320 m.
Open for 1.5 km to the
NW and 2.8 km to the SE
Highlights of Galway’s
North
Zone drill program
include:
14.6 g/t Au over
10.2m
7.3 g/t Au over 4.6m
16.6 g/t Au over
2.1m
2.8 g/t Au over
14.0m
13 TSX-V:GWMNorth Zone and open Soils
North Zone Resource
103,000 oz @ 1.98 g/t Au +
123,300 oz @ 2.09 g/t Au
14 TSX-V:GWMEstrades Polymetallic Project, Quebec 15 TSX-V:GWM
Acquisition View: Existing High Grade
     Resource to Build Upon; 3 Trends to Explore

                                                      AURVISTA

                                             GLOBEX

      Approximately 200,000 Meters Drilled
        Along the Estrades, Newiska and
              Casa Berardi Trends

16                                                               TSX-V:GWM
Estrades Polymetallic Project Highlights
300% increase in Estrades resources announced upon completing the acquisition in Aug
2016
31 km of strike length (20,915 hectares) hosting three mineralized trends, Estrades,
Estrades High-Grade
Newiska and Casa Berardi
Polymetallic Mine with
Historic Drilling: 90,000 metres at Estrades and Newiska plus 90,000 metres at Casa
Copper Potential at
Berardi
Depth
Drilled 12,000 m mostly in gap areas in 2017 for resource expansion
Consolidated 100% of the Estrades mine and related properties for $1.35 mm in Aug
2016
Breakwater spent CDN$20 mm on a 200 m deep by 150 m along strike decline and
ventilation raise, shipped ore to Matagami mill then smelter at Rouyn-Noranda, mining
ceased due to low metal prices and high contract mining costs
Former Producing Mine
Production in 1990-91: 174,946 tonnes grading 6.4 g/t Au, 172.3 g/t Ag, 12.9% Zn and
– Largely Dormant for
1.1% Cu
25 years
Recoveries: 93% Zn, 90% Cu, 86% Pb, 78% Au and 63% Ag at Matagami; crushing,
grinding, gravity, flotation and cyanidization
Mineralization: Good continuity over 1.8 km of strike; amenable to long-hole mining
Drilling: 13,000 metres at Estrades and Newiska – 4 deep holes +12 wedges holes +19
others at Estrades +10 Newiska
Conduct geophysical surveys to further uncover the copper potential at depth and gain
Plans for 2018 exploration insights into Estrades, Newiska and Casa Berardi (January 2018); drill best
targets
Test potential at depth at Estrades for copper feeder system; Update 43-101 Resource
(target 1 million oz gold equivalent resource) Q3/18
17 TSX-V:GWMEstrades NI 43-101 Updated Resource Summary
Technical Report On The Mineral Resource Estimate For Estrades Project, Northwestern Québec, Canada, by
Roscoe Postle Associates Inc. September 30, 2016
Lens Au Eq Zn Eq Au Ag Zn Cu Pb
Class Tonnes
Name (g/t) (%) (g/t) (g/t) (%) (%) (%)
Indicated Main 912,000 13.71 25.20 4.25 158.4 8.84 1.22 0.71
Central 388,000 9.23 16.98 3.05 89.6 5.87 0.88 0.50
Total Indicated 1,300,000 12.37 22.75 3.89 137.9 7.95 1.12 0.65
Inferred Main 354,000 7.68 14.12 1.72 83.4 4.82 1.17 0.41
Central 233,000 6.49 11.93 2.57 55.8 4.04 0.45 0.35
East 631,000 7.59 13.96 1.05 65.0 4.11 1.99 0.15
Total Inferred 1,219,000 7.42 13.64 1.54 68.6 4.31 1.46 0.26
Au Eq Zn Eq Au Ag Zn Cu Pb
Class Lens Name (oz) (000 lb) (oz) (oz) (000 lb) (000 lb) (000 lb)
Indicated Main 401,901 506,744 124,618 4,644,594 177,738 24,529 14,275
Central 115,177 145,223 38,048 1,117,731 50,212 7,527 4,277
Total Indicated 517,078 651,967 162,666 5,762,325 227,950 32,057 18,552
Inferred Main 87,405 110,206 19,576 949,220 37,617 9,131 3,200
Central 48,584 61,259 19,252 418,011 20,753 2,312 1,798
East 154,005 194,181 21,302 1,318,683 57,175 27,683 2,087
Total Inferred 289,994 365,645 60,131 2,685,915 115,544 39,126 7,084
18 TSX-V:GWMEstrades – Longitudinal Section
1.4% CU/7.4 4.7 AU 4.9% ZN/2.4 72.5 AU/1.6
22.4 AU+ 10.4% ZN/1.6 7.8% ZN/0.5
4.9% ZN/1.8
NSV
25
27 01
20 NSV
5.1% CU/1.7
LV
23
27
5.7 AU/2.7 22 17 02 0.6 AU/4.9
24
26-DIDN’T GET THROUGH FAULT 26 9.6% ZN/1.1 03
NSV 7.4% CU/1.9
27
15.7% ZN+ 5.2 AU/1.5
28W1
4.0% ZN 4.7% CU/2.7
19AW
6.0% ZN/2.7 07
STRONG CONDUCTOR 28 NSV H-082
(GEOPHYSICS) H-072 19A
0.9m 9.3%CU, 2.7%ZN
5.7m @ 8.9%ZN NSV
28.5% ZN+ 2.2 AU/3.3 +18.6% ZN/2.7
08W1
H-116 08W2 08 6.1%
ZN/1.85 EME-02
8.9m @ 0.5G/T AU, 1.7%CU, 1.5%ZN 4.0m 1.3%CU
Incl. 4.2% CU/2.4m 4.2% ZN+ 1.1 AU/17.7 (INCL 9.7% ZN/4.6) H-154
H-293 Incl. 4.1% CU/0.3m
EME-07 9.2m 0.9%CU 7.6% ZN/1.9m
OPEN TO DEPTH: SEARCH FOR COPPER-RICH VENT SYSTEMS 6.4m 2.4%CU Incl. 2.6% CU/1.0m
21
Incl. 7.4% CU/0.6m
PREVIOUS DRILL HOLE- MINERALIZED
GALWAY 2017 DRILL HOLE
PLANNED DRILLHOLE-NOT DRILLED YET
PLANNED WEDGE HOLE-NOT DRILLED YET
PREVIOUS DRILL HOLE- NSV
LV LOW VALUES
NSV NO SIGNIFICANT VALUES
19 OPEN
TSX-V:GWMEstrades Has Better Shallow Resources;
Looking for Something Similar to McLeod Deep
20 TSX-V:GWMTSX-V:GWM
Discovering Opportunities in Canada
Estrades Polymetallic Project Clarence Stream Gold Project
Quebec New Brunswick
AppendixGalway Metals Resource Statement
Clarence Stream and Estrades Projects
Au Eq Zn Eq Au Ag Zn Cu Pb Sb
Deposit Class Tonnes
(g/t) (%) (g/t) (g/t) (%) (%) (%) (%)
Measured 236,000 1.81
Clarence Stream Indicated 5,942,000 1.97
M&I 6,187,000 1.96
Estrades Indicated 1,300,000 12.37 22.75 3.89 137.9 7.95 1.12 0.65
Clarence Stream Inferred 3,409,000 2.53 0.37
Estrades Inferred 1,219,000 7.42 13.64 1.54 68.6 4.31 1.46 0.26
Au Eq Zn Eq Au Ag Zn Cu Pb Sb
Deposit Class
(oz) (000 lb) (oz) (oz) (000 lb) (000 lb) (000 lb) (000 lb)
Measured 14,000 14,000
Clarence Stream Indicated 376,000 376,000
M&I 390,000 390,000
Estrades Indicated 517,078 651,967 162,666 5,762,325 227,950 32,057 18,552
Total M&I 907,078 552,666 5,762,325 227,950 32,057 18,552
Clarence Stream Inferred 350,400 277,000 22,030
Estrades Inferred 289,994 365,645 60,131 2,685,915 115,544 39,126 7,084
Total Inferred 640,394 337,131 2,685,915 115,544 39,126 7,084 22,030
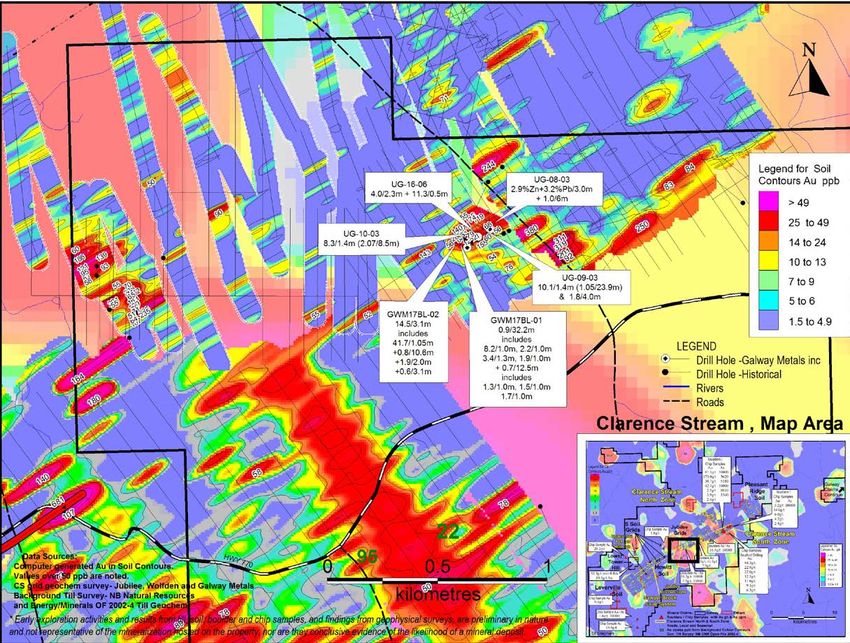
22 TSX-V:GWMGeorge Murphy Zone: Boulders with 16.5 g/t, 11.5 g/t &
7.9 g/t Coincide with Strong Gold-In-Soils
• Prospector sent in
BOULDERS to follow up soils:
16.5 g/t Boulders assayed
13.5 g/t 16.5 g/t, 11.5 g/t,
7.9 g/t 7.9 g/t and
4.2 g/t 4.2 g/t.*
1.1 g/t • Corresponds with
gold and arsenic
till and soil
anomalies.
• Never been drilled.
* Chip samples
and boulders are
selected samples
and are not
representative of
the mineralization
hosted on the
property.
23 TSX-V:GWMGeorge Murphy Zone: Every Soil Anomaly Drilled to Date Overlies
Gold Mineralization
• George Murphy is the
fourth zone discovered
by drilling at Clarence
Stream
• The new discovery was
found by drilling a
700m long soil
anomaly where
boulders grading 16.5
g/t Au, 11.5 g/t Au
and 7.9 g/t Au were
found.
• Notable drill intersects
include the following:
• 2.2 g/t Au over
11.85m, including
12.4 g/t Au over
1.15m
• 0.6 g/t Au over 12.3
m, including 5.3 g/t
Au over 0.5m that
contained VG
• 1.7 g/t Au over
2.1m, 1.5 g/t Au
over 1.0m, and 0.9
g/t Au over 2.1m, all
George Murphy Zone - in a 17.5m quartz
zone
New Discovery
24 TSX-V:GWMThe Corridor Connecting the South Zone to the North Zone has
2.8 Km of Strong Soil Anomalies That Have Never Been Drilled
• Average drill
depth shallow
at 97m.
• Potential for
additional
discoveries at
depth.
• Area open for
expansion
along the 2.8
km of soil
anomalies
that have not
been drilled.
25 TSX-V:GWM• Galway’s drilling
at Jubilee
expanded this
satellite zone by
72m to the
west.
• Follow-up
drilling a rich
soil anomaly to
the SE in 2018
may extend the
zone further.
• Plan to add
Jubilee drill
results to next
Clarence
Stream resource
update.
26 TSX-V:GWMCoffee Project – Acquired by Goldcorp for $520 million
Indicated: 3.0 mm oz at 1.45 g/t Au
Inferred: 2.2 mm oz at 1.31 g/t Au
27 TSX-V:GWMAppalachian Gold Trend
Galway’s Marathon’s
Clarence Stream Valentine Lake
Project Project
• Gold Mineralization in the Appalachians is
closely related to deep seated faults intimately
associated with major geological terrain Clarence Stream
boundaries
390,000 ounces M&I +
• The boundary between the Gander and Avalon
277,000 ounces Inf. With
terrains is favorable in Maritime Canada
excellent upside to increase
to 1M ounces Au plus
28 TSX-V:GWMEstrades – Properties Straddle 2 Breaks; 3 Horizons
5.3/1.2m+1.8/1.8m+0.8/4.5m+0.6/4.2m
1.1/10.6m
10.5/0.6m+1.0/4.5m 1.2/9.75m+2.0/0.6m+2.2/0.9m 2.3/4.5m
0.75/19.5m
0.6/18.5m
10.4/1.1m
1.95/10.4m 3.0/1.0m+2.3/3.0m
1.2/12.7m
3.4/0.9m+1.3/5.6m
3.8/3.7m 3.4/2.9m incl 10.4/0.8m
ESTRADES MINE
CARIBOU DEPOSIT NEWISKA HORIZON
NK-05
0.3/22.35m 10.4/1.0m
AS+PY(massive) 6.2/0.5m 8.2/3.2m
NK-04
1%CU/9.4m+42 g/t AG
29 TSX-V:GWMEstrades Plan View
4.2% ZN+ 1.1 AU/17.7 (INCL 9.7% ZN/4.6)
(HOLE 08)
N
PLANNED ACTUAL
4.9% ZN; 4.7 AU/1.8 (HOLE 27)
TARGET FAULT AT ZONE AT HOLE
08
FAULT AT
? SURFACE
FAULT AT ZONE AT HOLE
27
5.7 AU/2.7 (HOLE 27)
?
60
°
DIP 28.5%
27
ZN+ 2.2 AU/3.3
+18.6% ZN/2.7 (HOLE
27)
100M
30 TSX-V:GWMEstrades Long Section West
116
ACTUAL
PLANNED
TARGET
31 TSX-V:GWMEstrades Copper-Rich Vent-System Indicators
Copper-Rich Indicator Holes: Drill intersects that may lead Galway to new copper-rich discoveries
Hole H-182 – 2.0% Cu, 5.9% Zn, 118.2 g/t Ag, and 0.3 g/t Au over 5.1 m (true width (TW) = 3.7 m),
including 3.2% Cu, 3.1% Zn, 129.0 g/t Ag, and 0.3 g/t Au over 2.8 m (TW) = 2.0 m). Located 423 m from
surface on the west side of the resource
Hole 116 – 1.7% Cu, 1.5% Zn, 0.5 g/t Au, and 33.2 g/t Ag over 8.9 m (TW = 7.3 m), including 4.2% Cu,
Main Zone
2.1% Zn, 1.3 g/t Au, and 54.1 g/t Ag over 2.4 m (TW = 2.4 m). Located 226 m below the intersect in Hole
H-182
Hole H-281 – 1.0% Cu, 9.6% Zn, 0.85% Pb, 1.1 g/t Au, and 142.3 g/t Ag over 2.6 m (TW = 2.5 m). Located
105 m down plunge from Hole 116
Hole EME 07 – 0.84% Cu and 7.6 g/t Ag over 23.2 m (TW = 16.5 m), including 4.0% Cu and 50.0 g/t Ag
Central Zone over 0.5 m (TW = 0.4 m), and including 2.4% Cu over 6.5 m (TW = 4.6 m) (which includes 7.4% Cu and
51.2 g/t Ag over 0.6 m (TW = 0.4 m)
Hole 221 – 8.2% Cu, 4.1% Zn, 1.5 g/t Au, and 138.1g/t Ag over 2.4 m (TW = 1.9 m)
Hole 230 – 5.9% Cu, 9.4% Zn, 0.5% Pb, 2.8 g/t Au, and 164.5 g/t Ag over 3.3 m (TW = 2.7 m)
Hole EME 02 – 1.3% Cu over 3.85 m (TW = 3.0 m) (not in resource)
East Zone
Hole H 82 – 9.3% Cu, 2.7% Zn, and 101.1 g/t Ag over 0.9 m (TW = 0.6 m)
Hole H 293 – 0.9% Cu over 9.2 m (TW = 7.9 m), including 2.6% Cu over 1.0 m (TW = 0.9 m) (not in
resource)
Hole NK 04 – 1.1% Cu and 41.5 g/t Ag over 9.4 m, plus five other intersects above 0.8% Cu over 0.5 m to
1.6 m core lengths
Newiska (South of Estrades; Hole NK 05 – 0.34 g/t Au over 22.4 m. According to RPA (2006), “this interval also averaged 259 ppm As,
Similar Geologic Setting): which is a common feature in gold-rich VMS systems. This mineralized zone is therefore considered as an
indication of potential for a gold-rich massive sulphide deposit in the property.”
Note: TW for Newiska are unknown.
32 TSX-V:GWMGold Price Remains Strong in Cdn$; Zinc in Deficit
Gold Price in Canadian $ ~$1300-$1800 Since Committed Zinc Supply
2003 (December 13, 2017 @ $1,253) Insufficient for Demand
Forecast Zinc Refined Balance
500
THOUSANDS OF TONNES
-
(500)
(1,000)
(1,500)
(2,000)
(2,500)
We expect insufficient mine supply to constrain
refined production
• From 2014-2020, refined metal supply
increase of only 792 kt
• Over the same period, refined demand
increase of 2.8 Mt
Market was in deficit in 2014
Ongoing, large inventory that has funded the
deficit will continue in 2016
Metal market moving into significant deficit with
33
further mine closures and depleting inventories
LME warehouse levels at a 5-year low
Source: Teck
33 TSX-V:GWMYou can also read


