DISCUSSION PAPER SERIES - Sexual Orientation and Earnings. A Meta-Analysis 2012-2020
←
→
Page content transcription
If your browser does not render page correctly, please read the page content below

DISCUSSION PAPER SERIES

IZA DP No. 14496

Sexual Orientation and Earnings.
A Meta-Analysis 2012-2020

Nick Drydakis

JUNE 2021
DISCUSSION PAPER SERIES

IZA DP No. 14496

Sexual Orientation and Earnings.
A Meta-Analysis 2012-2020

Nick Drydakis
Anglia Ruskin University, University of Cambridge and IZA

JUNE 2021

Any opinions expressed in this paper are those of the author(s) and not those of IZA. Research published in this series may
include views on policy, but IZA takes no institutional policy positions. The IZA research network is committed to the IZA
Guiding Principles of Research Integrity.
The IZA Institute of Labor Economics is an independent economic research institute that conducts research in labor economics
and offers evidence-based policy advice on labor market issues. Supported by the Deutsche Post Foundation, IZA runs the
world’s largest network of economists, whose research aims to provide answers to the global labor market challenges of our
time. Our key objective is to build bridges between academic research, policymakers and society.
IZA Discussion Papers often represent preliminary work and are circulated to encourage discussion. Citation of such a paper
should account for its provisional character. A revised version may be available directly from the author.

                                                     ISSN: 2365-9793

                                           IZA – Institute of Labor Economics
Schaumburg-Lippe-Straße 5–9                      Phone: +49-228-3894-0
53113 Bonn, Germany                             Email: publications@iza.org                                    www.iza.org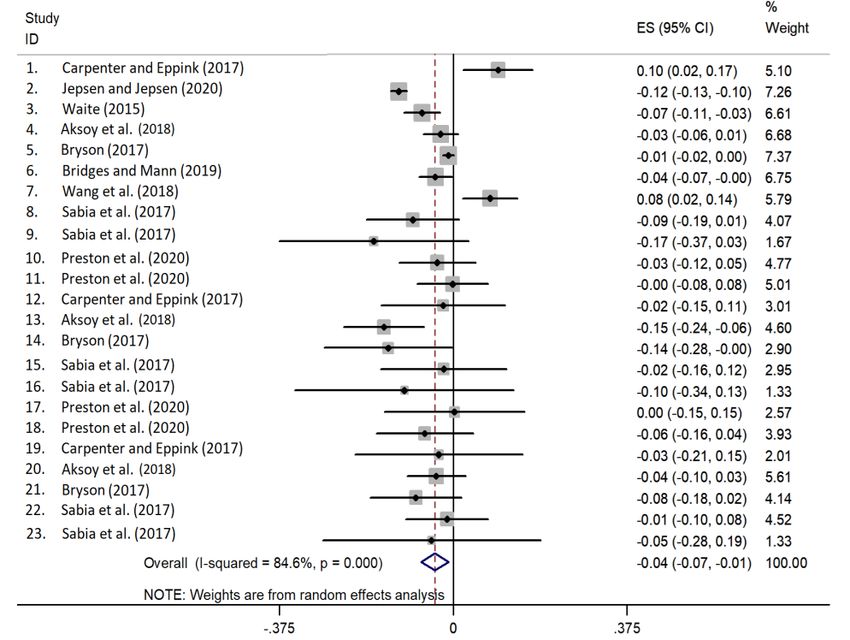
IZA DP No. 14496                                                                                         JUNE 2021

            ABSTRACT
            Sexual Orientation and Earnings.
            A Meta-Analysis 2012-2020
            This meta-analysis utilizes 24 papers published between 2012-2020 that focus on earnings
            differences by sexual orientation. The papers cover the period between 1991 and 2018,
            and countries in Europe, North America and Australia. The meta-analysis indicates that gay
            men earned less than heterosexual men. Lesbian women earned more than heterosexual
            women, while bisexual men earned less than heterosexual men. Bisexual women earned
            less than heterosexual women. According to the meta-analysis, in data sets after 2010,
            gay men and bisexual men and women continue to experience earnings penalties, while
            lesbian women continue to experience earnings premiums. The meta-regression estimates
            indicate relationships between study characteristics and the estimated earnings effects
            for sexual minorities. For instance, regions, sexual minority data set sizes, and earnings
            classifications influence the outcomes. The persistence of earnings penalties for gay men
            and bisexual men and women in the face of anti-discrimination policies represents a cause
            for concern and indicates the need for comprehensive legislation and workplace guidelines
            to guarantee that people receive fair pay and not experience any form of workplace
            inequality simply because of their sexual orientation.

            JEL Classification:        C93, E24, J15, J16, J71
            Keywords:                  sexual orientation, discrimination, earnings

            Corresponding author:
            Nick Drydakis
            Centre for Pluralist Economics
            Department of Economics and International Business
            Anglia Ruskin University
            East Road
            Cambridge, CB1 1PT
            United Kingdom
            E-mail: nick.drydakis@anglia.ac.uk
1. Introduction
         Since the seminal work of Badgett (1995), an increasing number of studies have examined
the earnings differences between sexual orientation majorities and minorities. Research has found
that between 1989 and 2014, gay men tended to experience earnings penalties of 9 percent
compared with heterosexual men (Drydakis, 2014). The earnings penalties varied from 16 percent
in the US to 4 percent in the Netherlands (Drydakis, 2014). Studies have also found that, on
average, lesbian women had higher incomes than comparable heterosexual women (Valfort, 2017).
According to estimates, lesbian women, during the period 1989 2014, earned on average 12 percent
more than comparable heterosexual women (Drydakis, 2014). The highest-earning premium was
estimated to be 20 percent in the US, while the lowest was 3 percent in the Netherlands. Only in
Australia and Greece did lesbian women receive lower earnings than comparable heterosexual
women, with figures of 28 percent and 8 percent, respectively (Drydakis, 2014). Numerous studies
have reached the same conclusion regarding ga men s earnings penalties and lesbian women s
earnings premiums (Valfort, 2017; K llen, 2016; Klawitter, 2015; O eren, 2014).
         Ga men s earnings penalties underwent evaluation through theories of distastes against
minorities (Becker, 1957) and/or uncertainties concerning minorities performance (Arrow, 1973).
The labor market penalties for ga men should bear a direct connection to the strength of firms
antipathy to minority populations (Drydakis, 2009; Charles and Guryan, 2008) and/or uncertainties
regarding minorit populations vocational behavior (Pager and Karafin, 2009). H potheses posit
that if gay men do not conform to traditional gender roles related to masculinity and leadership
perceived to boost emplo ees performance, such a situation might result in unfavorable evaluations
and earnings penalties (K llen, 2016). Studies have found that, for gay men, employment penalties
might stem from distastes and uncertainties regarding their credentials (Baert, 2018; Drydakis,
2012).
         Arguments focusing on lesbian women s earnings premiums in relation to masculine
characteristics, which stereotypically characterize lesbian women and demonstrate leadership, have
been utilized to evaluate their experiences (Drydakis, 2011; Clain and Leppel, 2001). Moreover,
indications suggest that if lesbian women invest more heavily in market-oriented human capital by
staying in school and choosing a major that leads to higher earnings and longer working hours, such
choices can influence their workplace outcomes (Jepsen, 2007; Elmslie and Tebaldi, 2007; Black et
al., 2003). Furthermore, a peripheral explanation for the lesbian earnings premium may revolve
around women with children earning less than women without children (Antecol and Steinberger,
2011; Waldfogel, 1998). Lesbian women might prove less likely to have children than married
women, so it makes sense that they may earn more because of their commitment to the labor market
(Baert, 2014; Waldfogel, 1998). Additionally, lesbian women might show more dedication to the
                                                  2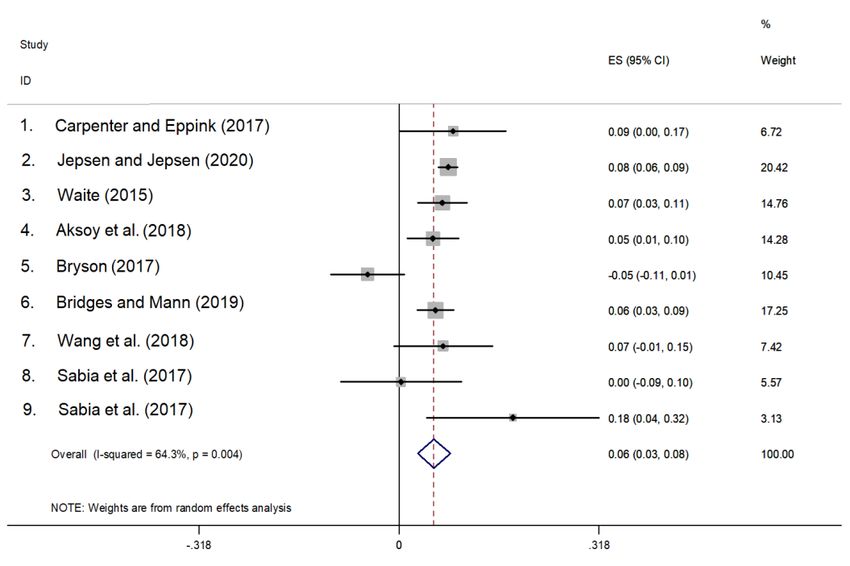
labor market because they are less unlikely to engage with a higher earning (male) partner who
would provide for them (Antecol and Steinberger, 2011). If this is the case, lesbian women might
invest more in a workplace career.
       The present study aims to offer a meta-analysis of earnings differences based on sexual
orientation. The study focuses on papers published between 2012 and 2020 and covers the period
spanning 1991 to 2018. Meta-analyses enable an evaluation of previous research s findings and
derive on a phenomenon (Klawitter, 2015; Stanley and Jarrell, 2005; Weichselbaumer and Winter-
Ebmer, 2005; Hunter and Schmidt, 1990). Klawitter (2015) offers a meta-analysis on sexual
orientation and earnings on papers published between 1995 and 2012. The present study contributes
to the literature by providing outcomes on earnings differences for four sexual minority population
groups, namely, gay men, lesbian women, bisexual men, and bisexual women. Klawitter (2015)
focuses on gay men and lesbian women. Additionally, the present study covers a wider period,
enabling a more thorough examination of whether the last decade, i.e., since 2010, saw a change in
earnings patterns based on sexual orientation. This element improves integral because studies from
the US, Britain, and Canada utilizing data sets after 2010 found that gay men can experience higher
or the same earnings as comparable heterosexual men (Wang, 2018; Carpenter and Eppink, 2017;
Bryson, 2017; Dilmaghani, 2018). Moreover, studies from Britain and Australia utilizing data sets
after 2010 found that lesbian women can experience lower or the same earnings as comparable
heterosexual women (Bryson, 2017; Sabia et al., 2017). The present study examines whether, since
2010, gay men and bisexual people have experienced lower earnings penalties, in addition to
determining whether lesbian women tend to experience smaller earnings premiums.
       Dr dakis and Zimmermann (2020) indicate that although an improvement in ga men s
earnings is welcomed, it may give erroneous signals in countries where socio-political changes still
do not favor gay men. Additionally, the assigned lower earnings for lesbian women require
attention. It remains puzzling to observe that lower earnings for lesbian women might have arisen in
a time of social progress and changing attitudes towards sexual orientation minorities (Drydakis and
Zimmermann, 2020). For lesbian women, the combined effect of sex and sexual orientation and its
impact on earnings introduces new challenges. Being a woman and a sexual orientation minority
can constitute double jeopardy (Drydakis and Zimmermann, 2020).
       The present meta-analysis indicates that between 1991 and 2018, gay men, bisexual men,
and bisexual women experienced earnings penalties. During that period, lesbian women
experienced earnings premiums. Additionally, the study finds that after 2010, gay men and bisexual
people continue to experience earnings penalties, while lesbian women continue to experience
earnings premiums. Controlling for key heterogeneity, such as region, sample size, earnings, and
sexual orientation classification, meta-regression estimates suggest that after 2010, gay men and
                                                  3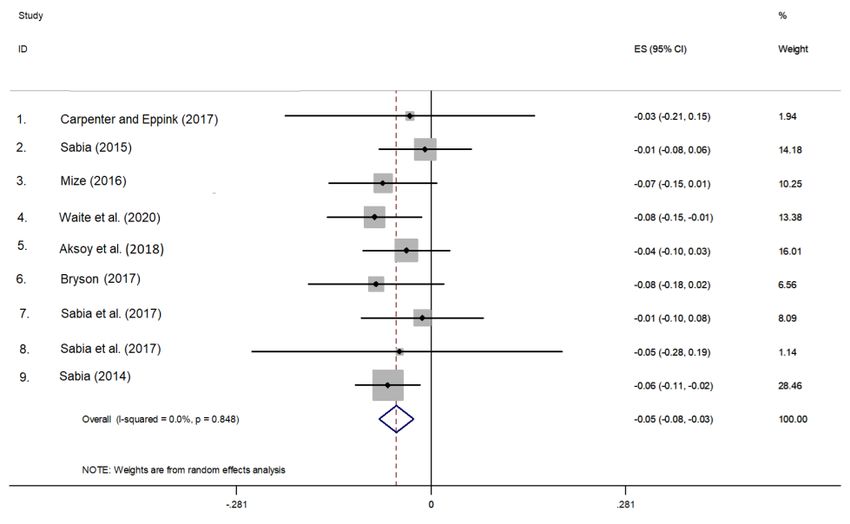
bisexual people face lower earnings penalties. However, the estimated patterns do not prove robust
across different empirical specifications. The study concludes by indicating that persistent earnings
penalties for gay men and bisexual people in the face of socio-political changes and anti-
discrimination policies represent a cause for concern.
       The remainder of the study is structured as follows. Section 2 presents the sample. Section 3
offers the descriptive statistics of the sample. Section 4 presents the empirical strategy. Section 5
presents the summary statistics for meta-regression samples. Section 6 offers the meta-analysis
outcomes. Section 7 provides a discussion. Section 8 presents the stud s limitations. Finall ,
Section 9 offers conclusions.

2. The sample
       This study adopts a systematic literature review approach (Ozeren, 2014) and applies a
multi-faceted framework comprising the planning, conducting, reporting, and dissemination of
relevant research (Tranfield et al., 2003). The present stud s search criteria follow that of Klawitter
(2015), which represents the first meta-analysis of sexual orientation and earnings, and covers 34
studies. The initial planning involved identifying the subject matter domain, namely, earnings
differences based on sexual orientation, and the primary data extraction source, Google Scholar.
Aligning with Ozeren (2014), in the conducting phase of the systematic review, the study (i)
identified keywords, (ii) defined selection criteria and papers to be extracted, (iii) evaluated
abstracts to determine the papers relevance, and downloaded the screened papers, and (iv)
evaluated the downloaded papers.
       English-language papers published between 2012 and 2020 were searched with the
following ke words: Se ual orientation; LGB; ga ; lesbian; bise ual; regression; earnings; wages;
income . The identified titles and abstracts underwent screening to assess whether the studies
presented multivariate analysis on earnings differences based on sexual orientation. Given the
eligible criteria, the focus remained on reported estimates for ga men s earnings versus
heterose ual men s earnings, lesbian women s earnings versus heterose ual women s earnings,
bise ual men s earnings versus heterose ual men s earnings, and bise ual women s earnings versus
heterose ual women s earnings. Studies merging se ual minorit groups and comparing them
against se ual majorities, such as ga and bise ual men s earnings versus heterose ual men s
earnings, did not form part of the research. Studies offering intersectional estimates, such as black
lesbian women s earnings versus white heterose ual s women earnings did not feature.
       The framework of Moher et al. (2009) is applied to present the searching process. A Google
Scholar search enabled the identification of 1,920 papers against the keywords. The titles and
abstracts underwent evaluation against the eligibility criteria, and 1,889 papers were excluded.
                                                    4
Thirty-one full papers were assessed against the eligibility criteria, with seven papers being
excluded. At the end of the process, the meta-analysis sample comprised 24 papers.
Estimates on full-sample sizes were preferred. However, papers reporting estimates per
period, per sector, and per earnings classification formed part of the sample. All estimates are
informed for basic demographic characteristics, such as age and education. In line with Klawitter
(2015), the present study includes estimates from regression models incorporating the largest
covariates. However, the study avoided including estimates from models incorporating interaction
effects. In all studies, earnings/wages/income estimates were reported and interpreted as percent
effects, the standard interpretation in log earnings ordinary least squares regressions. Hence, the
estimate on the coefficient of being a sexual orientation minority shows the gap in average log
earnings associated with being non-heterosexual, which potentially reflects negative or positive
discrimination (Badgett, 1995; Valfort, 2017; K llen, 2016) or other differences associated with
sexual orientation, such as family arrangements, number of children, and human capital decisions
(Antecol and Steinberger, 2011; Jepsen, 2007; Waldfogel, 1998).
3. Descriptive statistics
Table 1 offers summary statistics of the meta-analysis sample and includes 29 estimates for
gay men, 24 estimates for lesbian women, 13 estimates for bisexual men, and nine estimates for
bise ual women. The findings show that ga men s earnings were 7.4 percent lower than the
earnings of comparable heterose ual men. Lesbian women s incomes were 7.2 percent higher than
the earnings of comparable heterosexual women. Bisexual men faced earnings 9.3 percent lower
than those of comparable heterosexual men, while bisexual women experienced earnings 4.7
percent lower than heterosexual women.
[Table 1]
In terms of regions, 30 percent of the estimates were from the US, followed by 20 percent
from Canada, 16.6 percent from Australia, 13.3 percent from the UK, and the remainder from
European Union countries. Figures reveal that 36.6 percent of the estimates capture patterns after
2010. Moreover, in 40 percent of the cases, the earnings variable consisted of annual earnings, with
the remainder being hourly or weekly earnings. In half of the cases, questions on same-sex living
arrangements captured sexual orientations. The remainder used questions on sexual behavior or/and
self-identification. In 46.6 percent of the cases, the sexual minority sample size was higher than a
thousand observations. Heckman selection models were used in 30 percent of the cases. Meanwhile,
23.3 percent of the cases have controlled for health/mental health status. Table 1 provides
information on the stud s variables and variables coding.
5Table 2 offers summary statistics on earnings differences per explanatory variable. For
instance, earnings differences are offered per period, region, and sample size. The findings show
that, after 2010, gay men experienced earnings 3.4 percent lower than the earnings of heterosexual
men. However, before 2010, ga men s earnings were 9.9 percent lower than the earnings of
comparable heterosexual men. Moreover, gay men in the US earned 11.4 percent less than
heterose ual men. In all the other regions, ga men s earnings proved 5.9 percent lower than the
earnings of comparable heterosexual men. Klawitter (2015) also found that in more recent and non-
US data sets, gay men experienced lower earnings penalties. The remaining statistics in Table 2
undergo similar interpretations.
[Table 2]
4. Empirical framework
Meta-analyses enable the assessment of estimated coefficients from independent studies of
the same subject to determine overall patterns (Borenstein et al., 2009; Weichselbaumer and
Winter-Ebmer, 2005; Stanley and Jarrell, 2005; Jarrell and Stanley, 2004; Hunter and Schmidt,
1990). The present study follows the guidelines of Havr nek et al. (2020) on meta-analysis in
economics. The Appendix presents the checklist of Havr nek et al. (2020) and evaluates how the
stud attends to the authors guidelines in relation to modeling issues and reporting outcomes. The
present section offers insights.
The study provides a funnel plot analysis (Song et al., 2013) to assess publication bias
(Figure 1). Publication bias occurs when papers with statistically significant results prove more
likely to be published than studies with non-significant results (Dubben and Beck-Bornholdt, 2005).
Publication bias can lead to meta-analyses that incorporate incomplete empirical evidence and
generate summary results potentially biased towards favorable treatment effects (Song et al., 2013).
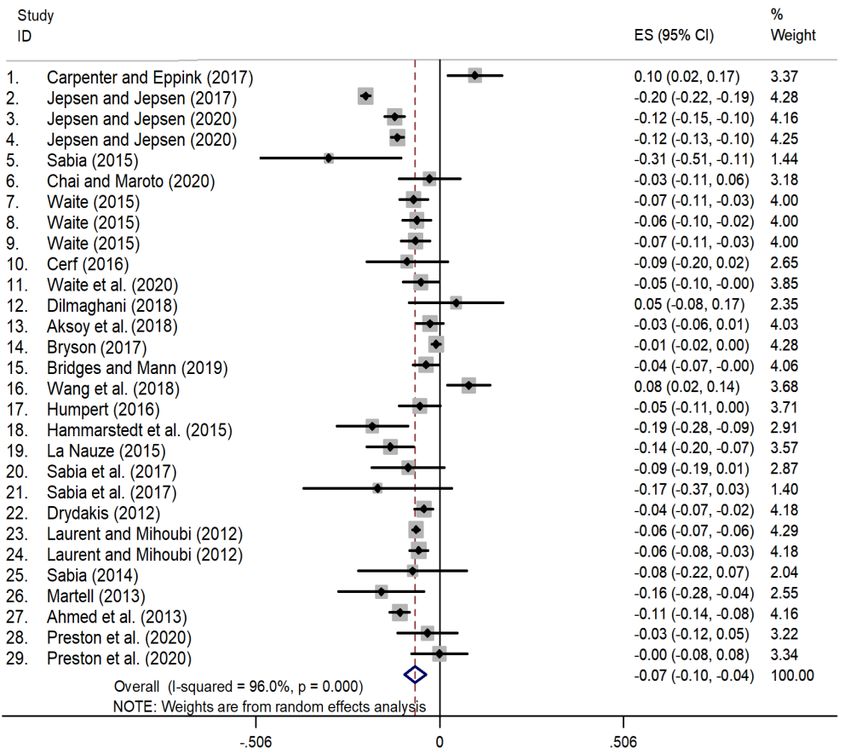
The study presents forest plot analyses (Schriger et al., 2010). Forest plots enable
observation of the earnings differences estimates per study and estimate the combined result derived
from pooling the individual estimates (Schriger et al., 2010, Cuzick, 2005). Random effects
specifications are provided when gauging the forest plots because the effect size is not the same for
every study (Flage, 2020; Klawitter, 2015). The consideration was confirmed by conducting x2
heterogeneity tests (Higgins and Thompson, 2002). Due to heterogeneity in the meta-analysis
sample, random effects proved preferable to fixed effects (Higgins and Thompson, 2002). Forest
plots are presented for gay men (Figure 2), lesbian women (Figure 3), bisexual men (Figure 4), and
bisexual women (Figure 5). Sub-sample forest plots assess the robustness of the outcomes. For
instance, the study assesses patterns in recent data sets, namely, after 2010 (Figures 6 and 7).
6Upon presenting the forest plots, meta-regression is offered. Forest plots focus on the value
of the effect of interest, namely, earnings differences for sexual minorities, while meta-regression
examines the explanatory variables that influence such an effect (Schriger et al., 2010; Borenstein et
al., 2009; Harbord and Higgins, 2008). Due to the observed heterogeneity in the meta-analysis
sample, it is recommended that random-effects meta-regression models be run (Borenstein et al.,
2009; Harbord and Higgins, 2008). Additionally, because a publication bias was not confirmed,
random-effects specifications prove more suitable than alternative empirical specifications such as
unrestricted least squares (Stanley and Doucouliagos, 2015).
The following equation illustrates the general meta-regression line:
Sexual Orientation percent diffs= b0 + bVs + s Equation 1
where Sexual Orientation percent diffs constitutes the estimate of the percentage difference in
earnings between sexual orientation minorities and majorities from each study; s and b0 is the
constant term. The explanatory factors, Vs, are the study characteristics, namely, period, region, and
earnings classifications. Each explanatory factor coefficient estimates the average effect on the
earnings differences for sexual minorities (Borenstein et al., 2009). Equation 1 calculates the
standard errors, s with Knapp-Hartung modification, limiting the rate of false positives (Klawitter,
2015; Harbord and Higgins, 2008; Knapp and Hartung, 2003). Simulations have shown that the
Knapp-Hartung modification performs better than other techniques, such as DerSimonian and Laird
(1986), especially when there is heterogeneity and the number of estimates in the meta-analysis
remains small (Sidik and Jondak, 2005).
Equation 1 is run separately for gay men (Table 3) and lesbian women (Table 4). A
sensitivity analysis provides four specifications. The initial model controls for the period, namely,
patterns after 2010. Klawitter (2015) has also offered patterns per decade (1990 Census and 2000
Census). Each subsequent model controls for additional covariates such as region and earnings
classification.
Due to limited observations, data is pooled for bisexual men and women, and Equation 1
controls for gender and estimates an interaction effect between gender and period (Table 5). For
meta-regression, each model should contain at least ten studies (Borenstein et al., 2009).
To examine the robustness of the outcomes, Equation 1 pools information for the four
sexual minority groups, and interaction effects are estimated between sexual orientation groups and
period (Table 6). Moreover, in order not to give more weight to studies offering numerous
specifications (i.e., estimates per period, per sector, and per earnings classification) Equation 1 is
estimated by including observations only from those studies utilizing full-sample estimates (Table
77). Furthermore, to determine the robustness of the outcomes the sample is restricted in sub-periods,
namely, before 2010 versus after 2010 (Table 8).
5. Meta-analysis outcomes: Earnings differences per sexual minority
5.1 Publication bias: Funnel plot
In Figure 1, a funnel plot analysis (Sterne and Egger, 2001) is reported for the total sample
of 75 estimates. The funnel plot displays the earnings differences estimates for gay men, lesbian
women, bisexual men, and bisexual women (x-axis), and the standard errors of the estimates (y-
axis). Each dot of the plot represents a separate estimate. The middle solid line indicates the overall
effect from the meta-analysis, and the two dotted lines on either side represent the pseudo 95
percent confidence intervals. The findings show that the estimates have scattered either side of the
overall effect line symmetrically. This situation indicates that publication bias may not be present
(Sterne and Egger, 2001). The latter is confirmed b conducting an Egger s test (p-value=0.743)
(Egger et al., 1997).
[Figure 1]
5.2 Meta-analysis: Forest plots
Figures 2 to 5 present four forest plots. In each figure, the left-hand column shows the
identities of the included studies. A box represents each point effect estimate. The horizontal line in
each box represents the 95 percent confidence interval of the result. Similarly, the right-hand
column indicates the measure of the estimate and the confidence interval. The meta-analyzed
earnings differences are represented on each figure with a dashed vertical line. The diamond at the
bottom of the forest plots shows the point estimate and confidence intervals by combining and
averaging all the individual estimates (Schriger et al., 2010; Cuzick, 2005).
In Figure 2, the meta-analyzed earnings differences indicate that ga men s earnings were
6.8 percent (p2015). New forest plots indicate qualitative patterns similar to those presented in Figures 2-5. Gay men s earnings were 5.2 percent (p
Table 5 presents the meta-regression estimates for bisexual men and women. Due to limited
observations, information is pooled for the two demographic groups. The regression controls for
gender and estimates an interaction effect between gender and data sets after 2010. In Model I,
results show that bisexual men experienced a higher earnings penalty than bisexual women by 6.5
percentage points (p
simultaneous periods before and after 2010. The findings show that gay men and bisexual men and
women faced earnings penalties. All models found that period does not moderate gay men, bisexual
men, and bise ual women s earnings penalties.
                                                   [Table 8]
       According to the meta-regression outcomes, estimates indicated that after 2010, gay men
and bisexual men and women experienced lower earning penalties than before 2010. However,
these patterns did not prove robust. Offering a variety of empirical specifications did not always
verify that in more recent data sets, gay men and bisexual men and women were better off in terms
of a reduction in earnings penalties. Additionally, the outcomes indicated that the period did not
moderate lesbian women s earnings premiums. Furthermore, the estimates indicated relationships
between study characteristics (i.e., exploratory variables) and the estimated earnings effects for
sexual minorities. For instance, regions, sexual minority data set sizes, and earnings classifications
influenced the outcomes. However, because these patterns did not appear in each empirical
specification, they should not be treated as robust patterns.

6. Discussion
       The present meta-analysis utilized 24 papers published between 2012 and 2020. The studies
covered the period between 1991 and 2018. Forest plots indicated that gay men earned less than
heterosexual men. Lesbian women earned higher incomes than heterosexual women. Bisexual men
earned less than heterosexual men. Bisexual women earned less than heterosexual women. Forest
plots suggested that after 2010, gay men and bisexual people continued to experience earnings
penalties, while lesbian women continued to experience earnings premiums.
       Meta-regression results indicated the existence of reduced earnings penalties for gay men
after 2010. The findings also estimated a reduction in earnings penalties for bisexual men and
women. However, the period patterns for gay men and bisexual people were not robust in different
empirical specifications. Thus, prompt conclusions cannot be offered. A reduction in earnings
premiums for lesbian women was not found. Furthermore, the study found connections between
study characteristics and the estimated effects for sexual minorities. Klawitter (2015) found relevant
patterns.
       Recent studies attempted to determine the reasons for reduced earnings penalties for gay
men and bise ual people. Carpenter and Eppink (2017) and Br son (2017) indicate that ga men s
stronger earnings records potentially stem from the rapid improvement in attitudes towards sexual
orientation minorities over the past decade. These changes couple with updated public policies
toward se ual minorities, such as same se marriage legali ation and the increasing prevalence of
non discriminator policies in emplo ment. Akso et al. (2018) indicate that an effective earnings
                                                   11
response to legislative and attitude changes for sexual minorities proves more positive than what
tends to be observed for the gender pay gap and ethnicity.
According to Drydakis and Zimmermann (2020), although a potential improvement in gay
men and bise ual people s earnings is welcomed, arguments ma give erroneous signals in
countries where socio-political changes have not yet favored sexual minorities. According to Waite
(2015), little evidence e ists in Canada that ga men s earnings penalties have attenuated since
2001. In the US, Jepsen and Jepsen (2020) found that the earnings penalties for gay men narrowed
between 2001 and 2008. After that, the penalties remained comparatively flat at a figure of
approximately 11 percent. Moreover, Burn (2020) found that, in the US, a single standard deviation
increase in the share of individuals in a state prejudiced against homosexuals correlated with a
decrease in the hourly earnings of gay men by between 2.7 percent and 4 percent. In the UK, Aksoy
at el. (2019) indicated that gay men faced glass ceilings. Recent review studies show that despite the
passage of labor legislation against discrimination in the labor market, people who have a minority
sexual orientation encounter more obstacles finding a job, lower job satisfaction, and more bullying
and harassment than their heterosexual counterparts (Drydakis and Zimmermann, 2020; Drydakis,
2015).
Recent studies indicate that sexual minorities experience economic insecurity. In the US,
Schneebaum and Badgett (2019) found that gay male couples were one percentage point more
likely to experience poverty than heterosexual married couples. Furthermore, lesbian women were
2.4 percentage points more likely to experience poverty than heterosexual married couples.
Schneebaum and Badgett (2019) highlighted that prejudice against sexual minorities among
administrative agency staff and social workers can generate barriers to accessing benefits for low-
earning sexual minorities. In the same region, Badgett (2018) found that bisexual men were 5.3
percentage points more likely to experience poverty than heterosexual men and that bisexual
women were 5.4 percentage points more likely to be poor than heterosexual women. Moreover, in
the UK, Uhrig (2015) indicated that gay and bisexual men experienced greater material
disadvantage than heterosexual men. Additionally, women experienced more pronounced material
disadvantages than heterosexual women.
Based on the Taste theory (Becker, 1957), negative attitudes toward gay and bisexual people
constitute the source of labor market prejudices, meaning policymakers should adopt anti-
discrimination legislation (Badgett, 2020; Valfort, 2017; K llen, 2016; Klawitter, 2015; O eren,
2014). Such policies raise the cost of discrimination by setting fines against homophobic
organizations. Thus, at the margin, this approach could discourage such organizations from
practicing unequal treatments and might raise the sexual minorities-majorities wage ratio (Schwab,
2000; Becker, 1957). The statistical theory of discrimination (Phelps, 1972; Arrow, 1973) indicates
12that biases could exist if organizations use sexual orientation to infer job-related characteristics,
productivity, and commitment (Arrow, 1973). The statistical theory of discrimination suggests that
unequal treatments can lessen if organizations receive reliable information about employees. Thus,
organizations should dedicate more resources to ascertaining emplo ees credentials (Schwab,
2000).
Developing inclusive recruitment policies should prove beneficial for employers. In the US,
Delhommer (2020) found that anti-discrimination laws can reduce by 11 percent the hourly
earnings penalty for gay men relative to heterosexual men. In Britain, Wang et al. (2018) found that
working in an organization with a diversity and equity management policy had positively affected
the earnings of gay men. Hossain et al. (2020) found that US anti-discriminatory laws prohibiting
discrimination in the workplace based on sexual orientation could spur innovation, resulting in
improved firm performance. The authors indicated that organizations with workplace diversity
policies often demonstrated higher innovation and performed better than those without such
policies. In the same region, Patel and Feng (2020) found positive relationships between LGBT
workplace equality, firm performance, and marketing capability. Shan et al. (2016) found that US
organizations with a higher degree of corporate sexual equality experienced higher stock returns
and market valuations. Similarly, Johnson and Cooper (2015) found that acceptance of secluded
employees can result in higher productivity and employee retention.
Studies evaluated that firms with formal written statements barring biases based on sexual
orientation and gender identity, inclusive HR practices in relation to recruiting and retaining LGBT
people, and a framework to provide trans-inclusive health-oriented benefits could prompt positive
outcomes concerning LGBT emplo ees mental health, interaction with colleagues, and job
satisfaction (Drydakis, 2020; 2017; Webster et al., 2018). Moreover, Badgett et al. (2020) estimated
that LGBT inclusion and Gross Domestic Product per capita mutually reinforce one another. The
exclusion of LGBT people can harm the economy, while legal rights for LGBT people can improve
economic development (Badgett et al., 2020).
The outcomes of the presented studies indicate that positive workplace practices can reduce
biases against LGBT people and foster positive payoffs in the labor market (Patel and Feng, 2020;
Badgett et al., 2020; Webster et al., 2018; Wang et al., 2018; Johnson and Cooper, 2015).
Policymakers should enact policies to counteract employment discrimination against the LGBT
workforce. Comprehensive legislation and workplace guidelines should guarantee that people
receive the same pay and not experience any form of workplace bias simply because of their sexual
orientation or/and gender identity status. Inclusive or positive actions or/and affirmative policies
ensure fair and equal treatment of LGBT employees in workplaces. Policies should embrace
diversity by encouraging under-represented groups to apply for jobs or promotions and providing
13support to LGBT employees to raise concerns and receive fair treatment. Standing against
discrimination and celebrating and supporting LGBT diversity should form a part of HR policies
(Bozani et al., 2020).
Eliminating earnings penalties based on sexual orientation requires not only a fundamental
change in attitudes and behaviors but also effective workplace policies and procedures (Badgett,
2020). This situation implies a critical role for constructive and informed social dialogue between
policymakers, unions, employees, and employers in improving the workplace experiences of sexual
minorities (Drydakis and Zimmermann, 2020). The social dialogue should form an integral part of
changing attitudes and establishing more inclusive workplaces, as it creates the opportunity to raise
issues and determine solutions. A cooperative social dialogue can also provide opportunities to
develop HR policies to confront and minimize earnings penalties based on sexual orientation.
7. Limitations and future research
Havr nek et al. (2020) evaluated that not all meta-analyses in economics align with the
proposed meta-analysis protocol. The present study did not control for either industry, such as
white-collar or blue-collar jobs, or the public and private sectors. Although many utilized studies
controlled for job characteristics, industry and sector classification was not possible. Either
information was unavailable, or there was significant heterogeneity among the studies on how they
had classified industries and sectors. Such an occurrence did not allow for any meaningful
grouping. Similar arguments hold for not controlling for personal or household earnings, household
arrangements, number of children, cohabiting or marital status and full-time employment. Although
the present study included hourly, weekly, and annual earnings, the sample did not include other
earnings classifications. Additionally, given the research questions, the present study did not utilize
estimates on intersectionalit , such as black ga men s earnings against white heterose ual men s
earnings (del Rio and Alonso-Villar, 2019; Douglas and Steinberger, 2015). Furthermore, this study
did not consider estimates on pooled se ual orientation groups, such as lesbian women s earnings
versus heterose ual men s earnings (Preston et al., 2019).
In the present meta-analysis, the sample comprised studies utilizing either time-series or
cross-sectional data. Due to limited observations and collinearity issues, the study featured no
control for data types. Similar arguments hold for not controlling for decomposition approaches.
Furthermore, the data extraction period featured only one working paper out of the 24 studies
(Jepsen and Jepsen, 2020). This study introduced a dummy variable to control for journal articles
against working papers. This action introduced collinearity problems. According to Klawitter
(2015), excluding working papers might introduce biases. Similarly, in the present study,
observations were based on sub-sample estimates (Laurent and Mihoubi, 2012; Jepsen and Jepsen,
142020; Preston et al., 2020; Waite, 2015). The introduction of a dummy variable to control for full-
sample estimates against sub-sample estimates introduced collinearity problems.
The present meta-analysis focused on 24 studies published between 2012 and 2020. The
sample did not reutilize the studies formed by Klawitter's (2015) meta-analysis. Klawitter (2015)
has focused on papers published up to 2012. The present study focused on papers published
between 2012-2020. Thus, by default, studies conducted prior to 2012, and the corresponding time
period patterns within these studies, were not included in the meta-analysis sample. Given the fact
that the present sample covered a 27-year period (between 1991 and 2018) and incorporated studies
that utilized sub-samples of the data sets in Klawitter (2015), any bias arising from not reutilizing
Klawitter s (2015) sample might not change the direction of the relationships. In Klawitter (2015),
as well as in the present study, the main patterns indicate that (i) gay men received lower earnings
than heterosexual men, and (ii) lesbian women faced higher earnings than heterosexual women. In
addition, in both Klawitter (2015) and in the present study, it seems that in more recent data sets,
gay men experienced lower earning penalties. For instance, in Klawitter (2015) it is observed that
the earnings penalties for gay men in 2000 are smaller by about 4 and 7 percentage points than for
studies in 1990.
he present study, followed Klawitter (2015), where the author controlled for the period
before 1990, between 1990 and 2000, and after 2000. he present study, followed a relevant
approach and offered an evaluation before and after 2010. In the present study, it was decided to
control for the period after 2010. In the present paper, the data extraction took place in 2020, and
there was an interest to consider whether in the last decade a change was realized. One might
replicate the process and choose a broader or a shorter period. In the present research, it was
attempted to include additional time dummies, i.e., to control for 1995-2000, 2000-2005, 2005-
2010, 2010-2015, and 2015-2020. However, because there were few observations, there is
overfitting, and the estimates become blurred.
Furthermore, the limited number of studies utilized in the present meta-analysis means that
the magnitude of the estimates might not be representative. In terms of firm evaluation, a meta-
analysis of meta-analyses is required (Sigman, 2011). However, such a study requires published
meta-analyses of the subject matter. This situation is not currently the case, especially for bisexual
people. New studies employing current data sets shall examine whether, within the last decade,
statistically significant reductions in earnings penalties for gay men and bisexual people have
occurred. Additionally, the studies will evaluate contemporary earnings differences based on sexual
orientation. There is also a requirement for representative longitudinal data on sexual orientation to
facilitate an assessment of whether anti-discrimination legislation and positive social and workplace
actions reduce societal and employment bias. This research indicated that studies with more than a
15thousand observations for sexual minorities estimated higher earnings penalties for bisexual people.
The number of observations in a data set mediating the patterns represents an additional indicator to
advocate for more representative data sets.
The present study found that in the US, studies estimated higher penalties for gay men.
Further research would identify which factors might boost earnings penalties in certain regions, as
well as which factors might reduce earnings differences. Additionally, the way studies capture
income (via annual earnings or hourly or/and weekly earnings) potentially matters. Studies should
provide robustness tests and report estimates on at least annual earnings and hourly earnings to
arrive at firm conclusions. Furthermore, the present study found that studies incorporating
information on health/mental health status estimated lower penalties for bisexual people. Such
information might capture critical unobserved heterogeneity. Thus, new data sets should collect
information on health indicators and offer a sensitivity analysis.
8. Conclusions
The present meta-analysis utilized 24 papers, published between 2012 and 2020, examining
earning differences based on sexual orientation minorities. The data sets covered between 1991 and
2018. The outcomes indicated that gay men, bisexual men, and bisexual women experienced lower
earnings than comparable heterose ual people. On the other hand, lesbian women s earnings were
higher compared to the earnings of heterosexual women. The study found that after 2010, gay men
and bisexual men and women continue to experience earnings penalties, while lesbian women
continue to experience earnings premiums. The outcomes indicated that after 2010, a reduction in
earnings penalties for gay men and bisexual people might be present. However, the pattern should
not represent a robust outcome because it was not proven in alternative empirical specifications.
The study concludes by indicating that the persistence of earnings penalties for gay men and
bisexual men and women in the face of anti-discrimination policies represents a cause for concern.
16References
Ahmed, A. Andersson, L. and Hammarstedt, M. (2013). Sexual Orientation and Full-Time Monthly
Earnings, by Public and Private Sector: Evidence from Swedish Register Data. Review of the
Economics of the Household, 11(September): 83 108.
Aksoy, C. G. Carpenter, C. S. and Frank. J. (2018). Sexual Orientation and Earnings: New
Evidence from the United Kingdom. Industrial and Labor Relations Review, 71(1): 242-
272.
Aksoy, C. G. Carpenter, C. S., Frank. J. and Huffman, M. L. (2019). Gay Glass Ceilings: Sexual
Orientation and Workplace Authority in the UK. Journal of Economic Behavior and
Organization, 159(March): 167-180.
Antecol, H. and Steinberger, M. D. (2011). Labour Supply Differences between Married
Heterosexual Women and Partnered Lesbians: A Semi-Parametric Decomposition
Approach. Economic Inquiry, 51(1): 783-805.
Arrow, K. J. (1973). The Theory of Discrimination, in Orley, A. and Albert, R. (Eds)
Discrimination in Labor Markets (pp. 3 33). New Jersey: Princeton University Press.
Badgett, M. V. L. (1995). The Wage Effects of Sexual Orientation Discrimination. Industrial and
Labor Relations Review, 48(4): 726-739.
Badgett, M. V. L. (2018). Left Out? Lesbian, Gay, and Bisexual Poverty in the U.S.. Population
Research Policy Review, 37: 667 702.
Badgett, M. V. L. (2020). The Economic Case for LGBT Equality. Why Fair and Equal Treatment
Benefits Us All. Boston, MA.: Beacon Press.
Baert, S. (2014). Career Lesbians. Getting Hired for Not Having Kids? Industrial Relations
Journal, 45, 543-561.
Baert, S. (2018). Hiring A Gay Man, Taking A Risk? A Lab Experiment on Employment
Discrimination and Risk-Aversion. Journal of Homosexuality, 65(8): 1015-1031.
Becker, G. S. (1957). The Economics of Discrimination. Chicago: University of Chicago Press.
Black, D. A. Makar, H. R. Sanders,S. G. and Taylor, L. J. (2003). The Earnings Effects of Sexual
Orientation. Industrial and Labor Relations Review, 56(3): 449 469.
Borenstein, M. Hedges, V. L. Higgins, P. T. J. and Rothstein, R. H. (2009). Introduction to Meta-
Analysis. Chichester: John Wiley and Sons.
Bozani, V. Drydakis, N. Sidiropoulou, K. Harvey, B. and Paraskevopoulou, A. (2020). Workplace
Positive Actions, Trans People s Self-Esteem and Human Resources Evaluations.
International Journal of Manpower, 41(6): 809-831.
Bridges, S. and Mann, S. (2019). Sexual Orientation, Legal Partnerships and Wages in Britain.
Work, Employment and Society, 33(6): 1020 1038.
Bryson, A. (2017). Pay Equity After the Equality Act 2010: Does Sexual Orientation Still Matter?
Work, Employment and Society, 31(3): 483 500.
Burn, I. (2020). The Relationship Between Prejudice and Wage Penalties for Gay men in the US.
Industrial and Labour Relations Review, 73(3): 650 675.
Carpenter, C. S. and Eppink, S. T. (2017). Does It Get Better? Recent Estimates of Sexual
Orientation and Earnings in the United States. Southern Economic Journal, 84(2): 426-441.
Cerf, B. (2016). Sexual Orientation, Earnings, and Stress at Work. Industrial Relations, 55(4): 546-
575.
Chai, L. and Maroto, M. (2020). Economic Insecurity among Gay and Bisexual Men: Evidence
from the 1991 2016 U.S. General Social Survey. Sociological Perspectives, 63(1): 50 68.
Charles, K. K. and Gur an, J. (2008). Prejudice and Wages: An Empirical Assessment of Becker s
the Economics of Discrimination. Journal of Political Economy, 116(5): 773-809.
Clain, S. H. and Leppel, K. (2001). An Investigation into Sexual Orientation Discrimination as an
Explanation for Wage Differences. Applied Economics, 33(1): 37 47.
Cuzick, J. (2005). Forest Plots and the Interpretation of Subgroups. The Lancet, 365, 1308.
Dilmaghani, M. (2018). Sexual Orientation, Labour Earnings, and Household Earnings in Canada.
Journal of Labor Research, 39: 41 55.
17Delhommer, S. (2020). Effect of State and Local Sexual Orientation Anti-Discrimination Laws on
Labor Market Differentials. Social Science Research Network SSRN: June 16, 2020.
DerSimonian, R. and Laird, N. (1986). Meta-Analysis in Clinical Trials. Controlled Clinical Trials,
7(3): 177-188.
Dubben, H. H. and Beck-Bornholdt, H. P. (2005). Systematic Review of Publication Bias in Studies
on Publication Bias. British Medical Journal, 331: 433.
Drydakis, N. (2009). Sexual Orientation Discrimination in the Labour Market. Labour Economics,
16(4): 364-372.
Drydakis, N. (2011). Women s Se ual Orientation and Labor Market Outcomes in Greece.
Feminist Economics, 11(1):89-117.
Drydakis, N. (2012). Sexual Orientation and Labour Relations New Evidence from Athens, Greece.
Applied Economics, 44(20):2653-2665.
Drydakis, N. (2014). Sexual Orientation and Labor Market Outcomes. IZA World of Labor,
111(v1): 1-10.
Drydakis, N. (2015). Effect of Sexual Orientation on Job Satisfaction: Evidence from Greece.
Industrial Relations: A Journal of Economy and Society, 54(1): 162-187.
Drydakis, N. (2017). Trans People, Well-Being, and Labor Market Outcomes. IZA World of Labor,
368: 1-9.
Drydakis Nick (2020). Trans People, Transitioning, Mental Health, Life and Job Satisfaction, in: K.
F. Zimmermann (Ed.), Handbook of Labor, Human Recourses and Population Economics:
Gender (pp. 1-22). New York: Springer.
Drydakis, N. and Zimmermann, K. F. (2020). Sexual Orientation, Gender Identity and Labour
Market Outcomes: New Patterns and Insights. International Journal of Manpower, 41(6):
621-628.
Egger, M. Smith G. D. Schneider, M. and Minder, C. (1997). Bias in Meta-Analysis Detected by a
Simple, Graphical Test. British Medical Journal, 315: 629-634.
Elmslie, B. and Tebaldi, E. (2007). Sexual Orientation and Labor Market Discrimination. Journal of
Labor Research, 28(3): 436 453.
Flage, A. (2020). Discrimination Against Gays and Lesbians in Hiring Decisions: A Meta-Analysis.
International Journal of Manpower, 41(6): 671-691.
Hardord, R. M. and Higgins, P. T. J. (2008). Meta-regression in Stata. The Stata Journal, 8(4): 493-
519.
Havranek, T. Stanley, T. D. Doucouliagos, H. Bom, P. Geyer-Klingeberg, J. Iwasaki, I. Reed, R.
W. and Rost, K. (2020). Reporting Guidelines for Meta-Analysis in Economics. Journal of
Economic Surveys, 34(3): 469 475.
Hammarstedt, M. Ahmed, A. M. and Andersson, L. (2015). Sexual Prejudice and Labor Market
Outcomes for Gays and Lesbians: Evidence from Sweden. Feminist Economics, 21(1): 90-
109.
Higgins, J. P. T. and Thompson, S. G. (2002). Quantifying Heterogeneity in A Meta-Analysis.
Statistics in Medicine, 21(11): 1539-1558.
Hossain, M. Atif, M. Ahmed, A, and Mia, L. (2020). Do LGBT Workplace Diversity Policies
Create Value for Firms? Journal of Business Ethics, 167: 775 791.
Humpert, S. (2016). Somewhere Over the Rainbow: Sexual Orientation and Earnings in Germany.
International Journal of Manpower, 37(1): 69-98.
Hunter, J. E. and Schmidt, F. L. (1990). Methods of Meta-Analysis: Correcting Error and Bias in
Research Findings. Thousand Oaks, CA: Sage Publications Inc.
Jepsen, L. K. (2007). Comparing the Earnings of Cohabiting Lesbians, Cohabiting Heterosexual
Women, and Married Women: Evidence from the 2000 Census. Industrial Relations: A
Journal of Economy and Society, 46(4): 699 727.
Jepsen, C. and Jepsen, L. (2017). Self-Employment, Earnings, and Sexual Orientation. Review of
the Economics of the Household, 15(October): 287 305.
18Jepsen, C. and Jepsen, L. (2020). Convergence Over Time or Not? U.S. Wages by Sexual
Orientation, 2001-2018. Institute for Labor Economics IZA Discussion Paper No. 13495.
Bonn: Institute for Labor Economics IZA.
Johnson, I. and Cooper, D. (2015). LGBT Diversity: Show me the Business Case. Utrecht: Out
Now.
Klawitter, M. (2015). Meta-Analysis of the Effects of Sexual Orientation on Earnings. Industrial
Relations: A Journal of Economy and Society, 54(1): 4 32.
Knapp, G. and J. Hartung. (2003). Improved Tests for a Random-Effects Meta-regression with a
Single Covariate. Statistics in Medicine, 22(17): 2693 2710.
K llen, T. (2016). Sexual Orientation and Transgender Issues in Organizations: Global
Perspectives on LGBT Workforce Diversity. Switzerland: Springer.
La Nauze, A. (2015). Sexual Orientation Based Wage Gaps in Australia: The Potential Role of
Discrimination and Personality. The Economic and Labour Relations Review, 26(1): 60-81.
Laurent, T. and Mihoubi, F. (2012). Sexual Orientation and Wage Discrimination in France: The
Hidden Side of the Rainbow. Journal of Labor Research, 33(December): 487 527.
Martell, M. E. (2013). Differences Do Not Matter: Exploring the Wage Gap for Same-Sex
Behaving Men. Eastern Economic Journal, 39(1): 45-71.
Mize, D. T. (2016). Sexual Orientation in the Labor Market. American Sociological Review, 81(6):
1132-1160.
Moher, D. Liberati, A. Tetzlaff, J. Altman, D. G. and the PRISMA Group (2009). Preferred
Reporting Items for Systematic Reviews and Meta-Analyses: The PRISMA Statement.
Annals of Internal Medicine, 151(4): 264 269.
Ozeren, E. (2014). Sexual Orientation Discrimination in the Workplace: A Systematic Review of
Literature. Procedia-Social and Behavioral Sciences, 109(8): 1203-1215.
Pager, D. D. and Karafin, D. (2009). Bayesian Bigot? Statistical Discrimination, Stereotypes, and
Employer Decision Making. ANNALS of the American Academy of Political and Social
Science, 621(1): 70-93.
Phelps, E. (1972). The Statistical Theory of Racism and Sexism. American Economic Review,
62(4): 659-661.
Patel, P. C. and Feng, C. (2020-on line first). LGBT Workplace Equality Policy and Customer
Satisfaction: The Roles of Marketing Capability and Demand Instability. Journal of Public
Policy and Marketing.
Preston, A. Birch, E. and Timming, A. R. (2019). Sexual Orientation and Wage Discrimination:
Evidence from Australia. International Journal of Manpower, 41(6): 629-648.
Sabia, J. S. (2014). Sexual Orientation and Wages in Young Adulthood: New Evidence from Add
Health. Industrial and Labor Relations Review, 67(1): 239-267.
Sabia, J. J. (2015). Fluidity in Sexual Identity, Unmeasured Heterogeneity, and the Earnings Effects
of Sexual Orientation. Industrial Relations, 54(1): 33-58.
Sabia, J. J. Wooden, M. and Ngu en, T. T. (2017). Se ual Identit , Same Se Relationships, and
Labour Market Dynamics: New Evidence from Longitudinal Data in Australia. Southern
Economic Journal, 83(4): 903-931.
Schriger, D. L. Altman, D. G. Vetter, J. A. Heafner, T. and Moher, D. (2010). Forest Plots in
Reports of Systematic Reviews: A Cross-Sectional Study Reviewing Current Practice.
International Journal of Epidemiology, 39(2): 421 429.
Schneebaum, A. and Badgett, M. V. L. (2019). Poverty in US Lesbian and Gay Couple Households.
Feminist Economics, 25(1): 1-30.
Schwab. S. J. (2000). Employment Discrimination. Encyclopedia of Law and Economics, 3(5530):
572-595.
Shan, L. Fu, S. and Zheng, L. (2016). Corporate Sexual Equality and Firm Performance. Strategic
Management Journal, 38(9): 1812-1826.
Sidik. K. and Jonkman, J. N. (2005). Simple Heterogeneity Variance Estimation for Meta-Analysis.
Journal of the Royal Statistical Society, 54(2): 367-384.
19Sidiropoulou, K. Drydakis, N. Harvey, B. and Paraskevopoulou, A. (2020). Family Support,
School-Age and Workplace Bullying for LGB People. International Journal of Manpower,
41(6): 717-730.
Sigman, M. (2011). A Meta-Analysis of Meta-Analyses. Fertility and Sterility, 96(1): 11-14.
Song, F. Hooper, L. and Loke, Y. (2013). Publication Bias: What Is It? How Do We Measure It?
How Do We Avoid It? Open Access Journal of Clinical, 5: 71 81.
Stanley, T. D. and Jarrell. S. B. (2005). Meta-Regression Analysis: A Quantitative Method of
Literature Surveys. Journal of Economic Surveys, 19(3): 299-308.
Stephen, J. B., and Stanley. T. D. (2004). Declining Bias and Gender Wage Discrimination? A
Meta-Regression Analysis. The Journal of Human Resources, 39(3): 828 838.
Stanley, T. D. and Doucouliagos, H. (2015). Neither Fixed nor Random: Weighted Least Squares
Meta-Analysis. Statistics in Medicine, 34(13): 2116-2127.
Sterne, J. A. C. and Egger, M. (2001b). Funnel Plots for Detecting Bias in Meta-Analysis:
Guidelines on Choice of Axis. Journal of Clinical Epidemiology, 54: 1046-1055.
Tranfield, D. Denyer, D. and Smart, P. (2003). Towards a Methodology for Developing Evidence-
Informed Management Knowledge by Means of Systematic Review. British Journal of
Management, 14(3): 207-222.
Uhrig, N. S. C. (2015). Sexual Orientation and Poverty in the UK: A Review and Top-Line
Findings from the UK Household Longitudinal Study. Journal of Research in Gender
Studies, 50(1): 23-72.
Valfort, M. A. (2017). LGBTI in OECD Countries: A Review. OECD Social, Employment and
Migration Working Paper no.198. Paris: OECD.
Waite, S. (2015). Does it Get Better? A Quasi-Cohort Analysis of Sexual Minority Wage Gaps.
Social Science Research, 54(November): 113-130.
Waite, S. Pajovic, V. and Denier, N. (2020). Lesbian, Gay and Bisexual Earnings in the Canadian
Labor Market: New Evidence from the Canadian Community Health Survey. Research in
Social Stratification and Mobility, 67(June): 100484.
Waldfogel, J. (1998). Understanding the Famil Gap in Pa for Women with Children. Journal of
Economic Perspectives, 12(1): 137 156.
Wang, J. Gunderson, M. and Wicks, D. (2018). The Earnings Effect of Sexual Orientation: British
Evidence from Worker-Firm Matched Data. British Journal of Industrial Relations, 56(4):
744 769.
Webster, J. R., Adams, G. A., Maranto, C. L., Sawyer, K. Thoroughgood, C. (2018). Workplace
Contextual Supports for LGBT Employees: A Review, Meta-Analysis, and Agenda for
Future Research. Human Resource Management, 57(1), 193-210.
Weichselbaumer, D. and Winter-Ebmer, R. (2005). A Meta-Analysis of the International Gender
Wage Gap. Journal of Economic Surveys, 19(3): 479 511.
20Table 1. Summary statistics for meta-analysis sample
Variables Means (standard deviations)
Earnings differences estimates for gay mena -0.074 (0.083)
Earnings differences estimates for lesbian womenb 0.072 (0.059)
Earnings differences estimates for bisexual menc -0.093 (0.059)
Earnings differences estimates for bisexual womend -0.047 (0.026)
Data sets after 2010e 36.66% (0.49)
Region: US 30.0% (0.466)
Region: Canada 20.0% (0.406)
Region: UK 13.33% (0.345)
Region: Germany 3.33% (0.182)
Region: France 6.66% (0.253)
Region: Greece 3.33% (0.182)
Region: Sweden 6.66% (0.253)
Region: Australia 16.66% (0.379)
Dependent variable: Annual earningsf 40.0% (0.498)
Minority sexual orientation classification: Same sex living 50.0% (0.508)
arrangementsg
Sample size: More than a thousand observations for sexual 46.66% (0.507)
minoritiesh
Selection (Heckman) controlsi 30.0% (0.46)
Health/mental health controlsj 23.33% (0.430)
Notes: N=24 utilized studies. The sample consists of papers published between 2012 and 2020, capturing the period
1991-2018. Studies in meta-analysis: Ahmed et al., (2013), Aksoy at el. (2018), Bridges and Mann (2019), Bryson
(2017), Carpenter and Eppink (2017), Cerf (2016), Chai and Maroto (2020), Dilmaghani (2018), Drydakis (2012),
Hammarstedt et al. (2015), Humpert (2016), Jepsen and Jepsen (2017), Jepsen and Jepsen (2020), La Nauze (2015),
Laurent and Mihoubi (2012), Martell (2013), Mize (2016), Preston et al., (2020), Sabia (2014), Sabia (2015), Sabia et
al. (2017), Waite (2015), Waite et al. (2020), Wang et al. (2018).
(a) Continuous variable. Reference heterosexual men.
(b) Continuous variable. Reference heterosexual women.
(c) Continuous variable. Reference heterosexual men.
(d) Continuous variable. Reference heterosexual women.
(e) Period classification; 1=Data sets covering periods after 2010 (i.e., 2011-2014); 0= In all the other cases, that is,
data sets covering periods before 2010 (i.e., 1991-2000), and/or data sets covering simultaneous periods before and
after 2010 (i.e., 2008-2012).
(f) Earnings classification; 1=Annual earnings; 0=Hourly, or weekly earnings.
(g) Sexual orientation classification; 1=Same sex living arrangement; 0=Self-identification and/or sexual behaviour.
(h) Se al minorit data set s si e; 1=More than a thousand observations for sexual minority; 0=In all the other cases.
(i) Sample selection; 1= Existence of Heckman-type selection correction; 0= In all the other cases.
(j) Health/mental health status; 1= Information on health/mental health; 0=In all the other cases.
21You can also read