DISTRIBUTION OF SMALL MAMMALS (EULIPOTYPHLA, RODENTIA) IN THE GRADIENT DIRECTION URBAN-SUBURBAN-RURAL OF CENTRAL SLOVAKIA
←
→
Page content transcription
If your browser does not render page correctly, please read the page content below
Ekológia (Bratislava) - Journal of the Institute of Landscape Ecology, Slovak Academy of Sciences Vol. 40, No. 2, p. 145–153, 2021
doi:10.2478/eko-2021-0017
DISTRIBUTION OF SMALL MAMMALS (EULIPOTYPHLA, RODENTIA)
IN THE GRADIENT DIRECTION URBAN–SUBURBAN–RURAL
OF CENTRAL SLOVAKIA
VLADIMÍR LANGRAF 1, ZUZANA KRUMPÁLOVÁ2, KORNÉLIA PETROVIČOVÁ4, ZUZANA POLÁČIKOVÁ1,
MICHAL AMBROS3, JANKA SCHLARMANNOVÁ2
1
Department of Zoology and Anthropology, Faculty of Natural Sciences, Constantine the Philosopher University in Nitra, Tr. A. Hlinku 1, Nitra, Slovak Re-
public; langrafvladimir@gmail.com, zpolacikova@ukf.sk, jschlarmannova@ukf.sk
2
Department of Ecology and Environmental Sciences, Faculty of Natural Sciences, Constantine the Philosopher University in Nitra, Tr. A. Hlinku 1, Nitra,
Slovak Republic; zkrumpalova@ukf.sk
3
State Nature Protection of the Slovak Republic, Administration of the Protected Landscape Area of Ponitrie, Samova 3, 949 01 Nitra, Slovak Republic; michal.
ambros@sopsr.sk
4
Department of Environment and Zoology, Faculty of Agrobiology and Food Resources Slovak University of Agriculture in Nitra, Tr. A. Hlinku 2, 949 76
Nitra, Slovak Republic; kornelia.petrovicova@gmail.com
Corresponding author
Received: 29 November 2020 / Accepted: 7 February 2021
Abstract
Langraf V., Krumpálová Z., Petrovičová K., Poláčiková Z., Ambros M., Schlarmannová J.: Distribution of small mammals (Eulipotyphla, Rodentia) in
the gradient direction urban–suburban–rural of central Slovakia. Ekológia (Bratislava), Vol. 40, No. 2, p. 145–153, 2021.
Changes in the structure of small mammals’ communities (Eulipotyphla, Rodentia) along urban–rural gradient indicate the environmental state of
stability or instability. Since small mammals are important with regard to the transmission of diseases to man and domestic animals, therefore knowl-
edge of their association with the landscape structure is needed in land use planning. In course of the period from 2015 to 2017, there were recorded
109 individuals belonging to 15 species at 9 study sites (3 rural, 3 suburban, and 3 urban). We recorded a decrease in the average number of species
in the direction of the suburban–urban–rural gradient. The number of individuals decreased in the rural–urban–suburban gradient. Eudominant
species Clethrionomys glareolus (D = 20.2%), Microtus arvalis (13.8%), and Sorex araneus (19.3%) preferred the close links between the terms of
the rural landscape, while Apodemus agrarius (D = 11.9%) and Sorex minutus (D = 11.0%) preferred the close links between the terms of the urban
landscape.
Key words: small mammals, urban environment, pitfall traps, Slovakia.
Introduction is homogenized (Riem et al., 2012). Spatial modeling of small
mammals has dealt with (Vaniscottea et al., 2009) and demon-
The spatial distribution of animals is important for assessing the strated the suitability of reducing the effect of extrapolation to
potential impacts of environmental changes. Specific reactions map the distribution and clarify ecological processes. Currently,
of species communities and the presence of asymmetry of mor- research on small mammals focuses on the impact of urbaniza-
phometric features in the population are related to the charac- tion and urban fauna in America (Gardner-Santana et al., 2009;
teristics of the urban landscape and changes in the environment Munshi-South, Kharchenko, 2010), Asia (Hirota et al., 2004),
(Shigesada, 1980; Saito, Koike, 2013). Human development is and Europe (Baker et al., 2003). Also in the surrounding states of
changing the landscape in many ways that affect the distribution Slovakia, it was the work of Frynta et al. (1994) and Pelikán et al.
of wild species of mammals. Urban ecosystems differ from natu- (1983) for the Czech Republic. In Poland, small mammals were
ral ecosystems in warmer condition (microclimate), increased studied by Gliwicz (1981), Gortat et al. (2014, 2017), Haitlinger,
run off (hydrology), and higher concentrations of heavy metals (1962), and Jasińska, Goszczyński (2011). The diversity of small
(soil) (Alberti, 2005; Jančová, Baláž, 2004; Baláž, Jančová, 2005; mammal communities and of the abundance are affected by hu-
Jančová et al., 2006; Korénková et al., 2006; Baláž, Ambros, 2005, man alterations, particularly urbanization (Klimant et al., 2015).
2012; Baláž, 2010; Baláž, Zigová, 2020). The increasing urbaniza- These search results confirm the negative feed species Apode-
tion causing a shift in species composition from specialist to gen- mus sylvaticus and Crocidura russula in the urban landscape.
eralist (Alberti, Marzluff, 2004), and the composition of species In contrast, Mus musculus is usually associated with the human
© The Author(s) 2021. This is an open access article distributed under the terms of the CC BY-NC-ND license.
https://content.sciendo.com/view/journals/eko/eko-overview.xml
145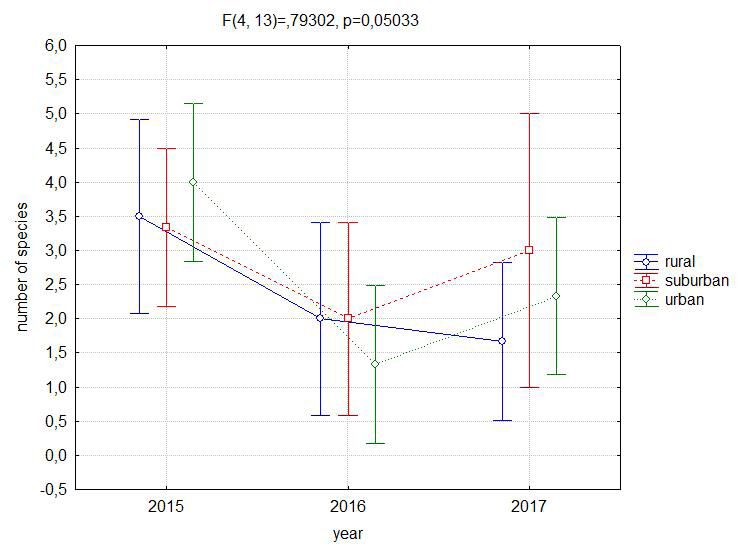
Ekológia (Bratislava) 2021: 40(2): 145–153

presence and attachment to the urban landscape. The influence              tion of vegetation structure. The distribution and abundance of
of the urban environment on the structure and occurrence of                small mammals are affected by the available resources, the evo-
small mammals in the direction of the urban–rural gradient was             lutionary history, the degree of specialization, as well as the in-
pointed out (Klimant et al., 2017; Baker et al., 2003). They have          teractions between species (Pelikán et al., 1977). Small mammals
found an increase in species richness in suburban conditions and           are detected by trapping in trap types and in various sizes, using
a decrease in the urban environment. They have defined exoan-              the linear and square methods (Kogut, Padley, 1997). Pitfall traps
thropic species Apodemus sylvaticus, A. flavicollis, Clethrionomys         are very effective for catching small species of small mammals
glareolus—avoiding man and his dwelling. Synanthropic species              (especially representatives of the Eulipotyphla), which at the
Crocidura suaveolens depend on human dwellings; hemisynan-                 same time are difficult to catch in metal live traps due to their
thropic species Microtus arvalis, Apodemus uralensis, Sorex ara-           low body weight (Pankakoski, 1979; Stanko et al., 1999). They
neus, S. minutus, and Mus spicilegus, Microtus subterraneus tend           have been studied by comparing the selective effects of three
to the suburban landscape. Decreased diversity with increasing             types of traps (ground, animal, and tipping) (Ambros, Gajdoš,
urbanization has been recorded (Cavia et al., 2009); the results           1988; Ambros et al., 2010; Dudich, Štollmann 1985). Larger vol-
indicate a strong connection of the species Rattus rattus, R. nor-         ume pitfall traps are used to make small mammals more success-
vegicus, and Mus musculus to the urban landscape. Dominant                 ful (Dudich et al., 1987).
representation in natural habitats of the rural landscape was                   The aim of this study is to determine the dispersion analysis
found in the species Oligoryzomys flavescens, Deltamys kempi,              of Eulipotyphla and Rodentia during the years 2015−2017 in the
Calomys musculinus, and Cavia aperea. They have found a nega-              direction of the urban–suburban gradient in the conditions of
tive effect of cat predation pressure and biota fragmentation on           Central Europe. The results of the research are useful in planning
small mammals in urban landscapes (Gomes et al., 2011), where              decisions on pest control based on the composition of rodent
they also have pointed to the reduction in the effect of fragmen-          communities derived from the landscape structure.
tation by creating gardens. Rodents are involved in the transmis-
sion of diseases to humans and animals. They also cause damage             Material and methods
to food storage and buildings, so information about their dis-
tribution in the city is important (Battersby, Greenwood, 2004;            The research of small mammals took place from 2015 to 2017,
Morello et al., 2000). Urban ecosystems have fewer opportunities           during the months of April–November in nine study sites and
for ecological services aimed at regulating populations of small           seven types of biotopes. Materials from pitfall traps were collect-
mammals to prevent their overgrowth (Clergeau et al., 2001).               ed at regular biweekly intervals. We used pitfall traps (volume:
Knowledge of the associations of species with the landscape                750 ml; Novák et al., 1969). Five pitfall traps were arranged in
structure can also help in urban planning and improve the envi-            the line per each locality at a distance of 10 m away from each
ronmental conditions of the city for the native fauna (Garden et           other. A total of 45 pitfall traps were used. We have used formal-
al., 2006; Fuente,1992).                                                   dehyde as a preservative solution. We have identified collected
     Small mammals may be valuable indicators of habitat quality           material, and the nomenclature according to Gaisler et al. (1962)
and may shape successional dynamics and even future composi-               and Baláž et al. (2013) was used.

Table 1. Location data of the study localities.

 Geomorphological unit         Study area          C. a.     m a.s.l.   Landscape                   Biotope                      G.C.
                                                                                                                              48°36ʹ27˝S
                             1 Lichovo            Utekáč       518        Rural               Culture of Picea abies
                                                                                                                              19°48ʹ23˝V
      Stolické vrchy                                                                                                          48°36ʹ30˝S
                             2 Lichovo            Utekáč       556        Rural                     Meadow
           hills                                                                                                              19°48ʹ35˝V
                                                                                                                              48°36ʹ34˝S
                             3 Farkaška           Utekáč       446        Rural        Nitrophilous waterside vegetation
                                                                                                                              19°47ʹ52˝V
                                                                                                                              48°26ʹ09˝S
                             4 Kúpna hora         Poltár       300      Suburban        Carpathian oak-hornbeam forest
                                                                                                                              19°49ʹ27˝V
                                                                                                                              48°25ʹ52˝S
                             5 Prievranka         Poltár       272      Suburban                     Pasture
                                                                                                                              19°49ʹ08˝V
                                                                                                                              48°25ʹ41˝S
                             6 Pažiť              Poltár       218      Suburban       Nitrophilous waterside vegetation
  Juhoslovenská kotlina                                                                                                       19°46ʹ35˝V
          basin                                                                                                               48°19ʹ08˝S
                             7 pri Ľadove         Lučenec      258        Urban           Carpathian turkey oak forest
                                                                                                                              19°37ʹ48˝V
                                                                                                                              48°19ʹ017˝S
                             8 Zajačie brehy      Lučenec      208        Urban                    Fallow field
                                                                                                                              19°39ʹ05˝V
                                                                                                                               48°20ʹ12˝S
                             9 Ľadovo             Lučenec      207        Urban        Nitrophilous waterside vegetation
                                                                                                                              19°37ʹ06˝V
Notes: C. a. ‒ cadastral area; m a.s.l. ‒ meters above sea level; G.C. ‒ geographic coordinates.

146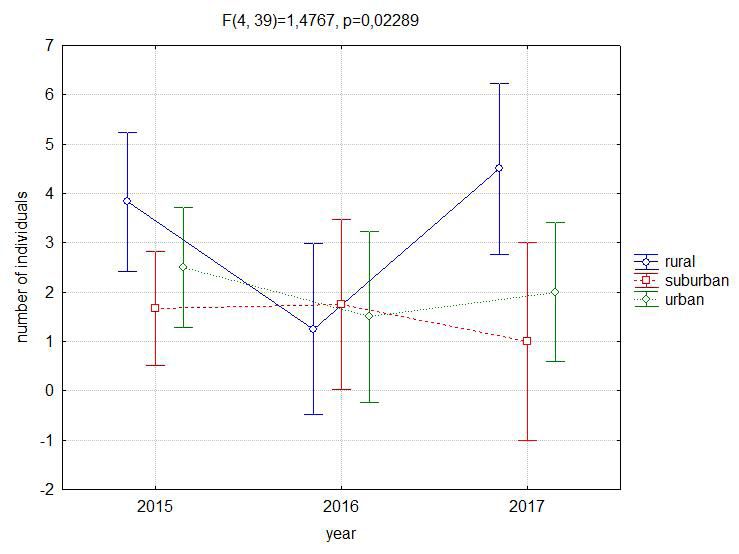
Ekológia (Bratislava) 2021: 40(2): 145–153

Study area                                                                  Spatial modeling of the distribution of small mammals of the
                                                                            studied areas (rural, subrurban, and urban) was determined by
The study areas are located in the southern part of Central Slova-          PCA (SD = 1.1 was on the first ordination axis). The values of
kia, geomorphological units Stolické vrchy hills, and Juhosloven-           the explained cumulative variability of species data were 68.7%
ská kotlina basin (Table 1).                                                on the first ordination axis and 98.09% on the second ordination
                                                                            axis. The ordination graph of material analysis (biplot) (Fig. 1)
Statistical analyses                                                        includes the species ordered into three clusters. The first cluster
                                                                            consists of species preferring the rural landscape, namely Neomys
Spatial modeling was performed by multivariate analysis with                anomalus, Sorex araneus, Clethrionomys glareolus, and Microtus
which we look for dependencies between objects of the rural,                arvalis. The second cluster was created by the species Apodemus
suburban, urban landscapes, and species. We used principal                  uralensis, Microtus agrestis, and Neomys fodiens correlating to the
component analysis (PCA) to evaluate the dependence between                 suburban landscape. The third cluster was represented by Ap-
objects (Ter Braak, Šmilauer, 2012). The statistical program Sta-           odemus agrarius, Cricetus cricetus, Micromys minutus, Microtus
tistica Cz. Ver. 7.0 Statistica Cz. Ver. 7.0 (StatSoft, Inc., 2004) us-     subterraneus, and Sorex minutus preferring urban landscape. Ap-
ing Shapiro–Wilk W test, Kruskal–Wallis test (ANOVA), Fried-                odemus flavicollis and Crocidura suaveolens are located between
man test (ANOVA), and Turkey’s HSD test (post-hoc) was used.                clusters II and III, indicating a preference for suburban and ur-
A significant difference in the number of individuals and species           ban landscapes. Muscardinus avellanarius was placed between
between 2015 and 2017 in the conditions of rural, suburban, or              clusters I and III, thus pointing to the connection of the species
urban landscapes was recorded.                                              to the rural and urban landscapes.
                                                                                 The normality data distribution number of individuals was
Results                                                                     tested by Shapiro–Willk W test during the years 2015−2017 (P
                                                                            value = 0.000). Based on the violation of the normality of the
In total, we have recorded 109 individuals belonging to 15 spe-             data distribution, we used a nonparametric Kruskal–Wallis test
cies in the studied areas. In rural conditions, we have obtained            (ANOVA) to confirm the statistically significant difference (P-
46 individuals belonging to 8 species; eudominants were Sorex               value = 0.047) (Fig. 2) of individuals between rural, suburban,
araneus (28%), Clethrionomys glareolus (24%), and Microtus ar-              and urban landscapes. From the results, we have seen a decrease
valis (20%). In the suburban area, we have captured 25 individu-            in the number of individuals in the direction of the rural–urban–
als belonging to 10 species; eudominants were Clethrionomys                 suburban gradient.
glareolus (28%), Sorex araneus (16%), and Neomys fodiens (12%).                   Based on the violation of the normality of the data distri-
In the urban area, we have obtained 38 individuals included in 11           bution, we used a nonparametric Friedman test (ANOVA) to
species; Apodemus agrarius (21%), Sorex minutus (18%), Apode-               confirm the statistically significant difference (P-value = 0.022)
mus flavicollis (13%), Microtus arvalis (13%), and Sorex araneus            (Fig. 3) of individuals during the year 2015−2017 between ru-
(11%) were eudominants (Table 2).                                           ral, suburban, and urban landscapes. Using a post-hoc test (Tur-

Table 2. Distribution of the Eulipotyphla and Rodentia in the study sites.

                                                               Rural               Suburban                  Urban         ∑ ind.     D (%)
                      Species
                                                        ind.        D (%)       ind.      D (%)       ind.        D (%)
 Apodemus agrarius (Pallas, 1771)                         4        8.70%          1      4.00%          8        21.05%      13      11.93%
 Apodemus flavicollis (Melchior, 1834)                   –         0.00%          4      16.00%         5        13.16%      9        8.26%
 Apodemus uralensis (Pallas, 1811)                       –         0.00%          1      4.00%         –          0.00%      1        0.92%
 Clethrionomys glareolus (Schreber, 1780)                11        23.91%         7      28.00%         4        10.53%      22      20.18%
 Cricetus cricetus (Linnaeus, 1758)                      –         0.00%         –       0.00%          1         2.63%      1        0.92%
 Crocidura suaveolens (Pallas, 1811)                     –         0.00%          1      4.00%          1         2.63%      2        1.83%
 Micromys minutus (Pallas, 1771)                          -        0.00%          -      0.00%          1         2.63%      1        0.92%
 Microtus agrestis (Linnaeus, 1761)                       -        0.00%          1      4.00%          -         0.00%      1        0.92%
 Microtus arvalis (Pallas, 1778)                          9        19.57%         1      4.00%          5        13.16%      15      13.76%
 Microtus subterraneus (de Sélys Longchamps,
 1836)                                                    -       0.00%           -       0.00%         1         2.63%      1        0.92%
 Muscardinus avellanarius (Linnaeus, 1758)               1        2.17%           -       0.00%         1         2.63%      2        1.83%
 Neomys anomalus (Cabrera, 1907)                         4        8.70%           -       0.00%         -         0.00%      4        3.67%
 Neomys fodiens (Pennant, 1771)                          1        2.17%           3       12.00%        -         0.00%      4        3.67%
 Sorex araneus Linnaeus, 1758                            13       28.26%          4       16.00%        4        10.53%     21       19.27%
 Sorex minutus Linnaeus, 1766                            3        6.52%           2       8.00%         7        18.42%     12       11.01%
 ∑ individuals                                           46        100%          25        100%        38         100%      109       100%
Note: ind. ‒ individuals.

                                                                                                                                          147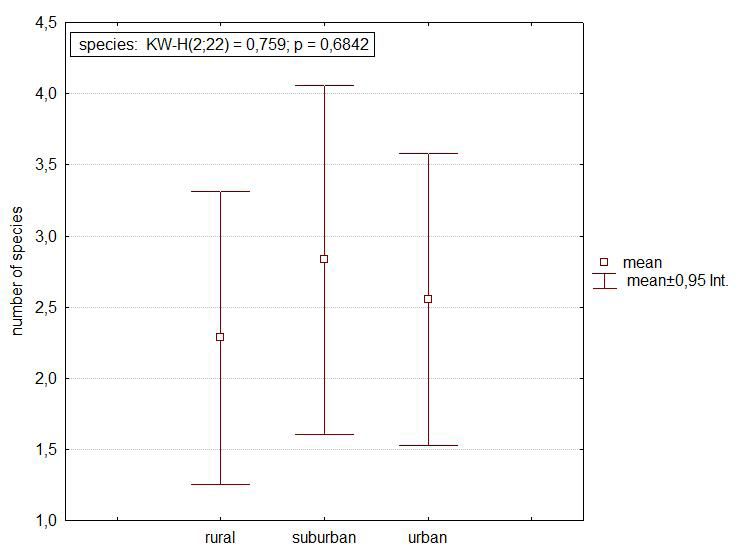
Ekológia (Bratislava) 2021: 40(2): 145–153

                        Fig. 1. PCA analysis of species distribution in the gradient urban–suburban–rural landscape.

key’s HSD), we have identified which landscapes (rural, subur-             conditions for 2016 and a subsequent increase for 2017. In the
ban, and urban) differed between 2015 and 2017 at the level of             suburban landscape, we have found a decrease between 2016 and
statistical significance pα = 0.05 (Table 3). From the results, we         2017. Urban landscape has decreased in 2016 and maintained a
have seen a decrease in the average value of individuals in rural          similar average value for 2017.

Table 3. Results of post-hoc test.

 Combinations           1              2             3             4             5             6             7             8             9
      1                 –            0.025         0.550         0.021         0.067         0.024         0.157         0.041         0.071
      2               0.025            –           0.011         0.688         0.682         0.849         0.240         0.837         0.501
      3               0.550          0.011           –           0.009         0.029         0.011         0.064         0.018         0.029
      4               0.021          0.688         0.009           –           0.936         0.563         0.323         0.872         0.714
      5               0.067          0.682         0.029         0.936           –           0.570         0.479         0.837         0.822
      6               0.024          0.849         0.011         0.563         0.570           –           0.203         0.704         0.414
      7               0.157          0.240         0.064         0.323         0.479         0.203           –           0.346         0.592
      8               0.041          0.837         0.018         0.872         0.837         0.704         0.346           –           0.653
      9               0.071          0.501         0.029         0.714         0.822         0.414         0.592         0.653           –

Notes: 1 ‒ rural in the year 2015; 2 ‒ rural in the year 2016; 3 ‒ rural in the year 2017; 4 ‒ suburban in the year 2015; 5 ‒ suburban in the year
2016; 6 ‒ suburban in the year 2017; 7 ‒ urban in the year 2015; 8 ‒ urban in the year 2016; 9 ‒ urban in the year 2017.

148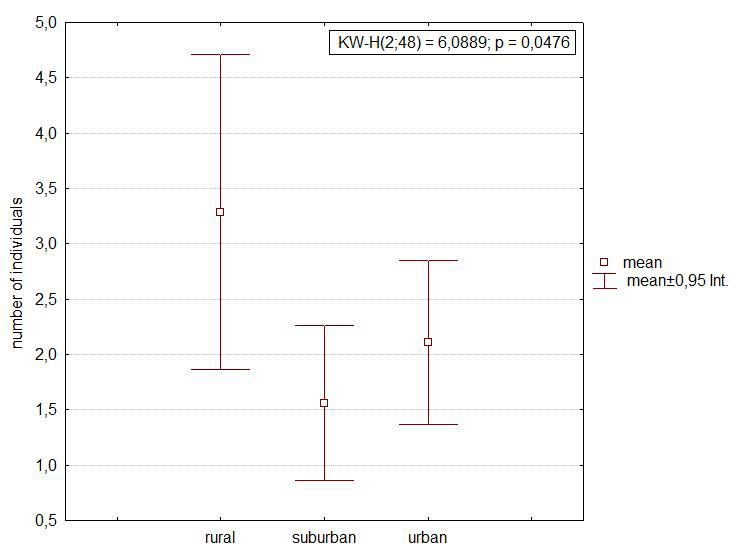
Ekológia (Bratislava) 2021: 40(2): 145–153
Fig. 2. Kruskal–Wallis test (ANOVA) to calculate the difference of number of individuals.
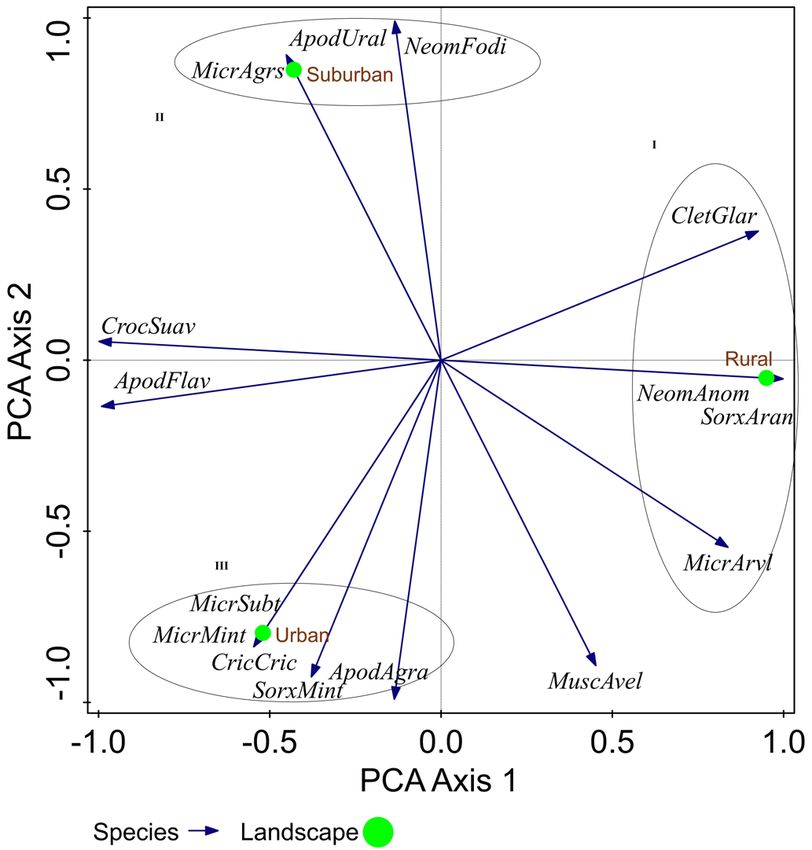
Fig. 3. Analysis of variance (Friedman test (ANOVA)) of the average number of individuals’ values.
149Ekológia (Bratislava) 2021: 40(2): 145–153
Fig. 4. Kruskal–Wallis test (ANOVA) to calculate the difference of number of species.
Fig. 5. Analysis of variance (Friedman test (ANOVA)) of average number of species values.
150Ekológia (Bratislava) 2021: 40(2): 145–153
Table 4. Results of post-hoc test.
Combinations 1 2 3 4 5 6 7 8 9
1 – 0.130 0.049 0.847 0.130 0.667 0.565 0.024 0.191
2 0.130 – 0.700 0.139 1.000 0.394 0.034 0.445 0.700
3 0.049 0.700 – 0.046 0.700 0.235 0.009 0.667 0.394
4 0.847 0.139 0.046 – 0.139 0.760 0.394 0.020 0.209
5 0.130 1.000 0.700 0.139 – 0.394 0.034 0.445 0.700
6 0.667 0.394 0.235 0.760 0.394 – 0.367 0.143 0.544
7 0.565 0.034 0.009 0.394 0.034 0.367 – 0.004 0.046
8 0.024 0.445 0.667 0.020 0.445 0.143 0.004 – 0.209
9 0.191 0.700 0.394 0.209 0.700 0.544 0.046 0.209 –
Notes: 1 ‒ rural in the year 2015; 2 ‒ rural in the year 2016; 3 ‒ rural in the year 2017; 4 ‒ suburban in the year 2015; 5 ‒ suburban in
the year 2016; 6 ‒ suburban in the year 2017; 7 ‒ urban in the year 2015; 8 ‒ urban in the year 2016; 9 ‒ urban in the year 2017.
The normality data distribution number of species was tested as the reason for effective capture was given by the small body-
by Shapiro–Willk W test during the years 2015−2017 (P value = weight of small mammals. The suitability of the linear method
0.047). Based on the violation of the normality of the data distri- of trapping as we have observed in our research has been also
bution, we used a nonparametric Kruskal–Wallis test (ANOVA) described by other authors (Kogut, Padley 1997).
to confirm the statistically nonsignificant difference (P-value = By spatial modeling of small mammals, we have confirmed
0.684) (Fig. 4) of species between rural, suburban, and urban the connection of species Neomys anomalus, Sorex araneus, Cle-
landscapes. We have observed a decrease in the number of spe- thrionomys glareolus, and Microtus arvalis to the rural landscape
cies in the direction of the suburban–urban–rural gradient. conditions. The species Apodemus uralensis, Microtus agrestis,
Based on the violation of the normality of the data distribu- and Neomys fodiens prefer conditions of the suburban landscape.
tion, we have used a nonparametric Friedman test (ANOVA) to We have found a correlation in the urban landscape in the spe-
confirm the statistically significant difference (P-value = 0.050) cies Apodemus agrarius, Cricetus cricetus, Micromy sminutus, Mi-
(Fig. 5) of species during the year 2015–2017 between the rural, crotus subterraneus, and Sorex minutus. The species Apodemus
suburban, and urban landscapes. Using a post-hoc test (Turkey’s flavicollis and Crocidura suaveolens showed a link to the urban
HSD), we have identified which landscapes (rural, suburban, and suburban landscapes, while Muscardinus avellanarius, in ad-
and urban) differed between 2015 and 2017 at the level of sta- dition to the urban environment, also linked to breeding condi-
tistical significance pα = 0.05 (Table 4). We have presented the tions. They have also defined a similar link (Klimant et al., 2015,
downward random phenomena in the average value of species 2017; Baker et al., 2003; Cavia et al., 2009; Frynta et al., 1994;
during the period 2015–2017 in rural conditions among all the Pelikán et al., 1983; Gliwicz, 1981; Gortat et al., 2017; Haitlinger,
years 2015–2017. We have found a decrease for the year 2016 1962; Jasińska, Goszczyński, 2011), where they have divided the
and then an increase in 2017 in terms of the suburban and urban species into synanthropic species, which included Crocidura sua-
landscapes. veolens with a connection to the urban environment as in our re-
sults. Among exoanthropic species with a connection to the rural
Discussion landscape, we have obtained one identical species Clethrionomys
glareolus. Hemisynanthropic species correlated with conditions
The highest number of species during the research years of the suburban landscape; we have found one identical species,
2015−2017 was recorded in the urban landscape and the lowest Apodemus uralensis. The suitability of the use of spatial modeling
in the rural landscape but with the highest number of individu- for the assessment of communities in the impact of environmen-
als. The lowest number of individuals was found in the suburban tal change has also been pointed out (Shigesada, 1980; Saito,
landscape. The spread of wildlife to the urban environment due Koike, 2013; Vaniscottea et al., 2009).
to human activity associated with land change has been con- The Kruskal–Wallis test (ANOVA) has confirmed a decrease
firmed by (Alberti, 2005; Jančová, Baláž, 2004; Baláž, Jančová, in the number of individuals in the direction of the rural–ur-
2005; Jančová et al., 2006; Baláž, Ambros, 2005, 2012; Kalivoda ban–suburban gradient and a decrease in the species in the di-
et al., 2010; Baláž, Zigová, 2020). The eudominant species of our rection of the suburban–urban–rural direction. They have found
results are Apodemus agrarius, Clethrionomys glareolus, Microtus a shift in species, a change in species composition, and their
arvalis (family Muridae), and Sorex araneus, S. minutus (family abundance due to urbanization (Alberti, Marzluff, 2004; Riem et
Soricidae). The more successful capture of species from the fam- al., 2012). The same results in the urban environment have been
ily Soricidae in pitfall traps has also been recorded (Ambros et confirmed in America (Gardner-Santana et al., 2009; Munshi-
al., 2010; Dudich, Štollmann, 1985). The great success of catching South, Kharchenko, 2010), Asia (Hirota et al., 2004), and Europe
species of the family Muridae into pitfall traps with a larger vol- (Baker et al., 2003; Gortat et al., 2014). We have found a decrease
ume was found in the work of Dudich et al. (1987). A more com- in the average value of species in year-on-year intervals in the
plex coenose of small mammals using pitfall traps was confirmed rural landscape, while the number of individuals increased dur-
(Pankakoski, 1979; Stanko et al., 1999; Ambros, Gajdoš, 1988), ing 2017. The decrease in species in 2016 and the subsequent in-
151Ekológia (Bratislava) 2021: 40(2): 145–153
crease were confirmed in the suburban and urban landscapes. Baláž, I. & Ambros M. (2005). Relationship of shrews (Sorex sp.) to forest
The number of individuals has decreased in suburban conditions biotopes in Western Carpathians. Ekológia (Bratislava), 24(3), 254−262.
DOI: 10.2478/eko-2020-0020.
during 2017; for the urban landscape, there was a decrease to
Baláž, I. & Jančová A. (2005). Small terrestrial mammals synusia changes
2016 with a subsequent random phenomenon in 2017. during several days of continual trapping. Ekológia (Bratislava), 24(4),
The distribution of small mammals is affected not only by the 337−343. DOI: 10.2478/eko-2020-0020.
availability of resources but also by the interaction between spe- Baláž, I. (2010). The influence of the altitude on somatic characteristics size
cies (Pelikán et al., 1977). Information of the species association of common vole (Microtus arvalis) in Slovakia. Ekológia (Bratislava),
29(2), 174−181. DOI: 10.2478/eko-2020-0020.
with the landscape structure will improve the planning of urban
Baláž, I. & Ambros M. (2012). Population analysis and spatial activity of Ro-
environmental conditions (Garden et al., 2006; Fuente, 1992) to dents in flooded forest conditions. Ekológia (Bratislava), 31(3), 249−263.
improve ecological services to prevent overpopulation (Clergeau DOI: 10.2478/eko-2020-0020.
et al., 2001). By preventing overgrowth, the transmission of dis- Baláž, I., Ambros, M., Tulis, F., Veselovský, T., Klimant, P. & Augustiničová
eases to humans and animals, respectively, damaged to stored G. (2013). Rodents and insectivores of Slovakia (in Slovak). Nitra: UKF.
foods (Battersby, Greenwood, 2004; Morello et al., 2000). Baláž, I. & Zigová M. (2020). Flea communities on small mammals in low-
land environment. Ekológia (Bratislava), 39(3), 260−269. DOI: 10.2478/
eko-2020-0020.
Conclusion Battersby, J.E. & Greenwood J.J.D. (2004). Monitoring terrestrial mammals
in the UK: past, present and future, using lessons from the bird world.
We have confirmed the decrease in the average value of species Mammal Rev., 34, 3–29. DOI: 10.1046/j.0305-1838.2003.00023.x.
Cavia, R., Cuetoa, R.C. & Suárez V. (2009). Changes in rodent communities
during the years 2015− 2017 in rural conditions, but the num- according to the landscape structure in an urban ecosystem. Landsc. Ur-
ber of individuals increased during 2017. In suburban and urban ban Plann., 90, 11–19. DOI: 10.1016/j.landurbplan.2008.10.017.
areas, the decrease in the number of species during 2016 and Clergeau, P., Jokimäki, J. & Savard J.-P.L. (2001). Are urban bird communities
the subsequent increase in 2017 were confirmed. The number of influenced by the bird diversity of adjacent landscapes? J. Appl. Ecol., 38,
individuals has decreased in 2017 in suburban and urban condi- 1122–1134. DOI: 10.1046/j.1365-2664.2001.00666.x.
Dudich, A. & Štollmann A. (1985). Pitfall traps and their effectiveness
tions in 2016, maintaining a similar value for 2017. The over- in terms of terrestrial micromamial fauna research. Biológia, 40,
all decrease in the average number of species during the years 1049−1054.
2015−2017 was in the direction of the suburban–urban–rural Dudich, A., Kleinert, J. & Štollmann A. (1987). Occurrence of small terres-
gradient and the number of individuals in the rural–urban–sub- trial mammals in samples obtained by pitfall traps. Lynx, 23, 43−50.
urban direction. We have found the association of eudominant Frynta, D., Vohralík, V. & Řezníček J. (1994). Small mammals (Insectivora,
Rodentia) in the city of Prague: distributional patterns. Acta Soc. Zool.
species Clethrionomys glareolus (D = 20%), Microtus arvalis Bohem., 58, 151−176.
(14%), and Sorex araneus (19%) with the rural landscape condi- Fuente, M.A. (1992). Distribucion y Preferencias de habitat de los Micro-
tions through spatial modeling. Apodemus agrarius (D = 12%) mamiferos (Insectivora e Rodentia) de la Sierra de Guadarrama. Disser-
and Sorex minutus (D = 11%) correlated with the urban land- tation, Universidad Complutense de Madrid.
Gaisler, J., Holišová, V., Pelikán, J. & Zejda J. (1962). The key to the identi-
scape.
fication of small mammals according to external signs (in Czech). Brno:
The results of the study are applicable to the creation of spa- ČSAV.
tial planning documents for the development of environmental Garden, J., McAlpine, C., Peterson, A., Jones, D. & Possingham H. (2006).
systems in the urban landscape, which we will deal with in future Review of the ecology of Australian urban fauna: A focus on spatially
studies. explicit processes. Austral Ecol., 31, 126–148. DOI: 10.1111/j.1442-
9993.2006.01578.x.
Gardner-Santana, L.C., Norris, D.E., Fornadel, C.M., Hinson, E.R., Klein,
Acknowledgements S.L. & Glass G.E. (2009). Commensal ecology, urban landscapes, and
their influence on the genetic characteristics of city-dwelling Norway
This research was supported by the project VEGA 1/0604/20 Environ- rats (Rattus norvegicus). Mol. Ecol., 18, 2766–2778. DOI: 10.1111/j.1365-
mental assessment of specific habitats in the Danube Plain. KEGA No. 294X.2009.04232.x.
019UKF-4/2021 Creation and innovation of education - Zoology for Gliwicz, J. (1981). Competitive interactions within aforest rodent com-
Ecologists, part – Invertebrates. munity in central Poland. Oikos, 37(3), 353–362. DOI: 10.2307/3544128.
Gomes, V., Ribeiro, R. & Carretero M.A. (2011). Effects of urban habitat frag-
mentation on common small mammals: species versus communities.
References Biodivers. Conserv., 20, 3577–3590. DOI: 10.1007/s10531-011-0149-2.
Gortat, T., Barkowska, M., Rutkowski, R., Gryczynska-Siemią Tkowska, A.,
Alberti, M. (2005). The effects of urban patterns on ecosystem func- Pieniążek, A., Kozakiewicz, A. & Kozakiewicz M. (2014). The effects
tion. International Regional Science Review, 28, 168–192. DOI: of urbanization – small mammal communities in a gradient of hu-
10.1177/0160017605275160. man pressure in Warsaw city, Poland. Pol. J. Ecol., 62, 163–172. DOI:
Alberti, M. & Marzluff J.M. (2004). Ecological resilience in urban ecosys- 10.3161/104.062.0115.
tems: linking urban patterns to human and ecological functions. Urban Gortat, T., Rutkowski, R., Gryczyńska, A., Kozakiewicz, A. & Kozakiewicz
Ecosystems, 7, 241–265. DOI: 10.1023/B:UECO.0000044038.90173.c6. M. (2017). The spatial genetic structure of the yellow-necked mouse in
Ambros, M., Baláž, I. & Gajdoš P. (2010). Small mammals (Rodentia, Eulipo- an urban environment − a recent invader vs. a closely related permanent
typhla) of the oak-hornbeam forest Báb near Nitra (Nitranská pahork- inhabitant. Urban Ecosystems, 20(3), 581–594. DOI: 10.1007/s11252-
atina – hilly land) (in Slovak). Rosalia, 21, 185−193. 016-0620-7.
Ambros, M. & Gajdoš P. (1988). The occurence of some vertebrates (Am- Haitlinger, R. (1962). Zmienność morfologiczna Apodemus agrarius (Pallas
phibia, Reptilia, Mammalia) in samples obtainedd from palitraps on the 1771). Acta Theriol., 8, 239–255. DOI: 10.4098/AT.arch.62-8.
territory of the Protected Landscape Area Ponitrie (in Slovak). Rosalia, Hirota,T., Hirohata, T., Mashima, H., Satoh, T. & Obara Y. (2004). Popula-
5, 177−188. tion structure of the large Japanese field mouse, Apodemus speciosus
Baker, P.J., Ansell, R.J., Dodds, P.A.A., Webber, C.E. & Harris S. (2003). Fac- (Rodentia: Muridae), in suburban landscape, based on mitochondrial
tors affecting the distribution of small mammals in an urban area. Mam- D-loop sequences. Mol. Ecol., 13, 3275–3282. DOI: 10.1111/j.1365-
mal Rev., 33, 95–100. DOI: 10.1046/j.1365-2907.2003.00003.x. 294X.2004.02324.x.
152Ekológia (Bratislava) 2021: 40(2): 145–153
Jančová, A. & Baláž I. (2004). The small mammals of selected localities Novák, K., Balát, F., Bartoš, E., Bouček, Z., Daniel, M., Dlabola, J., Doskočil, J.,
around Nitra (Žitavská hillock,Tribeč) (in Slovak). Rosalia, 17, 173–180. Holman, J., Jagemann, E., Kunst, M., Landa, V., Lang, J., Mařan, J., Miller,
Jančová, A., Massányi, P., Nad, P., Koréneková, B., Skalicka, M., Drábeková, F., Nosek, J., Novák, K., Obenberger, J., Obr, S., Pelikán, J., Raušer, J.,
J. & Baláž I. (2006). Accumulation of heavy metals in selected organs Rosický, B., Rusek, J., Schwarz, J., Skuhravý, V., Slouková, M., Šilhavý, V.,
of yellow-necked mouse (Apodemus flavicollis). Ekológia (Bratislava), Štys, P., Teyrovský, V., Vondráček, K., Zahradník, J. & Zelenský J. (1969).
25(1), 19−26. Methods of collecting and preparing insects (in Czech). Praha: Academia.
Jasińska, K. & Goszczyński J. (2011). The occurrence of mammals in Warsaw Pankakoski, E. (1979). The cone trap – a useful tool for index trapping of
cemeteries. Bydgoszcz: Uniwersytet Technologiczno-Przyrodniczy. small mammals. Ann. Zool. Fenn., 16, 144−150. https://www.jstor.org/
Kalivoda, H., Petrovič, F., Kalivodová, E. & Kürthy A. (2010). Influence of stable/23734422
the landscape structure on the butterfly (Lepidoptera, Hesperioidea Pelikán, J., Zejda, J. & Holišová V. (1977). Efficiency of different traps in
and Papilionoidea) and bird (Aves) taxocoenoses in Vel’ké Leváre catching small mammals. Folia Zool., 26, 1−13.
(SW Slovakia). Ekológia (Bratislava), 29(4), 337−359. DOI: 10.4149/ Pelikán, J., Zejda, J. & Homolka M. (1983). Mammals in the urban agglom-
ekol_2010_04_337. eration of Brno. Acta Scientiarum Naturalium Brno, 17, 1–49.
Klimant, P., Baláž, I. & Krumpálová Z. (2015). Communities of small mam- Riem, J.G., Blair, R.B., Pennington, D.N. & Solomon D.N. (2012). Estimating
mals (Soricomorpha, Rodentia) in urbanized environment. Biologia, 70, mammalian species diversity across an urban gradient. Am. Midl. Nat.,
839−845. DOI: 10.1515/biolog-2015-0088. 168, 315−332. DOI: 10.1674/0003-0031-168.2.315.
Klimant, P., Klimantová, A., Baláž, I., Jakab, I., Tulis, F., Rybanský, Ľ., Vadel, Saito, M. & Koike F. (2013). Distribution of Wild Mammal Assemblages
Ľ. & Krumpálová Z. (2017). Small mammals in an urban area: habitat along an Urban–Rural–Forest Landscape Gradient in Warm-Temperate
preferences and urban-rural gradient in Nitra city, Slovakia. Pol. J. Ecol., East Asia. PLoSONE, 8(5), e65464. DOI: 10.1371/journal.pone.0065464.
65, 144−157. DOI: 10.3161/15052249PJE2017.65.1.013. Shigesada, N. (1980). Spatial distribution of dispersing animals. J. Math. Biol.,
Kogut, N. & Padley V.D.A. (1997). Method for reducing mortalities in pitfall 9, 85–96. DOI: 10.1007/BF00276037.
traps. Transactions of the Western Section of The Wildlife Society, 33, 7578. Stanko, M., Mošanský, L., Fričová, J. & Casanova J.C. (1999). Comparison
Korénková, B., Skalická, M., Drábenková, J. & Baláž I. (2006). Accumulation of two sampling methods of small mammals in the margin of a lowland
of heavy metals in selected organs of yellow-necked mouse (Apodemus forest. Biológia, 54, 595−597.
flavicollis). Ekológia (Bratislava), 25(1), 19−26. DOI: 10.2478/eko-2020- Statsoft, Inc. (2004). StatisticaCz, version 7 (in Czech). www.StatSoft.Cz.
0020. TerBraak, C.J.F. & Šmilauer P. (2012). Canoco reference manual and
Morello, J., Buzai, G.D., Baxendale, C.A., Rodriguez, A.F., Matteucci, S.D., user’sguide: software for ordination, version 5.0. Ithaca: Microcomputer
Godagnone, R.E. & Casas R.R. (2000). Urbanization and the con- Power.
sumption of fertile land and other ecological changes: thecase of Vaniscottea, A., Pleydell, R.J.D., Raoul, F., Quéré, J.P., Jiamind, Q., Wang, Q.,
Buenos Aires. Environment and Urbanization, 12, 119–131. DOI: Tiaoying, L., Bernarda, N., Coeurdassier, M., Delattre, P., Takahashi, K.,
10.1177/095624780001200210. Weidmanne, J.CH. & Giraudouxa P. (2009). Modelling and spatial dis-
Munshi-South, J. & Kharchenko K. (2010). Rapid, pervasive genetic differ- crimination of small mammal assemblages: An example from western
entiation of urban white-footed mouse (Peromyscus leucopus) popula- Sichuan (China). Ecol. Model., 220, 1218–1231. DOI: 10.1016/j.ecolmo-
tion in New York City. Mol. Ecol., 19, 4242–4254. DOI: 10.1111/j.1365- del.2009.02.019.
294X.2010.04816.x.
153You can also read