Divergence promoted by the northern Andes in the giant fishing spider Ancylometes bogotensis (Araneae: Ctenidae)
←
→
Page content transcription
If your browser does not render page correctly, please read the page content below
Biological Journal of the Linnean Society, 2021, XX, 1–14. With 5 figures.

Divergence promoted by the northern Andes in the giant
fishing spider Ancylometes bogotensis (Araneae: Ctenidae)

                                                                                                                                    Downloaded from https://academic.oup.com/biolinnean/advance-article/doi/10.1093/biolinnean/blaa220/6105041 by guest on 02 February 2021
FABIAN C. SALGADO-ROA+,*, , ANDRES GAMEZ+, MELISSA SANCHEZ-HERRERA,
CAROLINA PARDO-DÍAZ and CAMILO SALAZAR
Department of Biology, Faculty of Natural Sciences, Universidad del Rosario, Carrera 24 No. 63C-69,
Bogota, DC 111221, Colombia

Received 7 October 2020; revised 3 December 2020; accepted for publication 5 December 2020

The biodiversity of the tropical Americas is a consequence of the interplay between geological and climatic events,
with the Andean uplift being a major driver of speciation. Multiple studies have shown that species diversification
promoted by the Andes can occur in the presence or absence of gene flow. However, to date, the majority of research
addressing this aspect has been conducted in vertebrates, whereas other highly diverse tropical organisms such
as arthropods remain uninvestigated. We used a combination of phylogenetics, population genetic analyses and
species distribution models to explore whether the northern Andes played a role in the diversification of Ancylometes
bogotensis. We detected two major lineages that are separated by the Eastern Cordillera of the Colombian Andes, and
they share the same climatic niche. These groups diverged at ~3.85 Mya and exhibit no signatures of gene flow, which
can be a consequence of the Andean highlands being poorly suited habitats for this species, thus preventing their
genetic connectivity. Our study reveals that the genetic structure of an arachnid species that has limited dispersal
capacity and is highly dependent on water bodies is shaped by the Andean orogeny. The generality of this observation
remains to be assessed in other invertebrates.

ADDITIONAL KEYWORDS: Ancylometes bogotensis – Andes – Araneae – niche conservatism – phylogeography
– spiders.

                    INTRODUCTION                                    lineages in northern South America (Weir & Price,
                                                                    2011; Quintero et al., 2013; Reis et al., 2020).
The origin and evolution of biodiversity in the tropical
                                                                      An alternative to the “Andean vicariance hypothesis”
Americas is strongly related to a series of geological
                                                                    holds that the Andes is a permeable barrier that allows
and climatic processes that promoted divergence and
                                                                    species dispersal (Miller et al., 2008; Cadena et al.,
created opportunities for speciation (Rull, 2011). In
                                                                    2016; Oswald et al., 2017). This model provides a better
particular, the uplift of the Andes is considered as one
                                                                    explanation for the divergence observed in some taxa
of the most important events in the evolutionary and
                                                                    subsequent to the uplift and for the heterogeneity in
biogeographical history of South American diversity
                                                                    divergence times among lineages associated with this
(Rull, 2011; Turchetto-Zolet et al., 2013). The origin of
                                                                    barrier (Smith et al., 2014; Rodriguez-Muñoz et al.,
this mountain chain promoted biotic diversification by
                                                                    2020). The dispersal of species across the Andes after
disrupting the continuous distribution of widespread
                                                                    the uplift has been explained by the existence of either
lineages and preventing east–west dispersal, thus
                                                                    (1) altitudinal depressions along the mountain chain
acting as a vicariant barrier (Chapman, 1917). This
                                                                    (Chapman, 1917, 1926) or (2) wet forest corridors in
hypothesis has been supported by multiple studies
                                                                    the northern lowlands of South America (Haffer, 1974).
indicating that the uplift of the Andes coincided with
                                                                      In Colombia, the northern Andes are divided into
the timing of diversification for multiple lowland
                                                                    the following three mountain ranges: the Western
                                                                    Cordillera (WC), the Central Cordillera (CC) and the
*Corresponding author. E-mail: fcsalgador@gmail.com, fabianc.       Eastern Cordillera (EC). The WC is the lowest cordillera
salgado@urosario.edu.co                                             (maximum elevation of 4000 m a.s.l.), running parallel
+
 These authors equally contributed to the work                      to the Pacific coast, and suffered an abrupt uplift

© 2021 The Linnean Society of London, Biological Journal of the Linnean Society, 2021, XX, 1–14                                1
This is an Open Access article distributed under the terms of the Creative Commons Attribution-NonCommercial-NoDerivs licence
(http://creativecommons.org/licenses/by-nc-nd/4.0/), which permits non-commercial reproduction and distribution of the work, in
any medium, provided the original work is not altered or transformed in any way, and that the work is properly cited. For commer-
cial re-use, please contact journals.permissions@oup.com
2 F.C. SALGADO-ROA ET AL.
between ~16 and ~5 Mya (Villagómez & Spikings, relief in the Oligocene (Mora-Páez et al., 2016) or mid-
2013). This cordillera forms a barrier between the Miocene (15–13 Mya ; Montes et al., 2019). Multiple
Pacific lowlands and the Cauca River basin (Fig. 1), genetic studies have suggested that the EC acts as
and it is known to have promoted diversification in an absolute or permeable barrier that promoted
taxa such as Heliconius butterflies (Arias et al., 2014) divergence in Gasteracantha spiders (Salgado-Roa
and tropical palms (Bacon et al., 2018). The CC is the et al., 2018), Polythore damselflies (Sánchez-Herrera
Downloaded from https://academic.oup.com/biolinnean/advance-article/doi/10.1093/biolinnean/blaa220/6105041 by guest on 02 February 2021
oldest, narrowest and highest cordillera (rising to et al., 2020), bees (Dick et al., 2004), kissing bugs
approximately 5800 m a.s.l.). It started its uplift in (Caicedo-Garzón et al., 2019), birds (Schultz et al.,
the Early Cretaceous and experienced two additional 2019), and frogs, reptiles and mammals (Rodriguez-
elevation pulses at 41 and 25–22 Mya (Restrepo- Muñoz et al., 2020).
Moreno et al., 2009; Villagómez & Spikings, 2013). The The Andes are a barrier to dispersal not only because
CC divides the basins of the Magdalena River and the of their absolute height or width, but also because of the
Cauca River (Fig. 1), and studies on Trichonephila striking climatic variation found along their lowlands–
spiders (Bartoleti et al., 2018) and Dichotomius highlands elevation gradient (Janzen, 1967). This can
beetles (Pardo-Diaz et al., 2019) have demonstrated occur either because the climate proper of the highlands
its role in structuring the subpopulations at both of impedes the survival of lowland lineages, thus limiting
its sides. The EC is the widest cordillera and reaches the connectivity of ecologically similar subpopulations
a maximum elevation of 5000 m a.s.l. (Guarnizo et al., at opposite sides (i.e. niche conservatism), or because
2015; Montes et al., 2019). The uplift of this cordillera the uplift itself generated distinct habitats at both
was a diachronous and complicated process; it started sides, causing local adaptation and diversification (i.e.
during the Eocene and Early Miocene (Ochoa et al., niche divergence) (Wiens & Graham, 2005; Warren
2012) and, based on fossil pollen and fruit records, was et al., 2014). Existing evidence regarding Andean
suggested to undergo a subsequent elevation between organisms indicates that climatic niches are more
6 and 3 Mya (Gregory-Wodzicki, 2000; Hooghiemstra conserved among sister lineages (niche conservatism),
et al., 2006; Hoorn et al., 2010). Alternatively, other which is consistent with a scenario of allopatric
authors suggest that the EC already had a significant speciation due to climatic barriers (Cadena et al., 2012;
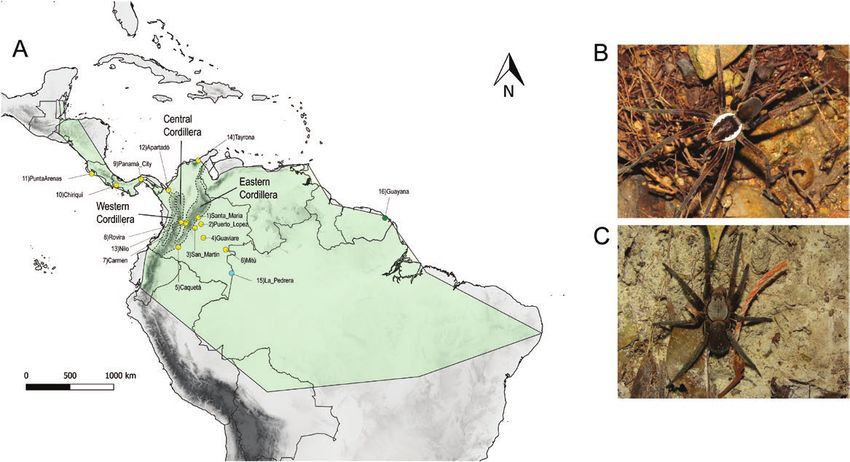
Figure 1. Distribution and sampling of A. bogotensis. A, known distribution of A. bogotensis is shown with a transparent
green figure calculated with a minimum convex polygon in QGIS v.3.4.4. Yellow dots represent localities where we sampled
A. bogotensis. The blue dot illustrates the sampling locality of A. rufus, and the green dot indicates the sampling locality
of A. bogotensis sequences available in GenBank. B, male of A. bogotensis. C, female of A. bogotensis. Photo credits: Nicolas
Hazzi.
© 2021 The Linnean Society of London, Biological Journal of the Linnean Society, 2021, XX, 1–14
DIVERGENCE OF THE GIANT FISHING SPIDER                  3

Muñoz-Ortiz et al., 2015). However, this evidence is                          MATERIAL AND METHODS
primarily derived from studies on vertebrates, and
                                                                                      Sampling design
little is known about the drivers of diversification in
the Andes for non-vertebrate taxa.                                We collected a total of 63 individuals of A. bogotensis
   Ancylometes Bertkau, 1880, is a spider genus                   from 16 localities in Colombia, Panama and Costa
consisting of 11 species that are distributed in                  Rica (Fig. 1; Supporting Information, Table S1).
                                                                  Individuals were captured by hand, at night,

                                                                                                                            Downloaded from https://academic.oup.com/biolinnean/advance-article/doi/10.1093/biolinnean/blaa220/6105041 by guest on 02 February 2021
Central and South America and are among the
largest araneomorph genera known to date (Hofer                   around freshwater bodies. To ensure the correct
& Brescovit, 2000). These are hunting spiders that                morphological identification of individuals, we
inhabit riverine vegetation and moist tropical forests            followed the description available in the last
(Hofer & Brescovit, 2000; Lapinski & Tschapka,                    taxonomical revision for the genus (Hofer &
2013; Lapinski et al., 2015). Ancylometes bogotensis              Brescovit, 2000). All specimens were deposited in
(Keyserling, 1877), which is found from Bolivia to                the “Colección de Artrópodos de la Universidad del
Honduras, is the only species in the genus that occurs            Rosario” (CAUR #229), preserved in 96% ethanol and
at the west side of the Andes where it occupies lowland           stored at −80 °C until needed.
habitats (0–1500 m a.s.l.) and exhibits no spatial
variation or structure (Hofer & Brescovit, 2000).
Females of A. bogotensis reach a total body length                          DNA extraction, amplification,
of 26 cm, and males can reach up to 21 cm (Hofer &                             sequencing and alignment
Brescovit, 2000). This spider actively hunts at night,            DNA was extracted from leg tissue using the Qiagen
and its prey include insects, frogs, tadpoles, fishes and         DNeasy Blood and Tissue Kit according to the
even freshwater crabs (Bhukal et al., 2015; Salcedo-              manufacturer’s protocol. We then amplified two loci
Rivera et al., 2018). Moreover, A. bogotensis can hide            which have been used to explore species and population
up to 20 min underwater when disturbed (Hofer                     divergence (Agnarsson, 2010; McHugh et al., 2014),
& Brescovit, 2000), and based on life history traits              the mitochondrial cytochrome oxidase I (COI; 579 bp)
such as constructing a nursery web, it is considered              and the nuclear internal transcribed spacer subunit
to have an intermediate mobility index (Piacentini &              II (ITS2; 318 bp). The former was amplified using the
Ramírez, 2019), thus making it an excellent system                primers LCO1490 and HCO2148 (Folmer et al., 1994),
to investigate how the Andes shape the arthropod’s                and the latter was amplified using the primers 5.8S
diversity in South America.                                       and 28S (White et al., 1990), using conditions reported
   In this study, we used a combination of phylogenetic           previously (McHugh et al., 2014; Peres et al., 2015).
reconstructions, population genetic analyses, and                 Positive amplicons were visualized on a 1.5% agarose
distribution niche models to test three hypotheses.               gel, purified with ExoSAP-IT (USB Corp., Cleveland,
First, the Andes act as an absolute barrier to dispersal          OH), and bidirectionally sequenced by Macrogen
for A. bogotensis. Under this scenario, we expect to              Inc. Base calls and contig assemblies were checked
find genetic structure between individuals occurring              and edited in Geneious Prime 2019.2.1 (https://www.
on opposite sides of one or more of the cordilleras and           geneious.com). We also included all the sequences of
monophyly among individuals at the same side. Such                A. bogotensis available in GenBank to broaden our
differentiation agrees with both niche conservatism               taxon sampling (Registration numbers KY017632.1
and niche divergence, but it indicates that the                   and KM225090.1; Supporting Information, Table S1).
climatic variation along the mountains effectively                For individuals with heterozygous calls in ITS2, we
limits the dispersal of the spider. Second, the Andes             performed a haplotype inference with the PHASE
constitute a permeable barrier for this giant fishing             algorithm implemented in DNASP v.5.10 (Librado &
spider. This scenario predicts subpopulation structure            Rozas, 2009) with 5000 iterations per simulation and
between individuals occurring on opposite sides and               accepting inferred haplotypes with a confidence >
lack of monophyly among individuals on the same                   90%. Then, the sequences for each locus were aligned
side (consistent with gene flow). This pattern is                 in MEGA X (Kumar et al., 2018) using the MUSCLE
consistent with niche conservatism and the existence              algorithm (Edgar, 2004). The alignments were visually
of multiple suitable environments for this spider                 inspected and corrected where pertinent in Mesquite
along the mountains. Third, the Andes have no                     (Maddison & Maddison, 2015). Finally, the COI
effect on the distribution of the genetic variation of            alignment was checked for stop codons by translating
A. bogotensis. This scenario predicts non-genetic and             into amino acids using mtDNA invertebrate as the
climatic divergence between individuals occurring on              genetic code in Mesquite (Maddison & Maddison,
opposite sides.                                                   2015).

© 2021 The Linnean Society of London, Biological Journal of the Linnean Society, 2021, XX, 1–14
4 F.C. SALGADO-ROA ET AL.
Molecular phylogenetics and estimation A. bogotensis constitute different species using
of divergence time two delimitation methods: multi-rate Poisson Tree
We deduced the phylogenetic relationships among Processes [mPTP (Kapli et al., 2017)] and Bayesian
all individuals using maximum likelihood (ML) and Phylogenetics and Phylogeography [BPP (Yang,
Bayesian inference (BI) using Ancylometes rufus 2015)]. For mPTP, the concatenated ML tree was used
(Walckenaer, 1837), Ctenus cf. datus Strand, 1909 as input. Because this analysis is sensitive to false
Downloaded from https://academic.oup.com/biolinnean/advance-article/doi/10.1093/biolinnean/blaa220/6105041 by guest on 02 February 2021
and Spinoctenus escalerete Hazzi, 2018 (Supporting positives (oversplitting) when highly similar sequences
Information, Table S1) as outgroups. The ML tree are present, we calculated the minimum branch length
topology was estimated for each locus and for a to correct for this potential error. We then ran ten
concatenated alignment of both loci (using one partition replicate Markov chain Monte Carlo (MCMC) chains
per locus) in IQ-Tree v.2.0 (Minh et al., 2020). The latter of 100 million steps each, sampling every 1000 steps,
alignment was generated in Mesquite v.3.0.4 (Maddison of which 10% were discarded as burn-in. For BPP, we
& Maddison, 2015), with a single sequence per individual, performed a joint species delimitation and species tree
where heterozygous bases were coded using the IUPAC estimation for each locus, where individuals were a
code. We selected the best substitution model using the priori assigned to a “species” based on phylogeny. Four
IQ-Tree feature ModelFinder (Kalyaanamoorthy et al., combinations of priors were used for the ancestral
2017) based on the Bayesian information criterion. Node population size (θ) and the root age of the tree (τ),
support was calculated using 10 000 UltraFast Bootstrap representing combinations between large population
pseudoreplicates. Values > 95% were considered as good sizes [θ = G(1, 10)] and shallow population sizes
support. For the partitioned analysis, the node support [θ = G(2, 2000)], with deep divergence times [τ = G(1,
was estimated by resampling the partitions and then the 10)] and shallow divergence times [τ = G(2, 2000)].
sites within the resampled partitions (Gadagkar et al., The analysis was run for 100 000 iterations, sampling
2005). every two iterations, using 10% of the chain as burn-in.
We also estimated the divergence times using a Finally, only lineages that were congruently delimited
multilocus species tree approach (*BEAST2) in BEAST in both methods were considered as putative species
v.2.6 using the Yule’s model (Bouckaert et al., 2019). The according to the recommendation of Carstens et al.
COI substitution rate parameter was used as a normal (2013).
prior with mean = 0.01679 (SD = 0.001) substitution/
site/million years, which was recently reported for wolf Population genetics
spiders (Piacentini & Ramírez, 2019). The ITS2 mean
For characterizing the genetic variability of
rate was estimated in the analysis using a log-normal
A. bogotensis, we calculated the following summary
prior with mean = 0.005 (SD = 0.01) substitution/
statistics in DNASP v.5.10 (Librado & Rozas, 2009):
site/million years, which encompasses published
haplotype diversity (Hd), genetic diversity (π), number
mutation rates for spiders (Bidegaray-Batista et al.,
of segregating sites (SS) and population substitution
2011; Piacentini & Ramírez, 2019). We selected the
rate (ϴ). Moreover, the genetic differentiation was
best molecular clock model for each dataset applying
estimated between the populations separated by
the likelihood ratio test implemented in MEGA 6.0
the EC using a relative measure (F ST) and three
(Tamura et al., 2013), and based on the results, we
absolute measures (Dxy, Da and DST). Deviations from
applied a different clock model for each partition (strict
panmixia were evaluated by the Hudson permutation
molecular clock for COI and uncorrelated relaxed clock
test (Hudson et al., 1992) using 1000 replicates.
for ITS2). Next, we ran three independent runs of 50
In addition, we evaluated the hierarchy of genetic
million generations, sampling every 1000 generations.
variation by an analysis of molecular variance
We confirmed the convergence of the chains to a
(AMOVA) in Arlequin v.3.5 (Excoffier & Lischer,
stationary distribution by verifying that the effective
2010) using 10 000 permutations. In this analysis, we
sample sizes of the parameters were > 200 in TRACER
evaluated the structure at the following three levels:
(Rambaut et al., 2018). The independent runs were
among geographical regions, among populations
combined using LOGCOMBINER (Drummond et al.,
within regions, and within populations. To evaluate
2012), and the maximum credibility tree was computed
the relationships among haplotypes, we constructed
in TREEANNOTATOR (Drummond et al., 2012) using
haplotype median-joining networks for each locus
10% of the trees as burn-in.
in PopArt v.1.7 (Leigh et al., 2015). Furthermore,
neutrality tests were computed to explore the following
signatures of population expansion or contraction:
Species delimitation Tajima’s D [D (Tajima, 1989)], Fu and Li’s [FL (Fu
Because divergent lineages may represent cryptic & Li, 1993)] and Ramos-Onsins and Rozas R2 [R2
species, we evaluated whether subpopulations of (Ramos-Onsins & Rozas, 2002)].
© 2021 The Linnean Society of London, Biological Journal of the Linnean Society, 2021, XX, 1–14DIVERGENCE OF THE GIANT FISHING SPIDER 5
We also examined the spatial patterns of genetic of A. bogotensis would explain the genetic differences
variation using two approaches. In the first approach, among populations. Distribution records were
we assessed a scenario of isolation by distance obtained from the literature (Hofer & Brescovit, 2000;
by implementing a Mantel test in the R package Hazzi et al., 2013), public databases (www.gbif.org),
vegan (Dixon, 2003). For this purpose, the genetic and fieldwork conducted by us. To reduce sampling
distances among localities were linearized using an bias, which can negatively affect the distribution
Downloaded from https://academic.oup.com/biolinnean/advance-article/doi/10.1093/biolinnean/blaa220/6105041 by guest on 02 February 2021
F ST transformation (1/1-F ST), and the geographical models (Reddy & Dávalos, 2003; Peterson et al., 2014;
distances were calculated with the function distm Radosavljevic & Anderson, 2014), spatial filters of
from the package geosphere (Hijmans, 2016). Due 10 km were applied, and 98 records were obtained.
to the known limitations of the Mantel test (Mantel, Furthermore, to avoid overfitting of the models due
1967), we also evaluated the linear correlation to the colinearity of climatic variables, we evaluated
between genetic and geographical distances (Diniz- the autocorrelation among 21 variables obtained from
Filho et al., 2013). In the second approach, we applied the Worldclim database [www.worldclim.org (Fick
Monmonier’s algorithm (Manni et al., 2004) in the R & Hijmans, 2017)] and the CGIAR-CSI (Consortium
package adegenet (Jombart & Ahmed, 2011) using for Spatial Information, http://www.cgiar-csi.org).
a Delaunay triangulation to detect spatial genetic The following six not strongly correlated variables
boundaries associated with geographic barriers. (Pearson < 0.8) with an approximate resolution of 1
Finally, to identify the number of genetic clusters (K) km2 were selected: annual mean temperature (Bio1),
in each locus, a Bayesian analysis of population structure mean diurnal range (Bio2), temperature seasonality
was implemented in BAPS v.6.0 (Corander et al., 2008). (Bio4), annual precipitation (Bio12), precipitation
In this software, we used the “spatial clustering of seasonality (Bio15), and precipitation of warmest
individuals” option, ranging from K = 1 to K = 20, and quarter (Bio18).
selected the optimal number of genetic clusters based on Th e m o d e l l i n g are a wa s w i t h i n t h e li mits
the highest marginal log-likelihood estimate. 22.06 °N–9.43 °S, 41.99 °W–95.32 °W (i.e. from Central
America to Central Amazonia), which we defined as the
accessible area of A. bogotensis (Barve et al., 2011) based
Demographic model testing on the world’s terrestrial ecoregions (Olson et al., 2001)
We constructed six demographic models and evaluated and the biogeographic regions of endemism (Morrone,
which one best fitted our data using PHRAPL 2014). SDMs were estimated using the R package
[Phylogeographic Inference Using Approximate Kuenm (Cobos et al., 2019), which implements Maxent
Likelihoods (Jackson et al., 2017)]. All models had a as the modelling algorithm v.3.3.3k (Elith et al., 2011).
unique coalescent event but were variable in the size Models were estimated under alternative combinations
and direction of migration. We first assigned each of model response types (i.e. all potential combinations
sample to a geographic group (east or west of the of linear, quadratic, product, threshold and hinge), six
Andes) based on its collection locality. Then, we built regularization multiplier values (0.5–3 with intervals
input gene trees for each locus in IQ-Tree (as specified of 0.5), and one set of environmental variables. A total of
earlier). Gene trees were subsampled at random 100 348 models were evaluated in this manner. Candidate
times, sampling three tips per group in each replicate. models were selected based on partial ROC analysis
This generated a total of 200 observed trees that (Peterson et al., 2014) that was conducted using two
were compared to 100 000 simulated trees for each subsets of data: 70% of presence records to calibrate
model. The latter approach was implemented using the models and 30% to validate them. We performed
different values for divergence time (t = 0.30, 0.58, 100 pseudoreplicates with bootstrap and an omission
1.40, 2.54 and 4.1) and migration (m = 0.10, 0.22, 0.46, error of 10% (E = 10%) was allowed. Next, the models
1.00 and 2.15) in units of 4 N and 4 Nm, respectively. were filtered based on omission rate using an E = 10%
These values were selected to represent scenarios of adjusted threshold. After this process, we selected the
shallow and deep divergence and models with low or best model with the AIC corrected for small sample
high migration. This analysis was conducted to select sizes (AICc). Finally, the best model was generated
the best demographic model based on the Akaike using the selected parameter settings with 20 bootstrap
information criterion (AIC) and AIC weights, and not replicates. The same workflow was followed to estimate
to estimate population parameters. SDMs for each lineage that split the modelling area
into east and west of the EC.
To assess niche divergence between lineages, we
Species distribution modelling and split the previous modelling area into east and west of
niche comparisons the EC. The niche equivalency and the niche similarity
Species distribution models (SDM) were developed to test (Warren et al., 2008) was used to assess the niche
evaluate whether the distribution breaks in the range divergence hypothesis by performing 1000 simulated
© 2021 The Linnean Society of London, Biological Journal of the Linnean Society, 2021, XX, 1–146 F.C. SALGADO-ROA ET AL.
replicates in the R package Ecospat (Di Cola et al., 2017). early Pliocene boundary. Moreover, the samples from
Both metrics were estimated using an environmental Central America did not form a monophylogenetic
principal component analysis (PCA-env) (Broennimann clade (Fig. 2; Supporting Information, Figs S1–
et al., 2012), calibrated with the east and west distribution S6). The available GenBank data for A. bogotensis
areas. We then created a grid of 100 × 100 cells over the appeared monophyletic and sister to A. rufus,
ordination space, and a kernel density function was suggesting that these individuals are a different
Downloaded from https://academic.oup.com/biolinnean/advance-article/doi/10.1093/biolinnean/blaa220/6105041 by guest on 02 February 2021
applied on the occurrence data to estimate Schoener’s Ancylometes species from French Guiana.
D index (Schoener, 1968) and the similarity statistic I
(Warren et al., 2008). D and I values range from 0 to 1,
with 0 being no niche overlapping and 1 complete overlap. Population genetics
These calculations were run with the two principal Nuclear and mitochondrial measures of genetic
components that explained most of the variation. diversity were higher in the wEC group than in the
eEC (Table 1; Supporting Information, Table S2),
which could reflect differences in sample sizes. All
RESULTS neutrality tests in both loci were not statistically
significant, suggesting neutral evolution and ruling
Molecular phylogenetics and out demography as a factor affecting diversity patterns
divergence time in each clade. Haplotype networks show two major
The most suitable substitution models for COI and groups that are concordant with the geographical
ITS2 were TN+F+G4 and K2P+G4, respectively. clades found in the phylogenetic analysis (21 and 11
The mean substitution rate for ITS2 estimated in mutational steps between them in mtDNA and nDNA,
*BEAST was 0.0085/Ma (95% HPD interval = 0.0022– respectively). However, individuals from Apartadó
0.017). Both BI and ML gene topologies were were separated by 12 and two mutational steps
concordant, resulting in two well-supported from other subpopulations in the wEC (Fig. 3). In
reciprocal monophyletic clades for A. bogotensis agreement with the phylogenetic signal, we detected
(Fig. 2; Supporting Information, Figs S1–S4). These strong genetic differentiation between eEC and wEC
phylogenetic clusters grouped the populations from in all our population structure summary statistics
the eastern (eEC) and the western sides (wEC) of the (Table 2; Supporting Information, Figs S5, S6). Most
EC (Fig. 2). The estimated divergence time for these of the genetic variation in the AMOVA analysis was
groups was 3.85 Mya (95% HPD = 1.33–7.49 Mya ; explained by differences between the wEC and eEC
Fig. 2; Table 4), thus falling in the late Miocene and regions (64% in nDNA and 65% in mtDNA) rather than
A P
TP
B BP
mP
10Chiriqui
11Chiriqui
12Chiriqui
13Chiriqui
50Puntarenas
51Puntarenas
wEC Ancylometes bogotensis 53Rovira
49Puntarenas
61tayrona
8Carmen
1 32Nilo
52Rovira
9Carmen
9_1Carmen
30Nilo
9Carmen
eEC Ancylometes bogotensis 33PanamaCity
34PanamaCity
1Apartado
2Apartado
0.98 4Apartado
3Apartado
58SantaMaria
French Guayana Ancylometes bogotensis 6Caqueta
7Caqueta
59SantaMaria
35PuertoLopez
0.99 60SantaMaria
57SanMartin
56SanMartin
37PuertoLopez
39PuertoLopez
42PuertoLopez
Ancylometes rufus 45PuertoLopez
47PuertoLopez
48PuertoLopez
41PuertoLopez
43PuertoLopez
38PuertoLopez
40PuertoLopez
5Caqueta
55SanMartin
44PuertoLopez
Ctenus nigritus 15Guaviare
16Guaviare
17Guaviare
18Guaviare
54SanMartin
46PuertoLopez
22Mitu
23Mitu
62A. rufus
66A. rufus
Spinoctenus escalerete 63A. rufus
67A. rufus
64A. rufus
65A. rufus
67A. rufus
French
99 Guayana KM225090
French Guayana KY017632
20 18 16 14 12 10 8 6 4 2 0 Ctenus nigritus
Spinoctenus escalerete
Time (Ma) 0.07
Figure 2. Phylogenetic trees and species delimitation results. A, multilocus species tree obtained in *BEAST. Numbers
above branches represent their posterior probabilities. Horizontal blue bars illustrate the 95% HPD for the nodes’ divergence
time. B, maximum likelihood consensus tree and species delimitation. Nodes with ultrafast bootstrap > 0.95 are marked with
purple squares. Bars in front of the tips indicate the results of both species delimitation methods. Light blue = individuals
from the eEC, light red = individuals from the wEC, green = A. rufus, yellow = A. bogotensis from GenBank.
© 2021 The Linnean Society of London, Biological Journal of the Linnean Society, 2021, XX, 1–14DIVERGENCE OF THE GIANT FISHING SPIDER 7
Table 1. Population genetics summary statistics for each genetic group. N: number of samples, Hd: haplotype diversity, π:
genetic diversity, SS: number of segregating sites, ϴ: population substitution rate
Statistic COI ITS
eEC wEC eEC wEC
Downloaded from https://academic.oup.com/biolinnean/advance-article/doi/10.1093/biolinnean/blaa220/6105041 by guest on 02 February 2021
N 26 19 25 24
Hd 0.815 0.977 0.762 0.917
π 0.00748 0.028 0.01504 0.0228
SS 24 65 18 24
Tajima’s D −1.27* −0.5* −0.8* −0.1*
Fu and Li’s D 0.91* −0.29* −0.73* −0.31*
Ramos-Onsins and Rozas’ R2 0.08* 0.11* 0.10* 0.13*
ϴ 0.011 0.032 0.018 0.023
*P > 0.05.
Figure 3. Spatial distribution of genetic diversity and population clustering. A, geographical barrier test (Monmonier’s
algorithm) with solid lines representing the main geographic barrier, and dotted lines being the Delaunay triangulation and
Voronoi tessellation. B, haplotype networks and population clustering BAPS for each locus; ticks or numbers on branches
represent mutational steps. The size of the circles represents the number of individuals with the same haplotype. Blue
haplotypes = individuals from eEC and red haplotypes = individuals from wEC. Squares delimiting groups denote the
results of BAPS.
among subpopulations within these regions or within Analysis of Population Structure (BAPS) recovered
subpopulations (Supporting Information, Table S3). three clusters that were congruent between loci
Regional clustering was not explained by the (Supporting Information, Fig. S8). The first genetic
pattern of isolation by distance (Supporting cluster grouped all individuals from the eEC, the
Information, Fig. S7; Table S4). Instead, support for a second was composed of individuals from the wEC,
genetic discontinuity was observed in both loci when and the last cluster contained all individuals from
exploring geographical boundaries in a matrix of Apartadó (Fig. 2). These genetic clusters agreed
genetic distances (i.e. Monmonier’s algorithm). This with the haplotype networks and reflected the
geographical break coincided with the EC, separating signal of population structure observed in pairwise
the populations on both sides of this mountain comparisons among populations (Supporting
(Fig. 3). The population assignment test Bayesian Information, Figs S5, S6).
© 2021 The Linnean Society of London, Biological Journal of the Linnean Society, 2021, XX, 1–148 F.C. SALGADO-ROA ET AL.
Demographic model testing the eEC and wEC observed in the phylogenetic trees
We observed that models with unidirectional or and networks (Figs 2, 3; Supporting Information, Figs
bidirectional gene flow were worse fitting than models S1–S4).
of divergence without gene flow (Fig. 4; Supporting
Information, Table S5), which also ruled out the
possibility of secondary contact. The best demographic Species delimitation
Downloaded from https://academic.oup.com/biolinnean/advance-article/doi/10.1093/biolinnean/blaa220/6105041 by guest on 02 February 2021
model agreed with the lack of shared variation between Both coalescent species delimitation methods were
concordant and revealed four lineages that could
Table 2. Population divergence between the two constitute different species (Fig. 2). The mPTP
geographical lineages. eEC: east of the Eastern Cordillera; delimitation was strongly supported (average support
wEC: west of the Eastern Cordillera. FST: fixation index
value [ASV] = 0.92 for mtDNA and 0.99 for nDNA), and
(Hudson et al., 1992), Dxy: average number of nucleotide
all MCMC chains converged on the same delimitation
substitutions per site between two subpopulations (Nei,
distributions (average standard deviation of
1987) and Da: net number of nucleotide substitutions per
delimitation support values [ASDDSV] < 0.001 for both
site between two subpopulations (Nei, 1987)
loci). Consistently, the highest posterior probabilities
Statistic COI ITS obtained in BPP supported four lineages (Supporting
Information, Table S6). The first was A. rufus, which
FST 0.66 0.68 was previously reported as a species different from
Dxy 0.053 0.058 A. bogotensis based on morphological traits (Hofer &
Da 0.035 0.039 Brescovit, 2000). The second included individuals from
the GenBank reported as A. bogotensis (Polotow et al.,
2015; Wheeler et al., 2017). Finally, the third and four
A B C lineages consisted of our samples of A. bogotensis on
wEC eEC wEC eEC wEC eEC both sides of the EC.
Species distribution modelling and niche
τ τ τ comparisons
The best species distribution model had a regularization
multiplier value of 1.5, and a combination of quadratic,
product and threshold features (mean AUC ratio = 1.06,
dAIC=0 dAIC=6.39 dAIC=6.41 omission rate = 0.06). This model highlighted areas
wAIC=0.94 wAIC=0.04 wAIC=0.04
with varying levels of suitability, with the highest
being in lowland wet ecosystems (Fig. 5A). Moreover,
D E F this model identified a strong break in the distribution
wEC eEC wEC eEC wEC eEC
of species in the Central and Eastern Cordilleras of
Colombia, which coincides with the separation of the
eEC and wEC lineages identified in the phylogenetic
and species delimitation analyses.
τ τ τ The D and I indices were 0.24 and 0.48, respectively,
indicating low to medium niche overlap between
the subpopulations at the wEC and eEC (Fig. 5B;
Table 3). However, the niche similarity test and niche
dAIC=9.79 dAIC=015.16 dAIC=15.17
equivalency test failed to reject the null hypothesis
wAIC=9E-3 wAIC=5E-4 wAIC=5E-4
of niche similarity and equivalency (P > 0.05 in all
cases; Table 3), suggesting that the genetic divergence
Figure 4. Demographic models used to test the evolution
between geographical subpopulations of A. bogotensis
of A. bogotensis with Phylogeographic Inference Using
is not due to niche divergence.
Approximate Likelihoods (PHRAPL). A, divergence with no
migration. B, divergence with unidirectional migration from
eEC to wEC. C, divergence with unidirectional migration from
wEC to eEC. D, divergence with bidirectional symmetrical
DISCUSSION
migration. E, divergence with bidirectional asymmetrical
migration from eEC to wEC. F, divergence with bidirectional Our findings are consistent with the hypothesis of
asymmetrical migration from wEC to eEC. Support values the Andes acting as an absolute barrier to dispersal
for the demographic scenarios are shown under each figure. for A. bogotensis, agreeing with previous findings
© 2021 The Linnean Society of London, Biological Journal of the Linnean Society, 2021, XX, 1–14DIVERGENCE OF THE GIANT FISHING SPIDER 9
A B
2
0
PC2(19.93%)
Downloaded from https://academic.oup.com/biolinnean/advance-article/doi/10.1093/biolinnean/blaa220/6105041 by guest on 02 February 2021
−2
−4
Suitability
0
0.25
−6
0.5
0.75
1.0
−10 −5 0 5
PC1(38.43%)
Figure 5. Species distribution models and niche overlap analysis. A, species distribution model for the entire distribution
range of A. bogotensis. B, PCA visualization of niche space occupied by eEC and wEC lineages. Line marks and fill squares
are the available environment in each range and occupied space by each lineage. eEC and wEC lineages and niche overlap
are indicated in green, red and blue colours, respectively.
Table 3. Niche equivalency and similarity test between these populations maintain gene flow (Chamberland
eEC and wEC. P-value D and P-value I represent the P et al., 2020). Thus, dispersal propensity could be a
values for D and I metrics, respectively predictor of cross-barrier levels of gene flow (Burney &
Brumfield, 2009; Claramunt et al., 2012).
Tests D I pD pI Because both lineages of A. bogotensis on opposite
sides of the EC share the same climatic niche, it is
Similarity test 1vs2 0.24 0.48 0.98 0.99
likely that the climate proper of the highlands impedes
Similarity test 2vs1 0.24 0.48 0.97 0.98
their survival, thus restricting their dispersal across
Equivalency test 0.24 0.48 0.90 0.89
this cordillera. Hence, niche conservatism may play a
role in allopatric differentiation in this giant fishing
spider. This is consistent with previous studies that
in vertebrates (Weir & Price, 2011; Guarnizo et al., emphasize the role of niche conservatism in promoting
2015). There are two genetically differentiated and divergence (Wiens & Graham, 2005), especially in
reciprocally monophyletic lineages of this spider that tropical species with a cross-Andean distribution
are separated by the EC, and in fact, this seems to be the (Cadena et al., 2012; Muñoz-Ortiz et al., 2015).
only cordillera that contributes to the diversification A common practice in phylogeography to
of this spider. The diversification of these geographical differentiate vicariance from dispersal is to compare
clades occurred during the Miocene/Pliocene boundary the divergence time between lineages with the origin
without any signal of gene flow or shared haplotypes. of a geological barrier. In our study, the estimated
This is likely because although climatic similarity divergence time between the two subpopulations of
and equivalency exist between the two lineages, A. bogotensis was around 3.85 Mya (95% HPD = 1.33–
A. bogotensis is not well suited to highland habitats, 7.49 Mya; Fig. 2; Table 4), which coincides with a
which may restrict its dispersal across the Andes. significant uplift of the EC that occurred between 6
These results contrast with previous research on and 3 Mya (Gregory-Wodzicki, 2000; Hooghiemstra
arachnids, in particular Gasteracantha cancriformis, et al., 2006; Hoorn et al., 2010). This suggests that a
that reports divergence with gene flow across the vicariance scenario could explain the divergence of the
EC (Salgado-Roa et al., 2018). This is probably due to giant fishing spider. However, some authors advocate
the differences in dispersal capacities between these that the EC had already undergone a significant
spiders. A. bogotensis has low or medium dispersal elevation by the Oligocene [40–25 Mya (Mora-Páez
capacity as it dwells in semiaquatic environments et al., 2016)] or middle Miocene [15–13 Mya (Montes
near riverine vegetation, has a large body, constructs a et al., 2019)], which precedes our estimated divergence
nursery web to protect spiderlings, and has no reports time, thus being more consistent with a dispersal
of ballooning behaviour (Bell et al., 2005; Piacentini & scenario. Because the uplift of the EC has been highly
Ramírez, 2019). In contrast, G. cancriformis potentially debated, it is not possible for us to unequivocally
has better dispersal capacity because it inhabits distinguish between these two models (i.e. vicariance
volcanic islands isolated from the continent, and yet vs. dispersal). A dispersal scenario would appear more
© 2021 The Linnean Society of London, Biological Journal of the Linnean Society, 2021, XX, 1–1410 F.C. SALGADO-ROA ET AL.
Table 4. Estimation of divergence times for the ACKNOWLEDGEMENTS
phylogenies of the species tree, COI and ITS2 calculated
in *BEAST. Mean dates and confidence intervals (95% This study was funded by the Universidad del Rosario
HPD) of the main nodes are presented in units of millions (grant “semilleros” 2018- IV-ACA008). We thank
of years Nicolas Hazzi for performing the SDM analysis
and providing valuable feedback on the manuscript
eEC-wEC A. rufus— Ancylometes and Nicolás Perez for his suggestions on geology
Downloaded from https://academic.oup.com/biolinnean/advance-article/doi/10.1093/biolinnean/blaa220/6105041 by guest on 02 February 2021
divergence Guayana diversification literature about the northern Andes uplift. This work
divergence was considerably improved by the comments and
suggestions of three anonymous reviewers. We also
Multilocus 3.85 4.19 (0.59,8.77) 10.82 thank the High-Performance Computing Service of the
species (1.33,7.49) (3.86,21.17) Universidad del Rosario (CENTAURO) where we ran
tree the demographic models and phylogenetic analyses.
COI tree 4.34 5.1 (1.90,9.69) 11.70 Finally, we are grateful to the Autoridad Nacional
(1.77,8.19) (4.82,22.05) de Licencias Ambientales (ANLA) in Colombia for
ITS2 tree 8.46 7.07 (1.8,14.57) 14.95
granting the collection permit #530. The authors
(2.98,16.36) (5.21,29.67)
declare that there is no conflict of interest regarding
the publication of this article.
plausible, because A. bogotensis is the only species of
Ancylometes that occurs west of the Andes and the
species richness of this genus is concentrated in the REFERENCES
Amazon region (Hofer & Brescovit, 2000). Therefore,
a larger sampling of A. bogotensis and a phylogenetic Agnarsson I. 2010. The utility of ITS2 in spider phylogenetics:
notes on prior work and an example from Anelosimus. The
reconstruction that includes all the species of
Journal of Arachnology 38: 377–382.
Ancylometes are required to assess the demographical
Agnarsson I, LeQuier SM, Kuntner M, Cheng RC,
and biogeographical hypotheses. Such sampling would
Coddington JA, Binford G. 2016. Phylogeography of
also contribute toward clarifying whether A. bogotensis
a good Caribbean disperser: Argiope argentata (Araneae:
from Apartadó is genetically differentiated from the
Araneidae) and a new ‘cryptic’ species from Cuba. ZooKeys
other wEC individuals. 2016: 25–44.
Our species delimitation analyses suggest that the Agnarsson I, Van Patten C, Sargeant L, Chomitz B,
two lineages of A. bogotensis could constitute different Dziki A, Binford GJ. 2018. A radiation of the ornate
species. The extent of genetic differentiation between Caribbean “smiley-faced spiders”, with descriptions of 15
these clades is even higher than that of other spiders new species (Araneae: Theridiidae, Spintharus). Zoological
recognized as species (Agnarsson et al., 2016, 2018). Journal of the Linnean Society 182: 758–790.
However, due to the absence of other lines of evidence Arias CF, Salazar C, Rosales C, Kronforst MR, Linares M,
such as behaviour, morphology and reproductive Bermingham E, McMillan WO. 2014. Phylogeography of
isolation, it is not possible to confidently confirm that Heliconius cydno and its closest relatives: disentangling their
the two lineages of A. bogotensis constitute different origin and diversification. Molecular Ecology 23: 4137–4152.
species. Furthermore, species delimitation methods Bacon CD, Velásquez-Puentes FJ, Hoorn C, Antonelli A.
are susceptible to bias by population structure, and 2018. Iriarteeae palms tracked the uplift of Andean
their results need to be interpreted with caution cordilleras. Journal of Biogeography 45: 1653–1663.
(Sukumaran & Knowles, 2017). Bartoleti LFDM, Peres EA, Fontes FVHM, da Silva MJ,
I n s u m m a r y, o u r r e s e a r c h h a s u n c o v e r e d Solferini VN. 2018. Phylogeography of the widespread
the existence of two genetically differentiated spider Nephila clavipes (Araneae: Araneidae) in South
subpopulations of A. bogotensis that are separated America indicates geologically and climatically driven lineage
diversification. Journal of Biogeography 45: 1246–1260.
by the EC. Their divergence occurred without the
Barve N, Barve V, Jiménez-Valverde A, Lira-Noriega A,
signals of gene flow, suggesting that the Andes act as
Maher SP, Peterson AT, Soberon J, Villalobos F. 2011.
an absolute barrier. This study is one of the few that
The crucial role of the accessible area in ecological niche
evaluated the effect of climate and the Andean uplift in
modeling and species distribution modeling. Ecological
promoting diversification in an arachnid lineage. More
Modelling 222: 1810–1819.
research is required on other arthropods with varying Bell JR, Bohan DA, Shaw EM, Weyman GS. 2005.
dispersal abilities and different life history traits to Ballooning dispersal using silk: world fauna, phylogenies,
gain a comprehensive understanding of how orogeny genetics and models. Bulletin of Entomological Research 95:
has shaped the biodiversity of the tropical Americas. 69–114.
© 2021 The Linnean Society of London, Biological Journal of the Linnean Society, 2021, XX, 1–14DIVERGENCE OF THE GIANT FISHING SPIDER 11
Bhukal R, Rutherford MG, Mohammed RS. 2015. Predation Claramunt S, Derryberry EP, Remsen JV Jr,
on a freshwater crab, Dilocarcinus dentatus (Tricodactylidae), Brumfield RT. 2012. High dispersal ability inhibits
by several tropical wolf spiders, Ancylometes bogotensis speciation in a continental radiation of passerine birds.
(Ctenidae), in Trinidad, W.I . Living World, Journal of The Proceedings. Biological sciences 279: 1567–1574.
Trinidad and Tobago Field Naturalists’ Club 2015: 59–60. Cobos ME, Peterson AT, Barve N, Osorio-Olvera L. 2019.
Bidegaray-Batista L, Arnedo MA. 2011. Gone with the plate: kuenm: an R package for detailed development of ecological
the opening of the western Mediterranean basin drove the niche models using Maxent. PeerJ 7: e6281.
Downloaded from https://academic.oup.com/biolinnean/advance-article/doi/10.1093/biolinnean/blaa220/6105041 by guest on 02 February 2021
diversification of ground-dweller spiders. BMC Evolutionary Corander J, Marttinen P, Sirén J, Tang J. 2008. Enhanced
Biology 11: 317. Bayesian modelling in BAPS software for learning genetic
Bouckaert R, Vaughan TG, Barido-Sottani J, Duchêne S, structures of populations. BMC Bioinformatics 9: 539.
Fourment M, Gavryushkina A, Heled J, Jones G, Di Cola V, Broennimann O, Petitpierre B, Breiner FT,
Kühnert D, De Maio N, Matschiner M, Mendes FK, D’Amen M, Randin C, Engler R, Pottier J, Pio D,
Müller NF, Ogilvie HA, du Plessis L, Popinga A, Rambaut A, Dubuis A, Pellissier L, Mateo RG, Hordijk W, Salamin N,
Rasmussen D, Siveroni I, Suchard MA, Wu CH, Xie D, Guisan A. 2017. ecospat: an R package to support spatial
Zhang C, Stadler T, Drummond AJ. 2019. BEAST 2.5: An analyses and modeling of species niches and distributions.
advanced software platform for Bayesian evolutionary analysis. Ecography 40: 774–787.
PLoS Computational Biology 15: e1006650. Dick CW, Roubik DW, Gruber KF, Bermingham E. 2004.
B r oenni m ann O , Fit z pat r ick MC , Pear ma n P B , Long-distance gene flow and cross-Andean dispersal of
Petitpierre B, Pellissier L, Yoccoz NG, Thuiller W, lowland rainforest bees (Apidae: Euglossini) revealed by
Fortin MJ, Randin CR, Zimmermann NE, Graham CH, comparative mitochondrial DNA phylogeography. Molecular
Guisan A. 2012. Measuring ecological niche overlap from Ecology 13: 3775–3785.
occurrence and spatial environmental data. Global Ecology Diniz-Filho JAF, Soares TN, Lima JS, Dobrovolski R,
and Biogeography 21: 481–497. Landeiro VL, Pires M, Rangel TF, Bini LM. 2013. Mantel
Burney CW, Brumfield RT. 2009. Ecology predicts levels of test in population genetics. Genetics and Molecular Biology
genetic differentiation in Neotropical birds. The American 36: 475–485.
Naturalist 174: 358–368. Dixon P. 2003. VEGAN, a package of R functions for community
Cadena CD, Kozak KH, Gómez JP, Parra JL, McCain CM, ecology. Journal of Vegetation Science 14: 927–930.
Bowie RC, Carnaval AC, Moritz C, Rahbek C, Drummond AJ, Suchard MA, Xie D, Rambaut A. 2012.
Roberts TE, Sanders NJ, Schneider CJ, VanDerWal J, Bayesian phylogenetics with BEAUti and the BEAST 1.7.
Zamudio KR, Graham CH. 2012. Latitude, elevational Molecular Biology and Evolution 29: 1969–1973.
climatic zonation and speciation in New World vertebrates. Edgar RC. 2004. MUSCLE: multiple sequence alignment with
Proceedings. Biological Sciences 279: 194–201. high accuracy and high throughput. Nucleic Acids Research
Cadena CD, Pedraza CA, Brumfield RT. 2016. Climate, 32: 1792–1797.
habitat associations and the potential distributions of Elith J, Phillips SJ, Hastie T, Dudík M, Chee YE, Yates CJ.
Neotropical birds: implications for diversification across 2011. A statistical explanation of MaxEnt for ecologists.
the Andes. Revista de La Academia Colombiana de Ciencias Diversity and Distributions 17: 43–57.
Exactas, Físicas y Naturales 40: 275–287. Excoffier L, Lischer HE. 2010. Arlequin suite ver 3.5: a new
Caicedo-Garzón V, Salgado-Roa FC, Sánchez- series of programs to perform population genetics analyses
Herrera M, Hernández C, Arias-Giraldo LM, García L, under Linux and Windows. Molecular Ecology Resources 10:
Vallejo G, Cantillo O, Tovar C, Aristeu da Rosa J, 564–567.
Carrasco HJ, Segovia M, Salazar C, Ramírez JD. Fick SE, Hijmans RJ. 2017. WorldClim 2: new 1-km
2019. Genetic diversification of Panstrongylus geniculatus spatial resolution climate surfaces for global land areas.
(Reduviidae: Triatominae) in northern South America. International Journal of Climatology 37: 4302–4315.
PLoS One 14: 1–18. Folmer O, Black M, Hoeh W, Lutz R, Vrijenhoek R. 1994.
Carstens BC, Pelletier TA, Reid NM, Satler JD. 2013. DNA primers for amplification of mitochondrial cytochrome
How to fail at species delimitation. Molecular Ecology 22: c oxidase subunit I from diverse metazoan invertebrates.
4369–4383. Molecular Marine Biology and Biotechnology 3: 294–299.
Chamberland L, Salgado-Roa FC, Basco A, Crastz- Fu YX, Li WH. 1993. Statistical tests of neutrality of mutations.
Flores A, Binford GJ, Agnarsson I. 2020. Phylogeography Genetics 133: 693–709.
of the widespread Caribbean spiny orb weaver Gasteracantha Gadagkar SR, Rosenberg MS, Kumar S. 2005. Inferring
cancriformis. PeerJ 8: e8976. species phylogenies from multiple genes: concatenated
Chapman FM. 1917. The distribution of bird-life in Colombia: a sequence tree versus consensus gene tree. Journal of
contribution to a biological survey of South America. Bulletin Experimental Zoology. Part B, Molecular and Developmental
of the American Museum of Natural History 3: 1–659. Evolution 304: 64–74.
Chapman FM. 1926. The distribution of bird-life in Ecuador: Gregory-Wodzicki KM. 2000. Uplift history of the central
a contribution to a study of the origin of Andean bird-life. and northern Andes: a review. Geological Society of America
Bulletin of the American Museum of Natural History 55: 784. Bulletin 112: 1091–1105.
© 2021 The Linnean Society of London, Biological Journal of the Linnean Society, 2021, XX, 1–1412 F.C. SALGADO-ROA ET AL.
Guarnizo CE, Paz A, Muñoz-Ortiz A, Flechas SV, Méndez- Lapinski W, Walther P, Tschapka M. 2015. Morphology
Narváez J, Crawford AJ. 2015. DNA barcoding survey of reflects microhabitat preferences in an assemblage of
anurans across the Eastern Cordillera of Colombia and the Neotropical wandering spiders. Zoomorphology 134: 219–236.
impact of the Andes on cryptic diversity. PLoS One 10: e0127312. Leigh JW, Bryant D, Nakagawa S. 2015. PopArt: full-feature
Haffer J. 1974. Avian speciation in tropical South America software for haplotype network construction. Methods in
with a systematic survey of the toucans (Ramphastidae) Ecology and Evolution 6: 1110–1116.
and the jacamars (Galbulidae). Cambridge, Massachusetts: Librado P, Rozas J. 2009. DnaSP v5: a software for
Downloaded from https://academic.oup.com/biolinnean/advance-article/doi/10.1093/biolinnean/blaa220/6105041 by guest on 02 February 2021
Nuttall Ornithological Club. comprehensive analysis of DNA polymorphism data.
Hazzi NA, Valderrama-Ardila C, Brescovit AD, Polotow D, Bioinformatics 25: 1451–1452.
Simó M. 2013. New records and geographical distribution Maddison W, Maddison D. 2015. Mesquite: a modular system
of ctenid spiders (Araneae: Ctenidae) in Colombia. Zootaxa for evolutionary analysis, version 3.04. Available at: http://
3709: 243–254. mesquiteproject. org/mesquite/download/download.html
Hijmans RJ. 2016. geosphere: spherical trigonometry. R Manni F, Guérard E, Heyer E. 2004. Geographic patterns of
package version 1.5-10. Available at: https://CRAN.R-project. (genetic, morphologic, linguistic) variation: how barriers can
org/package=geosphere be detected by using Monmonier’s algorithm. Human Biology
Hofer H, Brescovit AD. 2000. A revision of the Neotropical 76: 173–190.
spider genus Ancylometes Bertkau (Araneae: Pisauridae). Mantel N. 1967. The detection of disease clustering and
Insect Systematics & Evolution 31: 323–360. a generalized regression approach. Cancer Research 27:
Hooghiemstra H, Wijninga VM, Cleef AM. 2006. The 209–220.
paleobotanical record of Colombia: implications for McHugh A, Yablonsky C, Binford GJ, Agnarsson I. 2014.
biogeography and biodiversity. Annals of the Missouri Molecular phylogenetics of Caribbean Micrathena (Araneae:
Botanical Garden 93: 297–325. Araneidae) suggests multiple colonization events and single
Hoorn C, Wesselingh FP, ter Steege H, Bermudez MA, island endemism. Invertebrate Systematics 2012: 337–349.
Mora A, Sevink J, Sanmartín I, Sanchez-Meseguer A, Miller MJ, Bermingham E, Klicka J, Escalante P,
Anderson CL, Figueiredo JP, Jaramillo C, Riff D, do Amaral FS, Weir JT, Winker K. 2008. Out of Amazonia
Negri FR, Hooghiemstra H, Lundberg J, Stadler T, again and again: episodic crossing of the Andes promotes
Särkinen T, Antonelli A. 2010. Amazonia through time: diversification in a lowland forest flycatcher. Proceedings.
Andean uplift, climate change, landscape evolution, and Biological Sciences 275: 1133–1142.
biodiversity. Science 330: 927–931. Minh BQ, Schmidt HA, Chernomor O, Schrempf D,
Hudson RR, Boos DD, Kaplan NL. 1992. A statistical test Woodhams MD, von Haeseler A, Lanfear R. 2020.
for detecting geographic subdivision. Molecular Biology and IQ-TREE 2: new models and efficient methods for
Evolution 9: 138–151. phylogenetic inference in the genomic era. Molecular Biology
Hudson RR, Slatkin M, Maddison WP. 1992. Estimation of and Evolution 37: 1530–1534.
levels of gene flow from DNA sequence data. Genetics 132: Montes C, Rodriguez-Corcho AF, Bayona G, Hoyos N,
583–589. Zapata S, Cardona A. 2019. Continental margin
Jackson ND, Morales AE, Carstens BC, O’Meara BC. 2017. response to multiple arc-continent collisions: the northern
PHRAPL: phylogeographic inference using approximate Andes-Caribbean margin. Earth-Science Reviews 198:
likelihoods. Systematic Biology 19: 431–435. 102903.
Janzen DH. 1967. Why mountain passes are higher in the Mora-Páez H, Mencin DJ, Molnar P, Diederix H, Cardona-
tropics. The American Naturalist 101: 233–249. Piedrahita L, Peláez-Gaviria J-R, Corchuelo-Cuervo Y.
Jombart T, Ahmed I. 2011. adegenet 1.3-1: new tools for 2016. GPS velocities and the construction of the Eastern
the analysis of genome-wide SNP data. Bioinformatics 27: Cordillera of the Colombian Andes. Geophysical Research
3070–3071. Letters 43: 8407–8416.
Kalyaanamoorthy S, Minh BQ, Wong TKF, von Haeseler A, Morrone JJ. 2014. Biogeographical regionalisation of the
Jermiin LS. 2017. ModelFinder: fast model selection for Neotropical region. Zootaxa 3782: 1–110.
accurate phylogenetic estimates. Nature Methods 14: 587–589. Muñoz-Ortiz A, Velásquez-Álvarez ÁA, Guarnizo CE,
Kapli P, Lutteropp S, Zhang J, Kobert K, Pavlidis P, Crawford AJ. 2015. Of peaks and valleys: testing the
Stamatakis A, Flouri T. 2017. Multi-rate Poisson tree roles of orogeny and habitat heterogeneity in driving
processes for single-locus species delimitation under allopatry in mid-elevation frogs (Aromobatidae:
maximum likelihood and Markov Chain Monte Carlo. R h e o b a t e s ) o f t h e n o r t h e r n A n d e s. Jo u r n a l o f
Bioinformatics 33: btx025. Biogeography 42: 193–205.
Kumar S, Stecher G, Li M, Knyaz C, Tamura K. 2018. Nei M. 1987. Molecular evolutionary genetics. NY, USA:
MEGA X: molecular evolutionary genetics analysis across Columbia University Press.
computing platforms. Molecular Biology and Evolution 35: Ochoa D, Hoorn C, Jaramillo C, Bayona G, Parra M,
1547–1549. Parra FDe. 2012. The final phase of tropical lowland
Lapinski W, Tschapka M. 2013. Habitat use in an conditions in the axial zone of the Eastern Cordillera of
assemblage of Central American wandering spiders. Journal Colombia: evidence from three palynological records. Journal
of Arachnology 41: 151–159. of South American Earth Sciences 39: 157–169.
© 2021 The Linnean Society of London, Biological Journal of the Linnean Society, 2021, XX, 1–14You can also read