Do Not Fall for the Hype on U.S.-China Natural Gas Trade - By Melanie Hart, Luke Bassett, and Blaine Johnson April 2018
←
→
Page content transcription
If your browser does not render page correctly, please read the page content below
GETTY IMAGES/VCG

                   Do Not Fall for the Hype on
                   U.S.-China Natural Gas Trade
                   By Melanie Hart, Luke Bassett, and Blaine Johnson   April 2018

                                                                                    W W W.AMERICANPROGRESS.ORG
Do Not Fall for the Hype on U.S.-China Natural Gas Trade By Melanie Hart, Luke Bassett, and Blaine Johnson April 2018
Contents    1 Introduction and summary

            3 Beijing is currently leveraging natural
              gas imports to fill a reform gap

            8 China already has 26 supplier nations, and
              U.S. shipments are more expensive than most

           11 The United States has a geographical disadvantage
              exporting to China

           15 The Trump administration is pushing investment
              deals that ignore current market trends

           20 Trump administration’s natural gas export obsession
              risks forfeiting a much bigger game

           24 Conclusion

           25 About the authors

           26 Appendix A: U.S. LNG export shipments to China
              as of year-end 2017

           29 Appendix B: China’s natural gas reform timeline

           35 Endnotes
Introduction and summary The Trump administration frequently pushes natural gas exports in high-level talks with Beijing. Most recently, after threatening to impose tariffs on Chinese technology imports, some administration officials are stating that the tariffs can be reduced if China buys more U.S. natural gas.1 The Trump administration is pitching a very simple argument: If China imports more natural gas from the United States, that will help rebalance the U.S.-China trade deficit—which rose to a record $375.2 billion during President Donald Trump’s first year in office—and generate American jobs.2 In reality, that argument reflects a deep misunderstand- ing about how today’s global energy markets actually work. At first glance, the United States and China do have good synergies in this sec- tor. China is consuming more natural gas than it can produce and seeking new imports; the United States is the world’s largest producer, and the Trump admin- istration wants to send more of that production overseas. Trump routinely uses his meetings with President Xi Jinping and other Asian leaders to push natural gas export deals. That push played a role in preliminary U.S.-China deals inked last November and is generating excitement on both sides of the Pacific about a poten- tial U.S.-China natural gas trade boom. Behind the hype, however, market realities suggest this will not pan out as promised. This report covers the following five factors that American observers need to under- stand about the Trump administration’s push to export U.S. natural gas to China: 1. Beijing is currently leveraging natural gas imports to fill a reform gap: Demand- side reforms have thus far been more successful than the supply-side. If Chinese leaders can push forward needed reforms on the supply side, the nation’s import dependence may decrease. 2. China already has 26 supplier nations, and the shipments it receives from the United States are more expensive than 83 percent of its import supply chain.3 1 Center for American Progress | Do Not Fall for the Hype on U.S.-China Natural Gas Trade
3. The United States has a geographical disadvantage exporting to China and is
   better placed to serve other growing markets.

4. The Trump administration is pushing U.S.-China natural gas investment deals
   that ignore current market trends.

5. The Trump administration’s fossil fuel obsession risks forfeiting a much bigger
   strategic game in clean energy technology.

Chinese President Xi has big ambitions. His vision for an ideal future U.S.-China
economic relationship is one in which the United States exports commodities to
China while China steadily edges the United States out as the dominant player
in global high-tech markets, including clean energy markets. In that scenario,
the United States gets the lower end of the value chain and China dominates the
higher end, thus winning the best jobs. Chinese leaders know that, globally, the
world is already installing more new renewable energy generation capacity than
new fossil fuel-based capacity.4 Even major oil and gas exporters such as Saudi
Arabia and the United Arab Emirates are investing billions in renewables—they
see where the market is headed and do not want to be left behind. Chinese lead-
ers view clean energy as a major battlefield in their nation’s quest to surpass the
United States as the new high-tech superpower, and entertaining the Trump
administration’s fossil fuel export initiatives is a useful tactic for keeping the
United States occupied on the sidelines while China runs the field.

There is little question that China’s rising natural gas consumption is an exciting
trend. If Beijing leverages natural gas to replace coal and reduce the nation’s overall
fossil fuel emissions—neither of which is guaranteed—that could be good for
the planet. However, this trend is unlikely to generate game-changing jobs for the
United States, and the Trump administration’s determination to promote fossil
fuel exports at any cost undermines broader U.S. economic interests. If the admin-
istration accepts natural gas export promises from China in exchange for backing
off from much broader U.S. trade complaints—as U.S. Secretary of Commerce
Wilbur Ross is suggesting—that will undercut the U.S. economy even further.

Understanding these dynamics is critical for assessing what the current administra-
tion’s U.S.-China natural gas initiatives are likely to produce over the longer term.

2   Center for American Progress | Do Not Fall for the Hype on U.S.-China Natural Gas Trade
Beijing is currently leveraging
natural gas imports to fill
a reform gap

Demand-side reforms have thus far been more successful
than the supply-side

China is a major natural gas producer and consumer. For decades, Beijing controlled
pricing and activity on both sides of the market—production and consumption—
and those controls hindered natural gas development in China. Natural gas currently
accounts for just 7 percent of China’s total energy consumption compared with 29.2
percent in the United States, 23.7 percent in Germany, and 22.5 percent in Japan.5
Over the past five years, Chinese leaders have rolled out a series of policy reforms
designed to relax the old controls, create more room for market competition, and
encourage more production and consumption.

Those reforms have been particularly successful on the consumption side. Beijing
is aiming for natural gas to account for 10 percent of the nation’s energy mix by
2020—up from 7 percent at year-end 2017—and 15 percent by 2030.6 To make
that happen, Beijing is rolling out an array of environmental policies that provide
new incentives—and in some cases mandatory requirements—for switching
to natural gas as a substitute for more emission-intensive fossil fuels. That effort
began with the 2013 Air Pollution Control Action Plan, which required major
urban areas along China’s eastern seaboard to reduce their overall coal consump-
tion, close down coal-fired industrial boilers and power plants, and bring in
natural gas and renewables as substitutes by 2017.7 That 2017 deadline, however,
triggered major natural gas supply shortages last fall as some city planners—anx-
ious to meet their 2017 deadlines—shut down coal-fired power before they had
substitutes in place to cover winter heating needs.8

In addition, Chinese leaders are also rolling out policies to encourage natural gas
use for transport. Transport emissions account for around 25 percent of air pol-
lution in China, and Beijing views switching to natural gas vehicles—both liquid
and compressed natural gas—as a key lever for reducing pollution.9 China had

3   Center for American Progress | Do Not Fall for the Hype on U.S.-China Natural Gas Trade
more than 5 million natural gas vehicles in 2017—accounting for more than 20
percent of the global total—and Beijing is pushing to double that to 10 million by
2020.10 To meet that target, local governments across China are providing con-
sumers with a variety of subsidies for natural gas fuel and vehicle purchases.11

These demand-side policies are having an impact. Between 2013—when Beijing
first launched the Clean Air Action Plan—and 2017, China’s total natural gas
consumption grew 41 percent, averaging roughly 9 percent growth per year.12
As consumption rises, Beijing is also rolling out three major supply-side
reforms to drive domestic production—China has both onshore and offshore
reserves—and imports.

First and foremost, Chinese leaders are taking steps to liberalize natural gas pric-
ing. The first big shift occurred in July 2013, when Beijing rolled out a new pricing
model for industrial-use gas that linked city-gate prices—or municipal-level
distribution prices—to international market rates for fuel oil and liquid petroleum
gas.13 Central planners used those international rates to set price ceilings and then
allowed buyers and sellers in China to negotiate up to that ceiling. Beijing then
took an even bolder step with unconventional gas, which is generally more expen-
sive to develop in China. Starting in the second half of 2013, Beijing fully liberal-
ized pricing for shale gas, coal bed methane, coal-to-gas, and imported liquefied
natural gas (LNG)—suppliers in those sectors could charge whatever buyers were
willing to pay.14 Over time, Beijing has also gradually broadened the band in which
conventional natural gas prices could fluctuate, allowing more room for buyers
and sellers to negotiate prices based on supply and demand.15

    China’s old natural gas price regime
    Prior to the recent price reforms, government planners controlled prices at every step in
    China’s natural gas value chain. Beijing dictated the ex-factory or production price on the
    upstream side, city-gate or city-level distribution prices on the downstream side, and at
    every other point natural gas changed hands. Beijing’s primary goal was to keep natural
    gas affordable for end users, so prices varied by location and end use depending on
    what Beijing thought local people could pay. Producers could not charge higher prices
    during supply shortages and thus had no incentive to invest in additional exploration
    and development. Shortages were a persistent problem, and domestic production was
    particularly sluggish in unconventional gas plays—such as shale gas—that require
    significant upfront costs to get around unique technical challenges in China.16

4    Center for American Progress | Do Not Fall for the Hype on U.S.-China Natural Gas Trade
Price reform is still a work in progress, but these measures are already having an impact. Before the reforms commenced, China’s city-gate prices were well below international rates.17 That was a serious problem for China’s oil and gas majors who were signing import contracts with foreign suppliers and, due to the price spread between international and domestic rates, selling the imported gas at a loss in China. In 2012, PetroChina lost $6.7 billion importing natural gas into the country and selling it at state-controlled rates.18 In 2013, PetroChina’s losses increased to $7.9 billion—including a $4.6 billion loss on pipeline imports from Central Asia, a $67 million loss on pipeline imports from Myanmar, and more than $3.2 billion in losses on imported liquefied natural gas.19 Those losses declined when Beijing implemented the price reforms and domestic prices began to more closely track international rates.20 On the consumer side, however, the initial reform-induced price increases dampened consumption, and that created an entirely different headache for Chinese leaders given their goal to expand natural gas use.21 Since 2014, a steady decline in global oil and gas prices has made it possible for Beijing to liberalize pricing while also maintaining affordability for end users.22 If global prices trend in the opposite direction, that will make things difficult for Beijing, but that is unlikely given that the global natural gas market appears to be entering a period of oversupply.23 Second, in addition to price reform, Beijing also opened up liquefied natural gas imports for private sector participation. China’s state-owned enterprises have a monopoly on pipeline imports and domestic production—they dominate the best gas plays—but private enterprises can now enter the upstream market via LNG. If those imports entailed the kind of multibillion-dollar losses PetroChina suffered in 2013, there would be few takers; however, from 2014 onward, the combination of declining global LNG prices and an increasingly liberalized domestic pricing regime made the LNG import business a more favorable proposition. From 2014 to 2016, China’s average LNG import price fell from an all-time high of $12.64 per thousand cubic feet to $7.05 per thousand cubic feet; in 2017, prices ticked up 12 percent to $7.91 per thousand cubic feet but remain much lower than previous years.24 Private companies have two options for market entry: utilize existing terminals or build their own. Beijing’s 13th Five- Year Energy Development Plan, issued in 2013, encouraged private companies to invest in the natural gas sector, with one private company even permitted to con- struct and operate its own import terminal beginning in 2012.25 In 2014, Beijing ordered the nation’s state-owned oil and gas majors to grant private companies access to their unused import terminal capacity so that more private companies 5 Center for American Progress | Do Not Fall for the Hype on U.S.-China Natural Gas Trade
could take advantage of falling global LNG prices.26 Back in 2012, China had
just six import terminals across six ports with a total import capacity of less than
3 billion cubic feet per day (Bcf/d); by year-end 2017, China had 17 terminals
across 14 ports with a total 7.4 Bcf/d of capacity.27

Third, Beijing is taking steps to gradually relax state-owned enterprise control
over domestic production. If Chinese leaders can break open their nation’s
upstream sectors, that will be the real game-changer. The U.S. Energy Information
Administration estimates that China may have as much or more shale gas than
the United States, but development has been sluggish.28 Overall, China’s annual
domestic production growth has decelerated from more than 19 percent in 2005
to less than 12 percent in 2010 and just over 2 percent in 2015.29 Chinese lead-
ers are hoping to turn that trend around. Beijing’s 13th Five-Year Plan for Natural
Gas Development targets 7.3 trillion cubic feet of production by 2020, up from
4.8 trillion in 2015.30 In 2016, year-on-year growth in China’s reported domestic
production bounced back to just more than 5 percent.31 In the United States,
private sector competition played a key role in driving some of the technology and
process innovations that unlocked shale gas development.32 For that to happen in
China, Beijing will have to break down an array of market barriers that currently
stifle competition in the nation’s upstream sectors. For example, state-owned com-
panies control the best oil and gas plays and, in some cases, sit on them without
either developing them or allowing other companies to do so. China’s geological
data is classified, so private companies and investors have no idea how much natu-
ral gas the country has or where it is located. Plus, state-owned companies control
the pipelines and often either deny pipeline access to private companies or charge
exorbitant rates, thus making it hard to bring those extra supplies to market.

Beijing is taking steps to address these problems, but progress has been slow, so
they are currently relying on imports to meet the nation’s rising demand.33 Going
forward, however, if Chinese leaders get serious about supply-side reform, the
next unconventional gas revolution could occur in China. As of 2017, China is
already the third-largest global shale gas producer behind the United States and
Canada.34 Natural gas exporters should take China’s production potential into
account—and Beijing’s growing determination to unlock that potential—when
making investments that hinge on a continued rise in Chinese import demand.

6   Center for American Progress | Do Not Fall for the Hype on U.S.-China Natural Gas Trade
FIGURE 1
China's natural gas imports, production, and consumption
Reported in billion cubic feet (Bcf), 2007-2017
Domestic production LNG imports Pipeline imports Consumption
10,000
8,000
6,000
4,000
2,000
0
2007 2008 2009 2010 2011 2012 2013 2014 2015 2016 2017
Sources: Based upon data reported by the National Bureau of Statistics of China, available at http://data.stats.gov.cn/easyquery.
htm?cn=C01 (last accessed April 2018) and data from Global Trade Tracker, available for subscribers at www.globaltradetracker.com.
2017 production and consumption data can be found at National Development and Reform Commission, "2017 nian tian ran qi yun
xing jian kuang (2017 Natural Gas Operation Profile)," (2018), available at http://www.ndrc.gov.cn/fzgggz/jjyx/mtzhgl/201801/
t20180131_876398.html. Conversion factors are based on The National Academies of Sciences, Engineering and Medicine, "Energy
Conversion Factors," available at https://www.nap.edu/read/9736/chapter/8 (last accessed April 2018) and Iowa State University,
"Natural Gas and Coal Measurements and Conversions," available at https://www.extension.iastate.edu/agdm/wholefarm/html/
c6-89.html (last accessed April 2018).
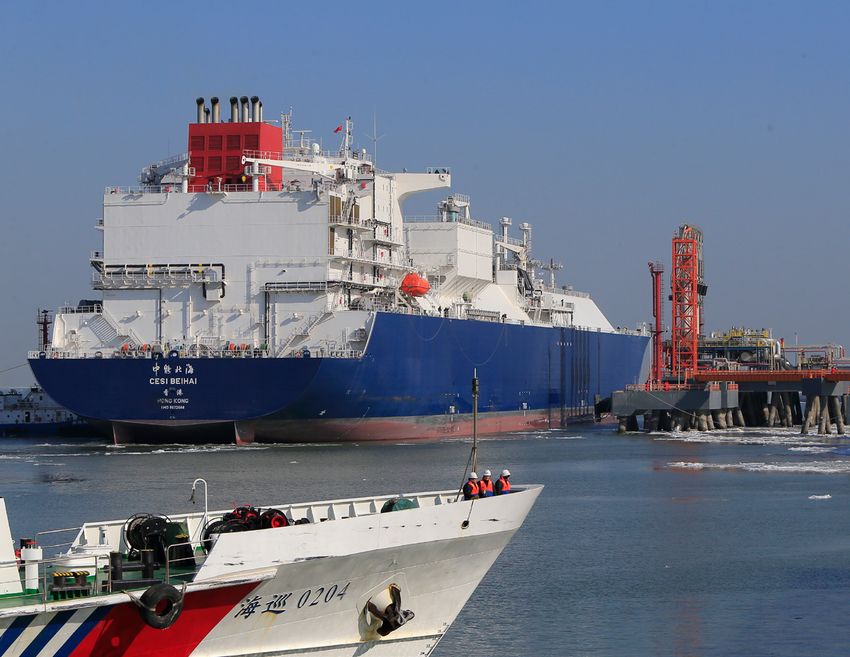
7 Center for American Progress | Do Not Fall for the Hype on U.S.-China Natural Gas TradeChina already has 26 supplier nations, and U.S. shipments are more expensive than most China has been a net natural gas importer since 2007, and the gap between domestic production and consumption has grown steadily since then. China imports natural gas via a combination of overland pipelines and seaborne tank- ers.35 In 2017, 55.7 percent of China’s natural gas imports by volume came in via LNG tanker and 44.3 percent via overland pipeline.36 On the seaborne LNG side, China’s first imports came from Australia in 2006.37 In the late 2000s and early 2010s, smaller suppliers—including Algeria, Yemen, and Nigeria—also shipped LNG to China, but as of 2017, only Australia, Qatar, Malaysia, Indonesia, Papua New Guinea, and the United States occupy China LNG import market shares above 3 percent. The United States did not join China’s LNG supply chain in earnest until 2016. U.S.-to-China year-on-year LNG exports grew 217 percent in 2016 and 670 percent in 2017, at which point the United States edged out Nigeria to become China’s sixth largest LNG supplier. Australia has retained its position as China’s top LNG supplier by volume, except for the period from 2012-2015 when a bump in Qatari exports overtook Australia’s.38 On the pipeline side, China borders multiple onshore natural gas supply regions, and the nation’s state-owned energy companies have invested billions of dollars to bring in natural gas via overland pipeline.39 China generally pays less for pipeline gas than it does for seaborne LNG. For example, in 2017 China paid an average US$5.75 per thousand cubic feet for pipeline gas and an average US$7.91 per thousand cubic feet for seaborne LNG.40 Currently, China’s biggest pipeline supply route is from Turkmenistan, which supplied 80.5 percent of China’s piped natural gas imports in 2017. The rest of China’s pipeline natural gas imports come from Uzbekistan (8.5 percent), Myanmar (8.3 percent), and Kazakhstan (2.7 percent).41 Once the Myanmar and Kazakhstan pipelines came online in 2013, pipeline gas surpassed LNG as China’s primary import source but that reversed again in 2017, following Turkmenistan pipeline supply problems and a dip in global prices that narrowed the price gap between LNG and pipeline gas and thus made seaborne 8 Center for American Progress | Do Not Fall for the Hype on U.S.-China Natural Gas Trade
LNG more economical for Chinese buyers.42 China’s first pipeline from Russia is
                scheduled to come online in December 2019; once that pipeline is flowing, Russia is
                expected to become China’s top overland supplier, bumping Turkmenistan from the
                number one spot.43

                Overall, in 2017, China imported 3.35 trillion cubic feet of natural gas—of which
                1.48 trillion cubic feet came in via pipeline and 1.87 trillion cubic feet as LNG—
                making China the world’s second-largest natural gas importer, behind Japan.44 In
                2017, China’s top five natural gas suppliers by volume—pipeline gas and LNG
                combined—were Turkmenistan (accounting for 36 percent of total imports),
                Australia (25 percent), Qatar (11 percent), Malaysia (6 percent), and Indonesia
                (4 percent). Beijing wants the nation’s supply mix to prioritize diversity—import-
                ing from multiple nations across a variety of transport routes and contract struc-
                tures—and affordability.45 A diverse mix of suppliers and transport routes serves
                as a hedge against supply shocks and also provides multiple ports of entry to chan-
                nel natural gas into different Chinese regional markets.46 When China first became
                a net importer in 2007, it received shipments from just four nations; today, 26
                nations supply natural gas to China.47

FIGURE 2
China's top 10 natural gas suppliers by volume, 2017
Exports of natural gas to China by supplier country

                      Kazakhstan: 1%
                                                                                                                                                           United States: $8.65
             United States: 2%                    Other

  Papua New Guinea: 3%                                                                                       Turkmenistan                          $5.47

                 Myanmar                            4%                                                             Australia                                  $7.33

        Uzbekistan                   4%
                                                                                                                        Qatar                                                     $9.15
                                4%
      Indonesia                                                                                                    Malaysia                                  $7.11
                            4%                                             36%
                                                                       Turkmenistan                               Indonesia                                       $7.97
       Malaysia            6%
                                                                                                                Uzbekistan                       $5.14

                                                                                                                  Myanmar                                                          $9.56
                                 11%
               Qatar                                                                                  Papua New Guinea                                                $8.63
                                                        25%
                                                      Australia                                                 Kazakhstan                    $4.45

                                                                                                                                $0      $2       $4          $6           $8       $10

                                        Percent of total imports                                                                Cost of imports in USD/thousand cubic feet (Mcf)

Source: Based upon Global Trade Tracker data, available for subscribers at www.globaltradetracker.com (last accessed 2018).

                9    Center for American Progress | Do Not Fall for the Hype on U.S.-China Natural Gas Trade
U.S. natural gas exports to China did not begin in earnest until August 2016, when Houston-based Cheniere Energy began shipping LNG to Chinese buyers from its Sabine Pass liquefaction facility.48 In 2016, China imported 17.2 billion cubic feet of LNG from the United States.49 In 2017, that increased to 100 billion cubic feet,50 making the United States China’s ninth-largest natural gas supplier behind Papua New Guinea. All of the U.S.-to-China shipments departing in 2017—29 total cargoes totaling 100.01 billion cubic feet51—came from Cheniere’s Sabine Pass facility.52 Cheniere has a unique toll gate business model: The company is not directly involved in production. Instead, it purchases gas from U.S. producers, liquefies it at Sabine Pass, and sends it overseas. When Cheniere signs long-term contracts, it is not agreeing to produce a set amount of gas but rather to procure and liquefy it on the buyer’s behalf. In February, Cheniere Energy inked a long- term deal with China National Petroleum Corporation to supply up to 1.2 million tons—58.4 billion cubic feet—of LNG per year until 2043.53 Cheniere can fill those shipments with a combination of spot market purchases—taking advantage of price dips wherever possible—and longer-term supply contracts with produc- ers willing to supply larger shipments to Cheniere at wholesale rates. Although Cheniere’s unique business model is doing well exporting limited amounts of LNG to China, overall, the United States has not played a major role in China’s supply chain because U.S. LNG is generally not cost competitive in China. In 2017, China paid an average US$8.65 per thousand cubic feet for imports from the United States and an average US$6.95 per thousand cubic feet for all other nat- ural gas imports. Based on 2017 pricing, U.S. imports are more expensive than 83.6 percent of the natural gas China obtained from other suppliers.54 Within China’s seaborne LNG supply chain alone—not including pipeline gas—U.S. imports are more expensive than 73.8 percent of China’s imports from other suppliers.55 10 Center for American Progress | Do Not Fall for the Hype on U.S.-China Natural Gas Trade
The United States has a
geographical disadvantage
exporting to China

The United States is better placed to serve other growing markets

The problem is that, although U.S. production costs are relatively low—U.S.
benchmark prices have averaged $3.14 per thousand cubic feet since March 2014
compared with $4.35 per thousand cubic feet in Australia—transport costs from
the U.S. Gulf Coast ratchet up the price beyond what China would pay for com-
parable shipments from Australia.56 U.S. LNG export infrastructure is clustered
along the Gulf Coast because those ports are closest to the nation’s existing pipe-
lines and other onshore natural gas infrastructure.57 Shipping LNG from the U.S.
Gulf Coast to China, one way, currently costs approximately twice as much as it
does from Qatar and almost three times as much as from Australia. Geographical
distance is the problem: When transporting natural gas to Shanghai, tankers from
the U.S. Gulf Coast travel 10 days longer than tankers from Qatar and 15 days
longer than tankers from Western Australia.58 To reach Asian markets, tankers
leaving Gulf Coast terminals must choose among four major maritime routes:
Panama Canal, Suez Canal, Cape Horn in South America, or the southern tip
of Africa. Even the shortest route from the Gulf Coast to Asia—through the
Panama Canal—incurs substantial transit costs.59

In contrast to the challenges involved in sending natural gas to Asia, the United
States has a geographical advantage exporting to Canada and Mexico—and
that is where the bulk of U.S. exports currently go. Pipeline exports to Canada
and Mexico accounted for 78 percent of total U.S. natural gas exports in 2017.60
Excluding continental pipeline trade, Mexico was also the leading export destina-
tion for U.S. LNG in 2017.61

11   Center for American Progress | Do Not Fall for the Hype on U.S.-China Natural Gas Trade
TABLE 1
One-way transport costs between export plants and import terminals,
in USD/Million British thermal units
Calculations based on model of standardized shipping conditions

                                                                                                                     To
From                                   Tianjin,            Shanghai,               Tokyo,            Incheon,              Altamira,              Aqaba,               Huelva,            Mejillones,
                                        China                China                 Japan            South Korea             Mexico                Jordan                Spain               Chile

Sabine Pass (USA)                        $0.83                $0.81                $0.76                 $0.81                $0.17                $0.61                $0.38                 $0.45

Cove Point (USA)                         $0.85                $0.83                $0.78                 $0.83                $0.24                $0.54                $0.31                 $0.47

Qatargas (Qatar)                         $0.48                $0.44                $0.48                 $0.46                $0.78                $0.29                $0.51                 $0.76

Darwin LNG (Australia)                   $0.31                $0.28                $0.30                 $0.30                $0.86                $0.49                $0.71                 $0.61

Authors used a generic set of shipping condition assumptions to create a standardized comparison between shipments from different locations; exact rates could vary depending upon variables
including vessel specifications, port fees, charter rates, and boil-off prices, among other conditions.

Source: Shipping rates calculated using IHS Markit’s LNG Shipping Calculator. The use of this content was authorized in advance. Any further use or redistribution of this content is strictly prohibited
without written permission by IHS Markit.

Going forward, transport costs are likely to become even more important for U.S.
export competitiveness because the capital costs required to bring new U.S. natu-
ral gas export terminals online are increasing, and that will make it harder for U.S.
exporters to make a profit while also keeping their prices competitive in overseas
markets. When the shale gas boom first made it possible for the United States
to consider exporting natural gas in the mid-2000s, existing import terminals
along the East and Gulf Coasts—which were already connected to the nation’s
pipeline network—offered early, limited opportunities for companies to retrofit
those facilities for export instead of building new terminals from scratch.62 There
are a limited number of existing import terminals available to retrofit, however,
so new companies entering the market today are more likely to construct new
terminals from scratch. That doubles their upfront capital costs: Constructing a
new terminal runs between $31 million and $52 million per billion cubic feet of
capacity; retrofitting an existing facility runs $10 million to $12.5 million per bil-
lion cubic feet of capacity.63 Across the United States, there are currently 27 active
terminal projects: two in operation—Cheniere’s Sabine Pass and, as of March
2018, Dominion Energy Inc.’s Cove Point in Maryland; six terminals or terminal
expansions under construction; four approved but not yet under construction;
and an additional 16 in the approval or pre-filing stage with relevant regulatory
authorities.64 Of those 27 projects, only eight are retrofits.65

If U.S. LNG export tankers departed from the Pacific Coast instead of the Gulf
Coast, that would lower maritime transport costs to Asia—thus potentially
balancing other costs, such as terminal construction costs—but that is not

12     Center for American Progress | Do Not Fall for the Hype on U.S.-China Natural Gas Trade
where most U.S. natural gas production is located. If state and federal regula- tory authorities approve the only LNG project currently proposed for the West Coast—the Jordan Cove project in Oregon—that would open up 1.04 billion cubic feet of West Coast export capacity with proximity to Asian markets.66 However, that project is facing substantial opposition from Native American tribes, environmental groups, property owners, and some state leaders along the feeder pipeline’s proposed route.67 Furthermore, adding substantial export capac- ity along the U.S. Pacific Coast would require sinking even more money into new pipeline infrastructure to connect those terminals to the closest production areas in states such as Wyoming or Colorado.68 Expansions into the U.S. north- east make more commercial sense. The recently operational Cove Point terminal project in Maryland and the Elba Island project under construction in Georgia are located at preexisting import terminal sites with good pipeline connections and geographical proximity to production areas such as the Marcellus and Utica shale plays in Appalachia.69 Once complete, those terminals will provide shorter transport distances to European and Mediterranean markets, but they will not lower transit costs to Asia.70 Overall, exporting LNG from the United States to Asia is an expensive proposi- tion. That can make sense for import markets such as Japan that can pay high prices. Japan, for example, paid an average of $6.13 per thousand cubic feet for the LNG shipments it received from the United States in 2017. In comparison, China paid an average $4.32 per thousand cubic feet,71 and even at that rate, the shipments it received from the United States were among its most expensive, as mentioned above. It is important to note, however, that China is not the only rapidly growing demand market. As natural gas prices continue to fall and technology innovations offer cheaper and more flexible options for import infrastructure, there has been a rush of new market entrants that—when taken together—outweigh China’s demand growth. Between 2014 and 2017, 12 emerging markets—many of which are leveraging floating infrastructure—cumulatively drove more global LNG demand growth than China. Demand is rising across Europe, the Middle East, and the Americas—all of which are geographically closer to the United States and thus offer more favorable transport rates for U.S. exporters.72 Impressive growth in closer-in markets makes it difficult to justify investing in expensive U.S. projects designed to send LNG to more distant, and thus more costly, East Asian markets where U.S. exports do not enjoy the same comparative advantage.73 13 Center for American Progress | Do Not Fall for the Hype on U.S.-China Natural Gas Trade
These trends raise an important question about the Trump administration’s                  If the United States
China strategy: If the United States has better export alternatives, why would
the White House put so much political capital into pushing for deals with                  has better export
Beijing? Furthermore, why would administration officials even consider accept-
ing those deals as a major Chinese trade concession—as Secretary Ross is sug-              alternatives, why would
gesting—instead of holding the line to demand Chinese action on much bigger
trade policy issues?                                                                       the White House put so

                                                                                           much political capital

                                                                                           into pushing for deals

                                                                                           with Beijing?

14   Center for American Progress | Do Not Fall for the Hype on U.S.-China Natural Gas Trade
The Trump administration is pushing investment deals that ignore current market trends Many of the voices that are bullish on U.S. LNG exports to China are hoping for long-term infrastructure investment deals. With this business model, the buyer agrees to invest in production infrastructure and, in return, gains access to the natural gas the project produces at a set price over 10- to 20-year time horizons. Since prices can shift substantially over a decade and the upfront capital costs are spread out over a long time frame, this approach can make sense even when cur- rent price alignments are less than favorable. In Australia, for example, Chinese investment has been key for developing some of that nation’s recent natural gas infrastructure.74 Australia’s natural gas resources are generally located in sparsely populated regions of the country or offshore, and the pipeline and processing infrastructure needed to link supply and demand would be costly relative to the country’s small population. To address that challenge, Australia actively courted overseas investors—including Chinese corporations— willing to bankroll development projects in exchange for long-term access to the gas those projects produce. Chinese firms are also acquiring shares in specific Australian gas plays. For exam- ple, China National Offshore Oil Corporation (CNOOC) has invested more than US$8 billion in Australian LNG projects, including a 5.3 percent equity stake in Western Australia’s North West Shelf reserves and a 25 percent equity stake in the Queensland Curtis LNG project, which provides CNOOC a guaranteed 175.32 billion cubic feet per annum.75 Similarly, China’s Sinopec owns a 25 percent stake in the Australia Pacific LNG project—also in Queensland—which provides Sinopec a guaranteed 370.12 billion cubic feet per annum.76 In the Surat-Bowen Basin in Queensland, PetroChina, Sinopec, and CNOOC hold 12 percent, 8 per- cent, and 5 percent shares, respectively, of the basin’s approximately 36.6 trillion cubic feet of proven and probable natural gas reserves.77 Overall, as of 2017, these 15 Center for American Progress | Do Not Fall for the Hype on U.S.-China Natural Gas Trade
investments and related contracts—which are public—give China exclusive rights
to 20 percent of Australia’s current annual natural gas export capacity of 2.99
trillion cubic feet per annum.78 When nonpublic contracts are included, the total
amount is likely much higher.79

Chinese investors are also active in the United States. Since 2010, Chinese com-
panies have invested $12.34 billion in American oil and natural gas companies,
approximately $6.3 billion of which is invested in American companies solely
working in natural gas.80 Both the United States and Australia have prevented
China’s state-owned enterprises from controlling their domestic oil and gas
resources: Those firms could make minority-share investments, but they could not
control how much gas is pulled out of the ground or where it is sent. In the United
States, however, President Donald Trump is aiming to change that arrangement.

When President Trump visited Beijing in November, the two presidents oversaw
the signing of a preliminary agreement between Alaska and three Chinese state-
owned enterprises—China Petrochemical Corp (Sinopec), China Investment
Corp (China’s sovereign wealth fund), and Bank of China—in which the
Chinese firms would bankroll Alaskan pipeline infrastructure in exchange for
guaranteed access to 75 percent of the gas produced over the duration of the
project.81 According to Platts reporting, Alaska’s state gas corporation, Alaska
Gasline Development Corporation, “hopes to finalize the Sinopec contract by
next December, begin construction in 2019 and to have LNG exports underway
by 2024 or 2025.”82 That same trip produced a memorandum of understanding
between state-owned China Energy Investment Corporation and West Virginia.83
The West Virginia deal is particularly light on details, but according to West
Virginia Gov. Jim Justice (R), the state is hoping that China Energy Investment
Corp. will invest around $83 billion in a suite of natural gas projects ranging from
power stations to petrochemical plants—more than the state’s gross domestic
product for all of 2016.84

In reality, these deals should be viewed with a healthy dose of skepticism, because
global markets are shifting in ways that make fixed infrastructure investments
of this nature increasingly unattractive. Two big trends are having a particularly
important impact: shifts in market pricing and technical innovations in natural gas
import and export infrastructure.

16   Center for American Progress | Do Not Fall for the Hype on U.S.-China Natural Gas Trade
On the pricing front, LNG markets are shifting from oil-linked to hub-based
pricing, and that is making long-term infrastructure investment contracts less
attractive. When trade first began in 1964, there was no standard pricing model
for natural gas, so buyers and sellers generally used crude oil prices as a commonly
accepted benchmark.85 At that time, long-term contracts were a useful strategy for
locking in price security against the volatile price of crude oil.

When the United States began to enter the global market on a large scale, that
brought about a new approach to pricing. In the United States, natural gas trade
developed primarily to serve domestic use. Since buyers and sellers were oper-
ating within the same domestic market, they could negotiate prices based on
actual supply and demand rather than a crude oil benchmark.86 The U.S. Henry
Hub—the Gulf Coast trading platform where several pipelines intersect—allowed
natural gas to compete with natural gas rather than with oil.87 Now other regional
markets are following that example and shifting toward hub-based trading, which
is making prices more commoditylike and transparent. Buyers can now leverage
hub-based trading to take advantage of low-price, short-term, or spot contracts
for natural gas rather than relying only on long-term contracts designed to insu-
late natural gas deals from fluctuations in crude oil.88 Long-term contracts still
dominate global LNG trade, but short-term and spot-market contract shipments
are rapidly gaining market share: They accounted for 28 percent of global trade
volume in 2016, up from 16 percent in 2010. More than half of the spot-market
activity is occurring in Asia.89

Technology innovations are yet another force pushing the market away from long-
term infrastructure investments. Instead of sinking billions of dollars into fixed
import and export terminals—which can quickly become useless if markets shift
the wrong way—technical innovations are making it possible to deploy cheaper
and more flexible floating units. Floating liquefaction units—otherwise known
as floating export terminals—can be constructed using retrofitted tanker ships,
new near-shore barges or purpose-built vessels. These units cost $12.5 million to
$20.8 million per billion cubic feet of capacity to construct, which is less than half
the cost of building a new fixed export terminal in the United States.90 Worldwide,
there are already four of these projects under construction—with a total 423 bil-
lion cubic feet of capacity—and another 24 in the proposal pipeline, potentially
adding another 7.6 trillion cubic feet to the supply side.91

Floating storage and regasification units—import terminals—are also showing up
on the demand side of the market. They are less expensive than onshore import
facilities by a factor of 4 for new vessels or up to 12.5 for retrofitted LNG tankers.92

17   Center for American Progress | Do Not Fall for the Hype on U.S.-China Natural Gas Trade
New import market entrants—including Colombia, Egypt, Jordan, Pakistan, and
the United Arab Emirates—are already utilizing floating terminals. As of January
2017, total floating regasification capacity reached 4 trillion cubic feet across 21
terminals, a significant addition to the demand side.93

As more floating terminals come online, they will have a big impact on the global
market. For one thing, they will make expensive fixed export infrastructure invest-
ments—such as those under discussion in the United States—an even less attrac-
tive proposition. They will also bring in an array of new market entrants. When
utilized for export, floating units still rely on proximity to natural gas supply, either
via connection to onshore pipelines or offshore reserves; when utilized for import,
floating units unlock potentially great demand from a new host of countries in
regions closer to U.S. export facilities.94 Nations keen to either buy or sell LNG
in relatively small amounts—that is to say, amounts that do not justify sinking
billions into fixed infrastructure—can do so more cheaply using floating units.
A rush of smaller buyers and sellers can have as big or more of an impact as the
movements of one big player such as China. Between 2014 and 2017, 12 coun-
tries, taken together, drove more demand growth than China, and floating import
terminals enabled three-quarters of that growth.95

These market and technical shifts—combined with unfavorable U.S.-to-China
transport rates—explain why, as China’s Vice Minister of Finance Zhu Guangyao
put it: “The U.S. is more eager than China to sign long-term LNG contracts.”96
The economics are just not as favorable for China as they used to be, and that is
one reason President Trump’s November 2017 Beijing trip only produced vague
memorandums rather than binding deals. The West Virginia deal provides almost
no detail, and the Alaska deal is basically just a feasibility study.97 It is worth noting
that Exxon Mobil, ConocoPhillips, BP Plc, and TransCanada Corp. have already
walked away from this same development project in Alaska based on estimates
that it would cost up to US$65 billion and take over a decade to construct.98

If private companies are walking away from these infrastructure projects, that
raises potential red flags about China’s intentions. One senior Chinese govern-
ment official interviewed by the authors of this report stated that China’s only
reason to sign LNG contracts of this nature with the United States is to win
political concessions from President Trump. If Beijing is willing to pay more than
$100 billion—the combined costs of the Alaska and West Virginia projects—to
get those concessions, the American public will need to know exactly what we are
giving China in return.

18   Center for American Progress | Do Not Fall for the Hype on U.S.-China Natural Gas Trade
Even if Beijing’s only intention in potentially bankrolling U.S. infrastructure is to
add to their nation’s supply diversification—unlikely, given that China already has
26 suppliers—there are still valid concerns about giving China a controlling stake
in U.S. production. Chinese state-owned enterprises, including oil majors, answer
to the Chinese Communist Party. Those firms are tools of the state and behave
accordingly.99 If those firms obtain massive shares in U.S. natural resources—large
enough to potentially control how those resources are used and effectively bank-
roll the state and local economies in which they operate—that raises important
questions about how that might affect U.S. national security.

     Alaskan LNG prospects: High costs despite
     market proximity
     The first U.S. LNG exports departed from Kenai, Alaska, in 1969.100 The Kenai terminal
     exported LNG primarily to Japan. During its heyday from 2000 to 2006, Alaska exported
     more than 60 billion cubic feet on average per year.101 Starting in the mid-2000s, how-
     ever, Kenai encountered commercial headwinds. The state has a natural advantage in
     proximity to Japan and other Asian markets—including open ocean access rather than
     the necessity of transit through congestion points—but that does not overcome other
     market disadvantages it faces.

     Alaskan natural gas is generally more expensive to develop than lower-48 shale gas due
     to the costs involved in transporting it to the coast for export. It is also disconnected
     from lower-48 pipeline networks and thus from the U.S. Henry Hub. Alaskan natural gas
     is an entirely separate market: Prices are pegged to global oil prices, and it is only profit-
     able when oil prices are higher than $75 per barrel.102 Kenai exports fell to zero in 2013;
     the last shipments departed the terminal in 2015.103 Kenai simply does not appear to
     be commercially viable due to the combination of new LNG export terminals com-
     ing online in the Gulf Coast, declining global oil prices—particularly in late 2014 and
     2015—and a global oversupply of natural gas. Despite receiving approval for non-FTA
     exports from the U.S. Department of Energy (DOE), ConocoPhilips has sought to sell its
     Kenai LNG export terminal and announced in July 2017 that it would mothball the facil-
     ity.104 Based on current market conditions, the proposed $50 billion Alaskan natural gas
     pipeline and associated export infrastructure may not be commercially feasible.105

19     Center for American Progress | Do Not Fall for the Hype on U.S.-China Natural Gas Trade
Trump administration’s natural gas export obsession risks forfeiting a much bigger game If individual American companies find good commercial opportunities to export natural gas to China or other buyers, they should go forth—provided, of course, the United States has the regulatory structure in place to make sure those resources are extracted, processed and transported without damaging American health and property. Problems arise, however, when the White House throws massive political capital into pushing deals that do not make good commercial sense. Those problems are magnified when the federal government does so at the expense of American compa- nies and technologies that do have great commercial potential. Unfortunately, that is exactly what is currently happening on the clean energy front, and the ramifications could significantly undercut U.S. competitiveness over the longer term. The Trump administration claims that boosting natural gas exports will create new American jobs, but that claim is problematic on multiple fronts. For one thing, the upstream side of the natural gas business—the production side—is becom- ing increasingly automated, so companies are hiring fewer workers to produce the same amount of gas. In the United States, new drilling technology is reduc- ing labor needs by around 40 percent in the oil and gas business.106 Oil and gas production is shifting toward remote monitoring and management, automation, and data analytics to streamline operations; those shifts improve efficiency but support a much smaller workforce than in years past.107 For example, the World Economic Forum estimates that, industrywide, next-generation automation will displace 38,000 upstream jobs between 2016 and 2025 and the adoption of wire- less sensors and other connected devices will displace another 76,000 jobs.108 It is also possible that boosting exports will undermine other sectors of the U.S. economy. If the United States starts sending more natural gas overseas, that may reduce the supply available on the domestic market and drive up prices here at home. U.S. companies who utilize natural gas as a key manufacturing input benefit 20 Center for American Progress | Do Not Fall for the Hype on U.S.-China Natural Gas Trade
when domestic U.S. prices are low because that gives them an edge over their
competitors in overseas markets. According to one study commissioned by Dow
Chemical, natural gas supports eight times more American jobs when it is used for
manufacturing instead of export.109 Of course, domestic price increases would also
affect American consumers. In 2015, the Center for American Progress analyzed
Energy Information Administration data on LNG exports and domestic natural
gas prices and found that high levels of LNG exports may lead to $7 billion in
additional annual costs to consumers by 2020.110 One could argue that ratcheting
up U.S. domestic natural gas prices via exports would make renewable power even
more competitive and thus support renewable job growth; however, the Trump
administration is disinvesting in renewables and seeking subsidies for coal, a sec-
tor that is facing its own job displacement problems due to automation and other
market-induced job-loss trends that exceed what is happening in oil and gas.111

Although there is no clear evidence to support claims that boosting natural gas
exports will benefit the U.S. economy, it is becoming abundantly clear that clean
energy is the real jobs generator. As of 2017, renewable energy is the cheapest
source of electricity in the United States.112 Even without taking pollution into
account, fossil fuels simply cannot compete with declining renewable energy
costs. As renewables become increasingly affordable, that expands use and jobs.
At year-end 2016, there were 572,881 renewable electricity generation jobs and
398,235 natural gas-fired electricity generation jobs in the United States.113 In
2017 nearly half of all U.S. utility-scale generation capacity additions came from
solar or wind, and the Federal Energy Regulatory Commission expects U.S.
renewable generation to more than double over the next three years—despite
the fact that the Trump administration is promoting fossil fuels at the expense of
other energy sources.114 Globally, the world is already installing more new renew-
able capacity than fossil fuel capacity, and that gap is steadily expanding.115

This is why Beijing is launching an all-out effort to dominate global clean energy
markets. Chinese leaders view clean energy as a key battlefield in the nation’s much
broader aim to become the new global high-tech superpower. Power generation
and new-energy or energy-efficient vehicles are key focus areas for Beijing’s Made
in China 2025 initiative, which is channeling hundreds of billions of dollars in state-
funded and state-directed capital to help Chinese companies take over these key
technology markets.116 Beijing knows that more than 200 nations are gearing up to
invest $13 trillion in renewable energy over the next decade to meet their targets
under the Paris climate agreement, and falling renewable energy prices are likely
to generate even more investment as more and more nations—even the world’s

21   Center for American Progress | Do Not Fall for the Hype on U.S.-China Natural Gas Trade
biggest oil producers—transition to renewables.117 Chinese leaders want the bulk
of those technologies and products to come from China. They expect this global
renewable push to generate 13 million new Chinese jobs by 2020, and they are
pulling every policy lever they can reach to make that happen.118

Unfortunately, at the very moment when the United States should be gearing up
to face Chinese competition in the energy technology sectors of the future, the
Trump administration is undercutting U.S. clean tech innovation on multiple
fronts.119 Trump’s budget proposals openly attack investment in clean energy
and energy efficiency technologies: Across the DOE, clean energy research and
development faced proposed cuts up to 70 percent in fiscal year 2018 and up to 66
percent in fiscal year 2019.120 These cuts undermine not only the integrity of the
individual offices focused on researching and developing efficiency, solar, wind,
carbon capture, grid, and nuclear technologies but also the national laboratories
that support that work. Each budget proposal has also called for the termination of
vital research, development, and commercialization programs such as the DOE’s
Advanced Research Projects Agency-Energy (ARPA-E) and Loan Programs.121
Furthermore, by terminating the Clean Power Plan, the Trump administration has
removed carbon pollution standards for power plants that would have increased
the amount of renewable energy and efficiency technologies in use in the United
States.122 Secretary of the Department of Energy Rick Perry also proposed a rule
to the Federal Energy Regulatory Commission that would have subsidized coal
and nuclear power plants had it not been rejected by the commissioners.123

When Trump administration officials frame natural gas exports as a major
demand in U.S.-China trade talks that risks undercutting the U.S. economy even
further. Beijing is deploying an array of nationalist economic policies—including
the Made in China 2025 initiative—that leverage state resources to help Chinese
companies push American competitors out of global high-tech markets. The
Trump administration recently threatened to retaliate by levying tariffs against
$50 billion in Chinese imports. The tariff approach is problematic on multiple
fronts—it will likely hit U.S. consumers as hard if not harder than China—but
the Trump administration will wade into truly dangerous waters if it first threat-
ens China with tariffs and then offers to reduce them if China buys more LNG
from the United States. When the administration announced the new tariffs, U.S.
Commerce Secretary Wilbur Ross stated that “we will end up negotiating these
things rather than fighting over them.”124 According to Secretary Ross, President
Trump has asked President Xi for a $100 billion reduction in the U.S. trade
deficit, which, according to Secretary Ross, China can partially fulfill by shifting

22   Center for American Progress | Do Not Fall for the Hype on U.S.-China Natural Gas Trade
its natural gas supply chain from other nations to the United States. In addition to
the fact that—as outlined above—that does not make good commercial sense for
either nation, if the administration accepts LNG deals as a major trade concession
that will give Beijing a pass on much bigger trade issues that, if not adequately
addressed, will undermine U.S. competitiveness for decades to come.

23   Center for American Progress | Do Not Fall for the Hype on U.S.-China Natural Gas Trade
Conclusion

Natural gas consumption is rising in China. That is a good thing for China’s energy
transition and emission-reduction efforts. If individual American firms find com-
mercial opportunities to provide some of that natural gas, they should go forth.
At a national level, however, the U.S. federal government should not push export
deals that do not make good commercial sense and risk undermining broader U.S.
competitiveness vis-a-vis China.

Unfortunately, that is exactly what the Trump administration is currently doing.
As Beijing is well aware, clean energy is the real battleground, and while China is
doing everything it can to help its own companies dominate that rapidly growing
global market, the Trump administration is undercutting U.S. clean-tech innova-
tion and wasting federal government political capital pushing for natural gas deals
that the United States does not actually need. If the administration takes this a step
further—as Secretary Ross is recommending—by accepting U.S.-China natural gas
deals in exchange for backing off on much broader U.S. trade concerns with China,
that will further undercut the U.S. economy and play right into Beijing’s hands.

24   Center for American Progress | Do Not Fall for the Hype on U.S.-China Natural Gas Trade
About the authors

Melanie Hart is a senior fellow and the director for China Policy at the Center for
American Progress. Luke H. Bassett is the associate director for Domestic Energy Policy at
the Center. Blaine Johnson is the policy analyst for China and Asia Policy at the Center.

25   Center for American Progress | Do Not Fall for the Hype on U.S.-China Natural Gas Trade
Appendix A: U.S. LNG export shipments
           to China as of year-end 2017

TABLE A1
U.S. LNG Shipments to China
Export Shipments as of Year-End 2017

                                                                                                                      Price at
  Departure                                                                                         Shipment
                Name of exporter    Export plant      Charterer      Buyer        Import port                      export point   Contract
    date                                                                                           volume (Bcf )
                                                                                                                    ($/MMBtu)

                Sabine Pass
  2017-12-30                        Sabine Pass LNG      Shell       CNOOC       Zhejiang Ningbo       3.32           $3.54         Spot
                Liquefaction, LLC

                Sabine Pass
  2017-12-26                        Sabine Pass LNG    Cheniere     PetroChina       Dalian            3.28           $6.54*        Spot
                Liquefaction, LLC

                Sabine Pass
  2017-12-25                        Sabine Pass LNG    Gunvor        CNOOC       Zhejiang Ningbo       3.27           $3.54         Spot
                Liquefaction, LLC

                Sabine Pass
  2017-12-22                        Sabine Pass LNG      Shell      PetroChina      Tangshan           3.46           $6.54*        Spot
                Liquefaction, LLC

                Sabine Pass
  2017-12-16                        Sabine Pass LNG      Shell       CNOOC       Tianjin (CNOOC)       3.40           $3.54         Spot
                Liquefaction, LLC

                Sabine Pass
  2017-12-12                        Sabine Pass LNG    Cheniere      CNOOC       Zhejiang Ningbo       3.40           $5.48         Spot
                Liquefaction, LLC

                Sabine Pass
  2017-12-02                        Sabine Pass LNG      Shell      PetroChina      Tangshan           3.30           $3.54         Spot
                Liquefaction, LLC

                Sabine Pass                           Gas Natural
  2017-11-27                        Sabine Pass LNG                 PetroChina      Tangshan           3.62           $4.37         Spot
                Liquefaction, LLC                       Fenosa

                Sabine Pass
  2017-11-20                        Sabine Pass LNG    Cheniere      CNOOC       Tianjin (CNOOC)       3.41           $4.91         Spot
                Liquefaction, LLC

                Sabine Pass
  2017-11-12                        Sabine Pass LNG    Cheniere     PetroChina      Tangshan           3.42           $4.92         Spot
                Liquefaction, LLC
                Sabine Pass
  2017-11-11                        Sabine Pass LNG      Shell      PetroChina       Jiangsu           3.39           $3.17         Spot
                Liquefaction, LLC

                Sabine Pass
  2017-11-08                        Sabine Pass LNG      Shell       CNOOC       Tianjin (CNOOC)       3.30           $6.17*        Spot
                Liquefaction, LLC

                Sabine Pass
  2017-11-05                        Sabine Pass LNG      Shell       CNOOC          Yuedong            3.72           $3.17         Spot
                Liquefaction, LLC

                Sabine Pass
  2017-10-29                        Sabine Pass LNG      Shell       CNOOC       Tianjin (CNOOC)       3.69           $3.42       Long-term
                Liquefaction, LLC
                                                                                                                                      continues

           26    Center for American Progress | Do Not Fall for the Hype on U.S.-China Natural Gas Trade
You can also read