Document d'études - Dares
←
→
Page content transcription
If your browser does not render page correctly, please read the page content below
Document d’études
Direction de l’animation de la recherche, des études et des statistiques

Numéro 243                                        Octobre 2020

              Is There a Second Chance for
                  High-School Dropouts?
            Evidence from a Large-Scale Correspondence Study

                                 Jérémy HERVELIN
                                     Crest-Ensae
                                   Cecile BALLINI
                                        Dares
                                   Mathilde GAINI
                                       Drees
Is There a Second Chance for High-School Dropouts?
Evidence from a Large-Scale Correspondence Study∗
Jérémy Hervelin† Cécile Ballini‡ Mathilde Gaini§
August 26, 2020
Abstract
School dropouts often face persistent difficulties accessing the labor market, which policies
fail to address. Our article contributes to the understanding of these difficulties by focusing
on employers’ preferences regarding dropout applicants. In 2018, we sequentially sent more
than 10,000 applications to job offers and 10,000 speculative applications in France. By
analyzing the differences in callback rates with respect to non-dropouts with a vocational
upper-secondary diploma, we find that school dropouts who have remained inactive over two
years have a significantly smaller chance (two-thirds on average) of being called back. Job
related experience or training leading to a certificate boosts dropouts’ chances, reducing by
more than half the difference in callback probability, but their chances remain lower than that
of non-dropout high school graduates. Only dropouts with both job related experience and
training leading to a certificate manage to catch up with their non-dropout peers. We confirm
our results through a battery of robustness checks.
Keywords: School dropouts, Active labor market policies, Field experiment
JEL codes: J08, J24, M51
∗
We specially thank Pierre Cahuc for his discussions and helpful comments. Our thanks also go to participants at
the 4th AFSE-DGT conference on evaluation of public policies, the 6th Potsdam PhD workshop in empirical economics,
and the 27th annual workshop transitions in youth. We are grateful to Philippe Zamora and Marine Guillerm for helpful
guidance during the experiment. We are also indebted to Marie-Camille Alban, Elika Athari, Sarah Cohen, Karim El
Charkawy, Demba Konate, Hugo Lapeyronie, Salomé Leblanc, Komivi Seshie, and Loic Valck, for excellent research
assistance. This project has been approved by the board of the Sécurisation des Parcours Professionnels Chair and
funded by both the Chair and the Ministry of Labor (DARES). It has been administratively supported by the Institut
Louis Bachelier.
†
CREST-ENSAE. Contact at jeremy.hervelin@ensae.fr
‡
DARES. Contact at cecile.ballini@travail.gouv.fr
§
DREES. Contact at mathilde.gaini@sante.gouv.fr
1I Introduction
Youths who leave school before graduation without any diploma suffer adverse consequences in
the labor market. They face lower wages and lower probability of employment than their non-
dropout counterparts (Oreopoulos, 2007; Campolieti et al., 2010). This difficult situation has
become a major concern for most OECD countries, because school dropouts are more likely
to be found among young people who are not in employment, education or training (NEET)
later on (OECD, 2019). Accordingly, France decided to boost opportunities for NEET through
active labor market policies, in particular through the two pillars of vocational training and
subsidized contracts. In fact, the number of youth trainees aged 16-25 rose from about 250,000
in 2009 at the beginning of the crisis in France to 320,000 in 2016. These figures correspond
to 14% and 19% respectively of same-age unemployed youth (Guillon, 2019). Between 2012
and 2017, France also set up a specific subsidized contract for NEET youths, called ”Emploi
d’avenir”, in which firms were required to provide additional specific training, either internally
or externally in a training center. More than 300,000 youths benefited from the scheme. In the
most favorable cases, the additional training could lead to a certificate. The trend in French
policy indicates a shift toward hybrid labor market policies in which youth can benefit from
both training and professional experience. This recent policy orientation provides a specific
environment in which we can test empirically whether different types of active policy give
high-school dropouts a second chance on the labor market.
Our article contributes to the understanding of youth transition in the labor market by
focusing on potential recruiters’ preferences with regard to educational and professional items
in low-skilled profiles. In particular, we test whether hybrid programs yield a better outcome
for youths than training programs or subsidized contracts alone, by comparing their relative
importance for employers. We are able to rule out potential selection bias in the labor market
resulting from skills, knowledge, network or social conditions by carrying an audit correspon-
dence study. In the course of 2018, we sequentially sent more than 10,000 job offer applications
and more than 10,000 speculative job applications randomly throughout mainland France.1
Targeting firms that hire cooks and bricklayers, we designed resumes for 18/19-year-old virtual
job seekers, identical in all respects except for graduation and their labor market pathway in
the two years preceding the application. Given the youth population targeted by recent active
labor market policies in France, we consider youths who have completed vocational upper-
secondary education as the reference group and we compare them with four typical profiles of
dropouts: dropouts who remained inactive for two years after leaving school; dropouts who
1
The experiment was conducted under the patronage of the Sécurisation des parcours professionnels Chair
(http://www.chaire-securisation.fr), the partners of which are the Ministry of Labor, Pôle emploi (Public Em-
ployment Service), UNEDIC (Public Unemployment Insurance), Alpha Group (Consultancy firms specialized
in labor relations), Sciences Po and CREST. The Chair’s executive committee, composed of representatives of
these institutions, approved this experiment without imposing any constraint on the design proposed by the
authors.
2attended seven-months vocational training leading to a certificate; dropouts with a one-year
professional experience through a subsidized contract (private or public sector); and dropouts
with one year’s professional experience through the same subsidized contract who also took
complementary classroom training and obtained a certificate.
By analyzing the difference in callback rates with respect to non-dropouts, we find that
school dropouts have a significantly smaller likelihood of being called back for a job vacancy.
We find that the probability of callback decreases by 67% on average for an inactive dropout
compared to a non-dropout. This discrepancy then ranges from 5% to 90% depending on
dropouts’ labor market experience, the firm concerned and the job profile. Training or pro-
fessional experience boosts dropouts’ chances of callback by a factor of three. Although their
chances are better than those of inactive dropouts, dropouts who have attended vocational
training still have 25% lower than the callback rate of their non-dropout peers. The callback
rate is the same for dropouts who gained job-related experience through a one-year subsidized
contract. Only dropouts with both professional experience and a certificate obtained through
complementary classroom training almost manage to catch up their non-dropout peers.
Our findings suggest that even though school-dropouts may get a second chance on the
labor market, their job prospects are on average lower than they were while at school. In
order to confirm the ranking of profiles, we performed a battery of robustness checks such
as changing the specification, looking for heterogeneous effects, controlling for additional
information (distance in kilometers to the job location, the local unemployment rate), and
sending applications spontaneously to firms.
Our results highlight the importance recruiters give to certificates in France. These results
are consistent with what is reported in Section II.B showing that when youths leave school
before graduation they find it difficult to enter the labor market. This finding is also con-
sistent with a recent non-experimental study carried out in France, showing that acquiring a
diploma is a major determinant for easier access to paid and stable employment (Marchal,
2018). Our results also underline the advantage of professional experience for recent dropouts.
Cahuc et al. (2019) carried out an experimental audit study with 24-year-old school dropouts.
The applicants concerned were youngsters who had entered paid employment, whether or not
through subsidized contracts, assorted with certified skills or not. In the control group, ap-
plicants remained mainly inactive. The authors show that only those dropouts who attended
certifying training while working under (subsidized) contracts have significantly higher call-
back rates. In contrast to their results, we find that dropouts with work experience only also
perform better than inactive dropouts.
The results may be of value for active labor market policies (ALPM) targeting youths. In
France, micro-econometric studies find no, or low, short-term effect of vocational training for
job-seekers (Caliendo and Schmidl, 2016). The same applies to subsidized contracts in the
non-market sector, but subsidized contracts in the market sector exhibit some positive effects
3(Benoteau, 2015). Meta-analyses reveal the same pattern for subsidized contracts in the
United States, Germany and the Nordic countries, but in these countries vocational training
produces positive long-run effects for job-seekers (Crépon and van den Berg, 2016; Card et
al., 2018; Vooren et al., 2019). We complement these findings by focusing on dropouts and on
recruiters’ preferences, while ruling out other determinants of youth insertion into the labor
market, and looking at the relative importance of each program.
Many reasons can be put forward to explain difficult school-to-work transitions through
ALPMs. One such reason is that active policies may be poorly designed, in relation to the
specific characteristics of young dropouts who are eager to enter the labor market and do not
see the benefits of education (Eckstein and Wolpin, 1999). In the current French context,
our paper argues for active labor market policies that combine both on-the-job training and
certifying classroom training, so that youths who do not fit into the education system are
better able to signal their competences in the labor market. Additional information on the
costs and benefits of such policies are nonetheless necessary for governments trying to combat
large-scale youth unemployment while subject to budgetary constraints. The limitations of
our study and potential drawbacks of extending current active labor market policies to young
school dropouts are discussed in Section VI.B. Upstream work on possibly less costly and
easier-to-implement programs that prevent youths from dropping out of the school system
should not be forgotten either (Björklund and Salvanes, 2011).
The paper is organized as follows. Section II presents the French employment public
policies and the situation of dropouts in the French labor market, in order to legitimate our
experimental setting. Section III describes the experimental design. Section IV presents the
main findings. Section V presents robustness checks that confirm our main results. Section
VI discusses the potential mechanisms and the external validity of our experiment. Section
VII concludes.
II Background
Since our study concerns youths who left education after middle school at the age of 16 instead
of pursuing vocational education at the upper secondary level, we start by presenting briefly
the main features of existing active labor market policies for youths, and then describe the
characteristics and situations of dropouts.
II.A The French employment policies
In France, the certificat d’aptitude professionnelle (CAP), corresponding to the two-year vo-
cational diploma of upper secondary level (11th grade), can be obtained through two different
paths, either in a vocational school program or in apprenticeship. Each year, there are about
4120,000 youths (≈ 15% of the cohort) who enroll in this program after middle school (9th
grade). However, there are also about 100,000 youths who drop out of the school system
without any diploma.2 It has been shown by Cayouette-Remblière and de Saint Pol (2013)
that youths face various obstacles before graduating and find it difficult to remain in the
education system until the end of 11th grade. Instead, they may prefer to leave when the
compulsory age threshold has been met and try their chances in the labor market.
Because the insertion of dropouts into the labor market is difficult (as discussed in Section
II.B), successive governments have decided to promote active labor market policies, especially
with regard to vocational training and subsidized contracts. Vocational training may be
provided by any private or public training center and the main silent providers are Pôle
emploi and the French Régions. This training can be carried out variously through classroom
training, on-the-job training, or in most cases a mixture of the two (Guillon, 2019). Table
A.1.1 in Appendix A.1 presents descriptive statistics on the training undertaken by youths
registered at Pôle emploi. It appears that around 80% to 95% of youths under 18 have a
school level lower than or equivalent to 11th grade (CAP) and enter in a program at the age
of 16.5. Vocational training lasts on average five to six months and leads mostly to a CAP
level, although only a few training schemes actually deliver a CAP diploma. Interestingly,
half to two-thirds of the youths have experiences time spent with a firm.
In parallel, the Emploi d’Avenir (EAv), operating between 2012 and 2018, was a program
aimed at reducing the labor cost for firms when hiring unskilled youths aged between 16 and
25. Between 35% to 75% of the gross minimum wage was paid by the state and the duration
of the contract could be up to three years. EAv provided the main subsidized contracts
for youths, and one innovation compared to other subsidized contracts was that employers
were obliged to offer training. In total, more than 360,000 contracts were signed during this
period.3 Table A.1.2 in Appendix A.1 presents statistics related to youths in EAv. It appears
that about three-quarters of contracts were one year temporary contracts, of which very few
were renewed, and they were mainly with small and medium-sized firms. Finally, only a third
of contracts seemingly led to a certified training, and in these cases more than 80% of training
programs were carried out in centers external to the firm. However, a national survey shows
that only a small proportion of youths were in fact enrolled in a certified training (Mourlot,
2018).
II.B Profile of school dropouts
We use a sample of the TRAJAM4 database to follow youths who have been flagged as
dropouts and avoid certain composition effects among the different labor market status dis-
2
Go to https://www.education.gouv.fr/bcp/mainFrame.jsp?p=1 for more open data.
3
Go to http://poem.travail-emploi.gouv.fr/ for more trends.
4
TRAjectoires des Jeunes Appariés aux Mesures actives du marché du travail.
5Table I
Correlations between Labor Market Experiences and Being a Dropout
Employment Unemployment Active Program
OLS Estimates
(1) (2) (3) (4) (5) (6)
Dropout -0.0394*** -0.0285** 0.0835*** 0.0803*** 0.0027** 0.0024*
(0.0133) (0.0134) (0.0081) (0.0080) (0.0013) (0.0014)
Constant 0.2340*** 0.2338*** 0.0221*** 0.0222*** 0.0016*** 0.0016***
(0.0023) (0.0023) (0.0007) (0.0006) (0.0001) (0.0001)
Observations 487,041 487,041 487,041 487,041 487,041 487,041
R-squared 0.0002 0.0657 0.0078 0.0341 0.0001 0.0048
Control Variables No Yes No Yes No Yes
Note: This table reports OLS estimates, where the dependent variable is the number of days a school dropouts has
experienced in employment from whatever date he started up to December 31 2015, for columns (1) and (2); in open
unemployment for columns (3) and (4); or in an active program (vocational training or subsidized job) for columns
(5) and (6). “Dropout” is a dummy variable equal to one if the individual has been recognized as a school dropout by
legal authorities at the date of the army day (JDC). Unreported control variables in columns (2), (4), and (6) include
demeaned dummies for sex, year of birth, department of birth, school level, literacy level, department of residency,
and elapsed months since the JDC. Robust standard errors are clustered at the individual level and reported below
coefficients in parentheses. *** significant at 1 percent, ** significant at 5 percent, * significant at 10 percent.
Source: sample from TRAJAM (2015), authors’ calculations.
cussed above. In particular, we use the one-day military census Journée Défense et Citoyen-
neté (JDC) as a starting point that French youths are required to participate in the age of 25.5
During JDC day, they have to declare whether or not they are NEETs. The large majority
of youths do this aged 17, so we consider these young NEETS as school dropouts.
Table A.1.3 in Appendix A.1 displays some of the available characteristics of youths and
dropouts during the JDC. It appears that dropouts are predominantly male and have a school
level lower than or equivalent to 9th grade. Moreover, their literacy level, which is determined
by a 30-minute French test during the JDC, is far lower than for non-dropouts, even though
more than 70% of dropouts have the normal literacy level expected. It has also been shown by
Bouhia et al. (2011) that dropouts are those who have had the greatest difficulties at school
are more likely to come from disadvantageous socio-economic backgrounds. This is reflected
in their subsequent situations. While the majority of youths stay on in school after the JDC,
about 13% have at least one period of open unemployment (i.e. being officially registered at
Pôle emploi ) during the following thirty months, against more than 47% of school dropouts.
Moreover, more than 9% of non-dropouts have had at least one period of paid employment,
as opposed to only 3.5% of dropouts. Dropouts are also more likely to enroll in vocational
training or a subsidized job program thereafter.
5
The TRAJAM scale is 1:12 and it is representative of all French youths (16-25) who have been in paid
employment, unemployment, or in active programs, at least once since 2010 in France. It is worth noting that
this database is still in a preliminary version with little information available that need to be consolidated.
We were thus able to obtain information at the date of the JDC only on gender, date of birth, place of birth,
place of residence, school level, and an indicator of literacy level. The latest records in the database were
in December 2015, so we select only dropouts who were flagged between January and June 2013. This time
window allows us to track the youths, especially the dropouts, for about 30 months.
6Estimates from a simple linear probability model controlling for individual characteris-
tics that are fixed over time leads to correlations between dropout status and labor market
status. Table I presents the correlations, obtained with ordinary least squares (OLS) estima-
tions, between being a dropout and being in employment, in unemployment, and in an active
program. It is clear that dropouts have a lower probability to be in paid employment than
non-dropouts. Similarly, they have a higher probability of being in open unemployment or
being in an active program. These results are in line with findings in the French literature on
the difficulty of access to employment for dropouts (Goux and Maurin, 1994), even for those
who benefited from labor market programs (Brodaty et al., 2000). Accordingly, in order to
better assess the difficulties of school dropouts in accessing paid employment, it is important
to get information about employers’ preferences. The correspondence study presented in the
next section has been designed to provide such information.
III Field experiment
The experiment aims to compare the probability of callback following job applications of
otherwise identical young graduates and school dropouts with different pathways in the labor
market. We start by presenting the profiles of applicants and then describe the process of
application and the collection of data.
III.A Treatment groups
The applicants are recently unemployed young adults. They all finished lower-secondary
school in June 2015, but they faced different situations over the next two years, as depicted
in Figure 1. On the one hand, some of them continued their education to obtain a CAP
diploma, either in vocational school or in apprenticeship. This group serves as the control
group, since it corresponds to the natural path in the education system. We call this first
group “Graduates”. We apply different treatments for school dropouts than for other youths.
During first year after dropping out, they had two one-month temporary contracts, with no
link to the occupations targeted in the audit correspondence study, and ten months of non-
employment. This year of inactivity acts as a signal of dropping out when employers look at
the applications.6 The second year after dropping out is differentiated among dropouts. Some
youths once again experienced two one-month temporary contracts without any link with the
targeted occupations (we call this group “Inactives”), while other underwent seven-month
vocational training leading to a CAP diploma (“Trainees”), or a one-year EAv contract which
could be combined with certified training leading to a CAP diploma (“Trained Workers”) or
not (“Workers”). These three different types of experience were linked with the targeted
6
Even though this is not the conventional definition, we refer to inactivity from the employer’s viewpoint
of both temporary employment within another occupation and of non-employment.
7Figure 1: Diagram of Treatment Profiles
occupations. We stop the last line of resumes in June 2017 to make sure all the applications
shared the same final duration of unemployment before applying to job vacancies.
III.B The occupations
In view of the financial and organizational constraints, two occupations were selected. The
choice of occupations is based on the following criteria: belonging to different industries, the
existence of an official state certification for the diploma usually required for being hired, a
sufficient proportion of former graduate upper-secondary vocational students and apprentices,
a sufficient proportion of school dropouts, a relatively small age difference between graduates
and dropouts at the hiring age, a sufficiently large number of job offers, being present in both
market and non-market sectors so to increase the potential number of job offers, and enough
employees under subsidized contracts.7 These criteria led us to select the occupations of
cook (ROME G1602) and bricklayer (ROME F1703). The vocational training characteristics
leading to these two occupations through the acquisition of skills and subsidized contracts
operating in these occupations are shown in Appendix A.1. For our purposes, youths in
construction and food services have important features in common with all youths in similar
programs, and more generally with all youths at the CAP level.8 For both occupations, the
7
We used various sources, including the French Labor Force Survey (Enquête emploi, INSEE), the Répertoire
National des Certifications Professionelles (RNCP) to verify the existence of national diploma, the Pôle emploi
database to assess the number of job offers.
8
See Cahuc and Hervelin (2020) for details.
8profiles are then in line with real applicants that employers encounter, even though “Trained
Workers” are less usual.
III.C The applicants
The profiles of applicants were then designed for these two occupations so that they have
a mix of soft skills (the ones expected in a firm) and hard skills (the ones expected in the
occupation).9 Applicants are young males aged 18 at the beginning of applications and 19
at the end. We focus on men because the majority of cooks and bricklayers are male. Their
names were chosen among those most commonly found in the French population. According
to the Fichiers des prénoms (INSEE), the two first names used in the experiment, Théo and
Alexis, were respectively the 9th and 13th most popular first names in 1999.10 The surnames,
Petit and Dubois, were respectively ranked 6 and 7, according to the Fichier patronymique
(INSEE).11 Thus our applicants, Alexis Dubois and Théo Petit, have names that are too
general for them to be identified on the Internet. All in all, we chose these characteristics to
avoid spurious correlations with our different labor market experiences profiles, so that there
is no gender, age or ethnicity discrimination. Except for “Inactive” dropouts who have never
worked as a cook or bricklayer, there is no signaling of difference in skills.
Applicants’ addresses were chosen to be in the center of whatever city is the administrative
capital (préfecture) of the department in which the job was posted, in order to ensure that
candidates live sufficiently close to their potential future job and to avoid geographic discrim-
ination.12 Since the diploma is national, there is no information about the school or about
the specific training center, as usual in resumes for this type of application. The address of
training firms where graduates and dropouts worked during their professional experience is
not provided, in order to avoid detection of fictitious applications. These training firms are
large well-known firms (Flunch and Hyppopotamus for food services and Bouygues Construc-
tion and Lafarge for construction)13 for which the address of the establishment where one has
been employed is not usually mentioned.
Moreover, we did not emphasize their dropping out after middle school, as advised by
caseworkers helping this population. We mentioned only in their cover letters that “Work-
ers” and “Trained Workers” did their professional experience through a subsidized contract.
Finally, we pre-submitted our fictitious applications in cool and bricklayer positions to real
actors - such as workers and caseworkers - to ensure credibility.
9
These skills were taken from the fiches métiers Pôle emploi. Occupation-related hobbies are cooking,
pastry, international cuisine for cook, and DIY for bricklayer. Other hobbies are cinema, sport, handball,
music. More details here for cooks and here for bricklayers.
10
The first-names were chosen randomly among the top 20.
11
The same method was done for surnames.
12
Addresses were collected and verified through Google Street View.
13
We made sure by looking at their website that these firms were present in all the French departments and
that they were used to hiring people, whether apprentices, vocational students, trainees or temporary workers.
9III.D The applications
All applications included a resume and a cover letter. They were accompanied by a short email
message. We sent two applications to each job vacancy in order to increase statistical power.
Accordingly, two templates were created first to avoid detection by the firm, and second to
ensure that callbacks did not depend on employers’ preferences for a given presentation.14
The templates were based on different samples taken from the Pôle emploi CVthèque,15 a
youth center sample, and Google searches. The cover letters each contained five paragraphs.
The letters were written in a similar way to avoid any apparent differences in literacy between
the two templates.16
Job offers for both occupations were mainly identified using the Pôle emploi website.17
Applications were sent only when it was possible to contact the recruiter directly by email.
Therefore job offers issued by temporary work agencies or other intermediaries were not
considered. Moreover, the same recruiter could never be contacted more than once, even if
he posted different job positions in different French areas throughout the entire experiment
period.18 The same applied for offers providing only a Pôle emploi counselor email address.
If a job vacancy met these criteria, one (and only one) pair of applications was sent. The
name of the applicant, the applicant profile, and the layout type were all selected at random.
To further avoid detection by the firm, one profile among {“Workers”, “Trained Workers”}
on the one hand and one profile among {“Graduates”, “Trainees”, “Inactives”} on the other
were drawn randomly. Thus a given recruiting firm cannot receive two applications sharing
the same name, layout or profile.
III.E Data collection
In total, 10,938 applications were sent from 22 January 2018 to 13 July 201819 . This sample
size largely satisfied our power calculations. The overall sample size was chosen to detect
a minimum effect of ±0.025 between the baseline callback rate of “Graduates” and that of
“Dropouts”, at a 5% significance level and power of 80%, using the formula in Djimeu and
14
See appendix A.2 for examples of resumes and cover letters.
15
This public databank is available to help recruiters in selecting different available profiles. More details at
https://www.pole-emploi.fr/employeur/consultez-librement-des-cv-de-candidats.
16
We checked that the different profiles were not correlated with the layout types so as to avoid the potential
issue of template bias, addressed in Lahey and Beasley (2009).
17
A few private job search websites, such as Le Bon Coin or Indeed were also used when the number of offers
available on the Pôle emploi platform was too low on a given day.
18
We also used the spontaneous applications channel to improve the validity of our results, such as discussed
in Section V.B with more than 10,000 applications.
19
The number of applications per profile differs because of different sub-items within each profile in order
to avoid firm detection and to increase internal validity. Moreover, we were able to collect some firm and job
characteristics posted on 5,150 job offers thus allowing us to fully use 10,300 applications.
10Table II
Randomization Tests
Dropouts
Graduates
Inactives Trainees Workers Trained Workers
(1) (2) (3) (4) (5) (6) (7) (8) (9)
Sample Sample p-value Sample p-value Sample p-value Sample p-value
mean mean (2)-(1) mean (4)-(1) mean (6)-(1) mean (8)-(1)
Number of observations 3,110 799 1,560 3,673 1,796
Cook (vs bricklayer) .8173 .7997 .2541 .7967 .0908 .8042 .1699 .8184 .9219
For-profit (vs not-for-profit) .9497 .9495 .9831 .9400 .1714 .9474 .6742 .9459 .5702
Primary sector .0006 .0013 .5800 .0020 .2066 .0017 .2353 .0000 .2871
11
Secondary sector .0003 .0000 .6122 .0013 .2214 .0008 .4015 .0000 .4466
Tertiary sector .8398 .9213 .2189 .8160 .0450 .8242 .0956 .8426 .7951
Construction sector .1591 .1773 .2253 .1806 .0695 .1731 .1320 .1573 .8658
Small firm (vs large firm) .6143 .6181 .8578 .6044 .5500 .6068 .5609 .6230 .5823
Permanent contract (vs temporary) .4140 .4040 .6082 .4006 .3807 .4157 .8861 .3944 .1783
Full-time job (vs part-time job) .9368 .9446 .4156 .9420 .4851 .9386 .7665 .9412 .5375
< 1-year required experience .3541 .3906 .0568 .3526 .9202 .3661 .3073 .3444 .4984
= 1-year required experience .2228 .1871 .0295 .1990 .0648 .2064 .1033 .2198 .8108
> 1-year required experience .4230 .4222 .9671 .4482 .1035 .4274 .7192 .4356 .3931
Male recruiter (vs female) .6174 .6259 .6638 .6358 .2297 .6196 .8528 .6327 .2974
Note: This table reports means across sub-samples of the experimental sample and presents simple randomization tests based on comparing the means across the
sub-samples.Houndolo (2016).20 We then made sure that the job offer characteristics were not correlated
with the different profiles. Table II provides such randomization tests with differences in
means. It appears that with very few exceptions the randomization was successful, thus
making our subsequent treatment estimates unbiased.
Replies from recruiters were collected up to the last recorded phone call and email message
on 10 October 2018. A reply from a recruiter who stated that he did not select the application
for the job vacancy is classified as a negative callback, along with the absence of callback.
Any other reply is considered as a positive callback. Then, we consider two categories of
positive callbacks. First, “positive callbacks”, which include interview or hiring propositions
and requests for further information. Requests for further information could be quite vague,
such as ”Please, call me back ”. They could also ask for more precise information about the
candidates’ training or experience, their means of transport when the job was located some
way from the candidates’ address, and so on. We interpret these types of callback as positive,
since it is likely that they are motivated by the recruiter’s potential interest in the candidate.
Second, we use the category “propositions” for callbacks which offer an interview or hiring.
When recruiters provided a positive answer to an application and invited the applicant to
an interview or requested additional information about the application, an email was sent to
thank them and inform them that the applicant had signed a labor contract with another
employer.
IV Results
Table III presents our two main outcome variables by occupation for the different profiles. It
emerges that positive callback rates are about 27% for “Graduates” and 23% when restricting
to interview propositions. There are statistically significant callback rate differences between
“Graduates” and all “Dropouts”, whose callback rates are lower.
IV.A The lower callback rates of school dropouts
To analyze more extensively the callback rate differences, we estimate the following linear
probability model with Ordinary Least Squares (OLS) estimators:
yij = α + βk Ti=k + x0j γ + εij (1)
where yij is a dummy variable equal to one if applicant i gets called back for job j. Ti=k
20
n The formula isobased on the Normal distribution assumption of the error term which leads to: n =
P 1−P
T δ 2 1−T
(t1 + t2 )2 , where n is the sample size, δ ∈ [0.02, 0.05] is the minimum detectable effect, t1 = 1.96
is the t-value for a 5% significance level, t2 = 0.84 is the t-value for a power of 80%, P ∈ [0.07, 0.10] is the
proportion of the study population that would get a callback in the absence of treatment (based on previous
experiments), and T = 0.5 is the proportion of individuals randomly assigned to the treatment group.
12Table III
Callback Rates Descriptive Statistics by Profile
Dropouts
Graduates
All Inactives Trainees Workers Trained Workers
(1) (2) (3) (4) (5) (6) (7) (8) (9) (10) (11)
All
# Observations 3,110 7,828 799 1,560 3,673 1,796
Positive Callback .2787 .2124 -.0663*** .1001 -.1786*** .2185 -.060*** .2104 -.0683*** .2611 -.0176
(.008) (.004) (.008) (.010) (.016) (.010) (.013) (.005) (.010) (.010) (.013)
Proposition .2337 .1748 -.0588*** .0763 -.1574*** .1769 -.0568*** .1747 -.0589*** .2171 -.0166
(.007) (.004) (.008) (.009) (.015) (.009) (.012) (.006) (.009) (.009) (.012)
Cook
# Observations 2,542 6,306 639 1,243 2,954 1,470
13
Positive Callback .2883 .2201 -.0682*** .1048 -.1835*** .2276 -.0606*** .2183 -.070*** .2673 -.0210
(.008) (.005) (.010) (.012) (.018) (.011) (.015) (.007) (.011) (.011) (.014)
Proposition .2423 .1817 -.0605*** .0782 -.1640*** .1818 -.0605*** .1831 -.059*** .2238 -.0185
(.008) (.004) (.009) (.010) (.017) (.010) (.014) (.007) (.011) (.010) (.013)
Bricklayer
# Observations 568 1,522 160 317 719 326
Positive Callback .2359 .1806 -.0552*** .0812 -.1546*** .1829 -.0529* .1780 -.0578** .2331 -.0027
(.017) (.009) (.019) (.021) (.035) (.021) (.028) (.014) (.022) (.023) (.029)
Proposition .1954 .1465 -.0489*** .0687 -.1266*** .1577 -.0376 .1404 -.0549*** .1871 -.0083
(.016) (.009) (.017) (.020) (.033) (.020) (.027) (.012) (.020) (.021) (.027)
Note: This table reports the number of observations per profile and the mean value of the primary dependent variables. A positive callback is equal to one if the fictitious
candidate received a demand for complement information or a proposition for interview or hiring. Proposition corresponds to callbacks which propose an interview or hiring.
Standard error of the mean is reported in parentheses below the mean. Columns (1), (2), (4), (6), (8), and (10), report the mean callback rate for each profile. While columns
(3), (5), (7), (9), and (11), report the mean difference with column (1). * significant at 10 percent, ** significant at 5 percent, *** significant at 1 percent, for p-values
associated with the test H0 : {∆ = callback[graduates] - callback[dropouts] = 0} vs H1 : {∆ 6= 0}.Table IV
Effects of Labor Market Experiences on Callbacks
All Applicants Cook Bricklayer
Positive Callbacks
(1) (2) (3) (4) (5)
Inactive -0.1854*** -0.1874*** -0.1861*** -0.1955*** -0.1576***
(0.0137) (0.0137) (0.0137) (0.0155) (0.0297)
Trainee -0.0661*** -0.0684*** -0.0648*** -0.0696*** -0.0423
(0.0136) (0.0135) (0.0134) (0.0151) (0.0293)
Worker -0.0748*** -0.0767*** -0.0754*** -0.0786*** -0.0605***
(0.0095) (0.0095) (0.0094) (0.0106) (0.0211)
Trained Worker -0.0215* -0.0208* -0.0197* -0.0260** 0.0045
(0.0120) (0.0118) (0.0117) (0.0131) (0.0265)
Graduate mean 0.2847*** 0.2847*** 0.2847*** 0.2944*** 0.2410***
(0.0084) (0.0084) (0.0084) (0.0093) (0.0187)
Observations 10,300 10,300 10,300 8,348 1,952
R-squared 0.0136 0.0433 0.0576 0.0594 0.1210
Dep. & Month FE No Yes Yes Yes Yes
Job Characteristics No No Yes Yes Yes
Note: The dependent variable is a dummy variable equal to one if the application gets a positive callback. Positive callback
corresponds to cases in which the fictitious candidate received a request for complementary information or a proposition for
interview or hiring. Department and month fixed effects are demeaned dummies. Job characteristics include dummies for the type
of contract, working time, years of professional experiences, and gender of the recruiter. All columns report OLS linear probability
model estimates. Robust standard errors are clustered at the firm level and reported below the coefficients. * significant at 10
percent, ** significant at 5 percent, *** significant at 1 percent.
is a dummy variable equal to one if applicant i is a school dropout of a particular profile
k ∈ {Inactive, Trainee, Worker, Trained Worker} as depicted in Section III.A. xj is a vector
of control variables with department and month fixed effects, and job characteristics. These
control variables are introduced as demeaned dummies. εij is a residual term, orthogonal to
treatment regressors thanks to randomization. Turning to parameters, βk is of interest and
measures the callback rates differences with “Graduate” for each profile k.
The OLS estimates of equation (1) are reported in Table IV.21 The three first columns
report the estimates for occupations pooled together, for different specifications including de-
partment and month fixed effects in column (2), and job characteristics in column (3), for
“positive callbacks”.22 It is clear that depending on what type of labor market experience
a dropout had, the probability of callback differs. The results, which are very stable across
specifications, confirm the presence of statistically different callback rates between “Gradu-
ates” and “Inactive” dropouts of about -18 percentage points. Given the average callback
rate in column (1) (≈ 28%), dropping out of school before graduation and remaining NEET
reduces the probability of having a positive callback by 67%. Column (4) displays the results
for cooks and column (5) for bricklayers. Once again, the estimates of the βk=Inactive param-
21
To address concerns about non-linear effects, we report the results of Table A.3.1 replacing the OLS (linear
probability) model with a Probit model in Appendix A.3. The Probit results show that the estimated marginal
effects are very similar to the OLS results. This similarity holds for all results in the paper.
22
The results also hold when considering the more restrictive definition of callback “propositions” as presented
in Table A.3.2 in Appendix A.3.
14eter are statistically different from zero and are of the same order of magnitude. However,
this negative sign associated with inactivity can be reduced by active labor market policies,
at least partially. Accordingly, it appears that seven months vocational training leading to a
certificate, or a one-year subsidized contract, reduces the negative sign of dropping out with
the same order of magnitude, i.e. by three, going -18 pp to -6 pp comparing with “Gradu-
ates”. In other words, the probability of callback of “Trainee” and “Worker” dropouts still
remains lower than for “Graduates”, by ≈ 25%. More interestingly, work experience gained
through a one-year subsidized contract and certified by a state diploma after complementary
vocational training improves the dropout likelihood almost to the same level as those who
graduated. The probability of being called back for a job for “Trained Workers” is only 8%
less than that of “Graduates”. This difference is noteworthy and entirely driven by cooks, as
there is a statistically non-significant difference with “Graduates” in the case of bricklayers.
Compared with the baseline callback rate, this difference would be economically negligible if
it were statistically significant.23
IV.B Training and experience as partial compensations only
While Table IV presented the effects of labor market experiences on all callback rates, here
we take advantage of the fact that each firm received two random applications per job va-
cancy in our setting. We look at firms which responded to only one profile, thus looking
at within-posting variation. Among the 5,469 firms who received two applications, 20% of
them responded to only one profile.24 Although firms could have received more than our two
applications for their job vacancies, Table V gives a second view on the ranking of profiles by
recruiters.
Table V presents the same specifications as in Table IV. We additionally control for the
pair of resumes sent to a specific job offer.25 The difference in the probability of being
called back among dropout profiles and graduates remains qualitatively similar to that for
between-posting variation. However the gap between the probability of being called back for
a job offer for “Graduates” and every type of “Dropouts” has increased. Indeed, the baseline
callback rate for “Graduates” is now about 73% and the absolute decline for “Trained Worker”
dropouts is -18 pp. It represents a decrease in the probability of about -25%, which is higher
than the 8% percent difference overall as presented in Section IV.A. When applying the same
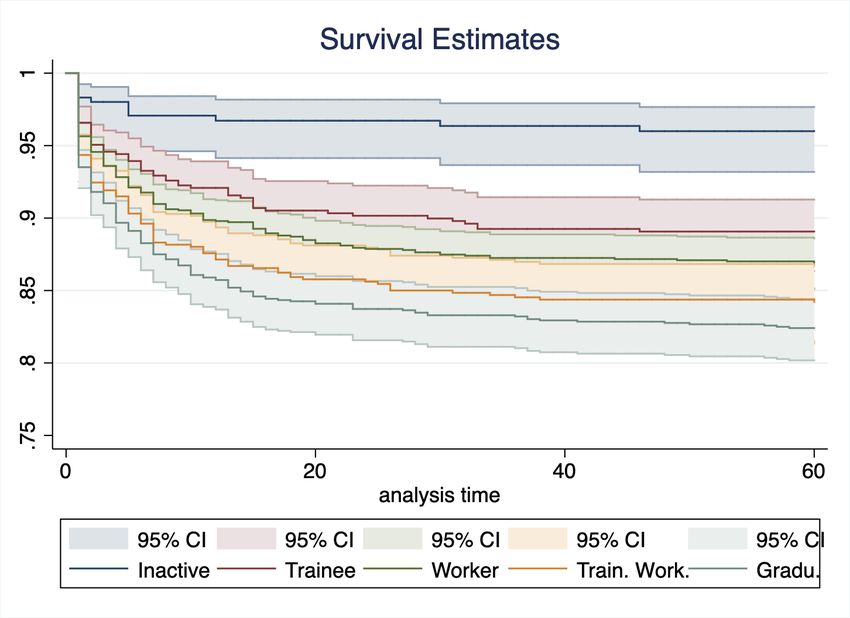
23
This result is also valid when one looks at the survival rate of an application as depicted in Figure A.3.1
in Appendix A.3. “Graduate” and “Trained Worker” applications received more callbacks sooner and for a
longer period of time than of “Inactive”, “Trainee” and “Worker” applications.
24
67% of firms did not respond to any profile, while 13% responded to both.
25
Recall that one feature of our correspondence study was to send one profile among the pool {“Workers”,
“Trained Workers”} on the one hand and one profile among {“Graduates”, “Trainees”, “Inactives”} on the
other, randomly in first or second position, to avoid firm detection. As a consequence, all the profiles are not
paired with one another. We then control for this feature in Table V by adding dummy variables for each pair
sent.
15Table V
Effects of Labor Market Experiences using Within-Posting Variation
All Applicants Cook Bricklayer
Positive Callbacks
(1) (2) (3) (4) (5)
Inactive -0.9054*** -0.9052*** -0.9052*** -0.9355*** -0.7444***
(0.0756) (0.0775) (0.0776) (0.0855) (0.2422)
Trainee -0.2864*** -0.2862*** -0.2862*** -0.3214*** -0.1028
(0.0708) (0.0725) (0.0726) (0.0806) (0.2179)
Worker -0.2927*** -0.2925*** -0.2925*** -0.3142*** -0.1802
(0.0435) (0.0446) (0.0447) (0.0491) (0.1391)
Trained Worker -0.1774*** -0.1772*** -0.1772*** -0.1941*** -0.0713
(0.0599) (0.0614) (0.0615) (0.0679) (0.1928)
Graduate mean 0.7293*** 0.7293*** 0.7293*** 0.7417*** 0.6727***
(0.0295) (0.0302) (0.0302) (0.0335) (0.0922)
Observations 2,140 2,140 2,140 1,776 364
R-squared 0.0997 0.0999 0.0999 0.1081 0.0752
Resume Couple Yes Yes Yes Yes Yes
Dep. & Month FE No Yes Yes Yes Yes
Job Characteristics No No Yes Yes Yes
Note: The variation in profile treatment within job posting in each round provides the opportunity to examine within-posting
variation in callback rates by profile treatment. The dependent variable is a dummy variable equal to one if the application gets
a positive callback. Positive callback corresponds to cases in which the fictitious candidate received a request for complementary
information or a proposition for interview or hiring. “Resume Couple” are demeaned dummy variables controlling for the pair
of resumes sent to one job offer and the order of each resume (whether first or second). Department and month fixed effects are
demeaned dummies. Job characteristics include dummies for th e type of contract, working time, gender of the recruiter, and years
of professional experience. All columns report OLS linear probability model estimates. Robust standard errors are clustered at
the firm level and reported below the coefficients. *** significant at 1 percent.
reasoning to other profiles, we find higher drops in the probability of callback than overall,
whether applications are pooled or split by occupation. When we consider only “proposition”
callbacks as shown in Table A.3.3 in Appendix A.3, the magnitudes of callback differences
remain quite similar. This result implies that when it comes to selecting candidates within a
given pool of applicants, firms tend to be less favorable towards school dropouts.
IV.C The effects of firm characteristics
So far, we have found that only dropouts who had performed in the targeted occupations
through a subsidized contract associated with certified training could match freshly graduated
students or apprentices for different job offers on average. Yet the differences in callback rates
between “Graduates” and all kinds of “Dropouts” could be heterogeneous depending on firm
characteristics. For instance, it could be that firms which seek profits need more readily skilled
workers and discriminate more against dropouts with skills obtained in the classroom than not-
for-profit firms. It could also be that case that small firms have less opportunity to provide
on-the-job training than large firms because of tighter financial constraints, thus favoring
applicants with professional experience. Or it could be that large firms have centralized a
human resources platform and receive more applications, thus favoring applicants with more
theoretical skills signaling competences other than just the one needed for the job tasks. In
16Table VI
Probability of Callbacks given Firm Characteristics
Firm Type Firm Size
Positive Callbacks For-Profit Not For-Profit Small Large
(1) (2) (3) (4)
Inactive -0.1787*** -0.3129*** -0.1631*** -0.2303***
(0.0147) (0.0467) (0.0189) (0.0241)
Trainee -0.0697*** -0.0926* -0.0682*** -0.0744***
(0.0143) (0.0532) (0.0184) (0.0244)
Worker -0.0683*** -0.1780*** -0.0580*** -0.1122***
(0.0100) (0.0367) (0.0131) (0.0167)
Trained Worker -0.0243** 0.0113 -0.0104 -0.0220
(0.0123) (0.0501) (0.0157) (0.0218)
Graduate mean 0.2814*** 0.3450*** 0.2714*** 0.3191***
(0.0088) (0.0337) (0.0113) (0.0151)
Observations 9,206 732 5,392 3,396
R-squared 0.0439 0.2630 0.0547 0.0852
Department & Month FE Yes Yes Yes Yes
Note: The dependent variable is a dummy variable equal to one if the application gets a positive callback. Positive callback
corresponds to cases in which the fictitious candidate received a request for complementary information or a proposition for
interview or hiring. For-profit firms are firms which sell products or services for profits. Small firms are firms with at most
10 employees. Department and month fixed effects are demeaned dummies. All columns report OLS linear probability
model estimates. Robust standard errors are clustered at the firm level and reported below the coefficients. * significant
at 10 percent, ** significant at 5 percent, *** significant at 1 percent.
addition, not for-profit firms, like large firms, might favor applicants who have a certificate,
signaling more transferable skills than applicants who only possess professional experience in
the occupation.
Table VI first presents the callback rate differences between profiles for for-profit and
not for-profit firms in columns (1) and (2) respectively. Even though, most of our sample
is constituted by for-profit firms which drive the overall results, it appears that not-for-
profit firms issue fewer callbacks to applicants without any diploma. The probability of
positive callback then decreases by almost 90% for “Inactive” dropouts and by around 50%
for “Workers”. On the other hand, dropouts who signal a CAP diploma after dropping out
of school have lower callback rates than “Graduates” but they have better chances than the
other dropouts, especially those who combined vocational training with work experience. To
some extent this pattern is the same when decomposing firms by size into small firms versus
large firms in columns (3) and (4) respectively.26 Large firms seem to consider applicants
without skills certified by any diploma to a lesser extent than applicants who do. Tables
A.3.4 and A.3.5 in Appendix A.3 indicate similar results for cooks and not that much for
bricklayer positions, probably because of too few observations.
26
Because of noise in our firm size variable obtained from job ads, we define small firms as small when they
have fewer than 10 employees and large firms otherwise.
17Table VII
Probability of Callbacks given Contract Characteristics
Type of Contract Required Experience
Positive Callbacks Temporary Permanent ≤ 1y > 1y
(1) (2) (3) (4)
Inactive -0.1990*** -0.1701*** -0.2393*** -0.1222***
(0.0185) (0.0199) (0.0195) (0.0191)
Trainee -0.0707*** -0.0699*** -0.0798*** -0.0483***
(0.0181) (0.0203) (0.0193) (0.0180)
Worker -0.0858*** -0.0647*** -0.0949*** -0.0504***
(0.0126) (0.0143) (0.0132) (0.0133)
Trained Worker -0.0222 -0.0210 -0.0183 -0.0246
(0.0155) (0.0180) (0.0165) (0.0163)
Graduate mean 0.3045*** 0.2570*** 0.3420*** 0.2062***
(0.0111) (0.0126) (0.0115) (0.0115)
Observations 6,060 4,240 5,856 4,444
R-squared 0.0585 0.0560 0.0571 0.0490
Department & Month FE Yes Yes Yes Yes
Note: The dependent variable is a dummy variable equal to one if the application gets a positive callback. Positive
callback corresponds to cases in which the fictitious candidate received a request for complementary information or a
proposition for interview or hiring. “1y” stands for one year’s experience in the occupation. Department and month
fixed effects are demeaned dummies. All columns report OLS linear probability model estimates. Robust standard
errors are clustered at the firm level and reported below the coefficients. *** significant at 1 percent.
IV.D The effects of contract characteristics
Callback rate differences among profiles could also be heterogeneous given contract charac-
teristics. Firms that recruit under seasonal or temporary contracts might need operational
workers and favor applicants with more practical job-related skills compared to applicants
who stayed inactive or had vocational training only. Accordingly, firms which offer a perma-
nent contract could be more willing to create a long-term match with their employee when
more theoretical skills would be valued more than practical skills if the task contents of the
job change. Another important feature for filling the vacancy is the amount of professional
experience required by firms. Firms which request previous professional experience in the
occupation could be more reluctant to call back applicants whose maximum experience is
two years for “Graduates”, one year for “Workers” and “Trained Workers”, few weeks for
“Trainees”, and none for “Inactive” dropouts.
Table VII reports the callback rates for temporary contracts in column (1) and permanent
contracts in column(2), and for jobs with at most one year experience in the occupation in
column (3) and more than one year of experience in column (4). With regard to the type of
contract, there is no major difference in callback profiles between temporary and permanent
contracts, and overall results. Turning to the required experience asked for by the firm in
the occupation, the first apparent and expected element is the lowering of baseline callback
18for “Graduates” when experience required increases, falling from 34% when less than one
year or equal of experience is required to 21% when more than one year is required. In our
setting, “Trainee” applicants have a maximum of two-months on-the-job training during their
vocational training, whereas both “Worker” and “trained Worker” applicants have a year’s
professional experience. Yet estimates point to a difference in callback rates similar to overall
results when compared to the baseline callback rate of “Graduates”. This can be viewed as
proof that signaling a diploma matters more when it is associated with longer period in firms
than with brief periods only. Tables A.3.6 and A.3.7 in Appendix A.3 show similar results for
both cook and bricklayer positions.
All in all, whatever the occupation, the specification and the sub-sample, our results point
to a clear ranking of youth profiles by employers:
Inactives
| ≺ Workers ≈ Trainees
{z ≺ Trained Workers} Graduates
Dropouts
V Robustness checks
We confirm the results obtained in the audit correspondence study through a battery of
robustness checks, in particular by adding external information to our database and exploring
a second channel of application.
V.A Additional information
We first test our results by adding external information to our database, especially two new
variables, namely the distance to the job location and the unemployment rate in the firm’s
commuting zone.27
For each job vacancy that received an application, we recorded the location of the job.
Since, as stated in III.C, each applicant lives in the city that is the administrative center of
the department where the job vacancy was posted. We were able to determine the distance
in kilometers between the applicant’s place of residence and the job location. In our sample,
the distance to a job location ranges from 0.04 km to 299.25 km. The mean distance is 31.5
km. We also consider the quarterly unemployment rate in the commuting zone in which
firms operate. Since the official unemployment rate by commuting zone is available quarterly,
and since our experiment ran from January to July 2018, we link either the first-quarter or
second-quarter unemployment rate to each profile-commuting zone pair, depending on the
time of application. In our sample, the unemployment rate ranges from 4.4% to 16.8%. The
27
A commuting zone is a geographic area determined by the French national statistic institute (INSEE),
inside which most of the active agents live and work. We were able to collect information on these two
variables for about 90% of our sample, because of reported errors in firm locations.
19Table VIII
Probability of Callbacks with Interacted Additional Information
All Applicants Cook Bricklayer
Positive Callbacks
(1) (2) (3) (4) (5)
Job Distance (km) -0.0475 -0.0458 -0.0653** -0.0799** 0.0066
(0.0292) (0.0292) (0.0290) (0.0315) (0.0740)
Unemployment Rate (%) -0.0191*** -0.0191*** -0.0175*** -0.0191*** -0.0101
(0.0044) (0.0044) (0.0044) (0.0050) (0.0093)
Inactive -0.1978*** -0.1988*** -0.1988*** -0.2110*** -0.1509***
(0.0153) (0.0153) (0.0152) (0.0171) (0.0356)
Inactive × Job Dist. 0.0720 0.0715 0.0548 0.0522 0.0850
(0.0610) (0.0612) (0.0601) (0.0644) (0.1735)
Inactive × Unemp. Rate 0.0140* 0.0139* 0.0152** 0.0153* 0.0151
(0.0077) (0.0077) (0.0077) (0.0087) (0.0151)
Trainee -0.0763*** -0.0773*** -0.0742*** -0.0791*** -0.0527
(0.0151) (0.0151) (0.0149) (0.0167) (0.0332)
Trainee × Job Dist. 0.0885 0.0863 0.0706 0.0949 -0.0664
(0.0554) (0.0553) (0.0548) (0.0596) (0.1396)
Trainee × Unemp. Rate -0.0012 -0.0011 0.0008 0.0004 0.0038
(0.0074) (0.0074) (0.0074) (0.0082) (0.0167)
Worker -0.0823*** -0.0828*** -0.0819*** -0.0858*** -0.0603***
(0.0105) (0.0105) (0.0104) (0.0117) (0.0231)
Worker × Job Dist. 0.0639** 0.0627** 0.0566* 0.0737** -0.0369
(0.0308) (0.0307) (0.0306) (0.0334) (0.0770)
Worker × Unemp. Rate 0.0043 0.0043 0.0048 0.0016 0.0194*
(0.0049) (0.0049) (0.0048) (0.0055) (0.0101)
Trained Worker -0.0253* -0.0259** -0.0253* -0.0321** 0.0048
(0.0131) (0.0131) (0.0129) (0.0144) (0.0303)
Trained Worker × Job Dist. 0.0270 0.0261 0.0234 0.0230 0.0220
(0.0424) (0.0423) (0.0416) (0.0453) (0.1048)
Trained Worker × Unemp. Rate -0.0016 -0.0017 -0.0008 0.0040 -0.0224
(0.0065) (0.0065) (0.0065) (0.0073) (0.0145)
Constant (≈ Graduate mean) 0.3025*** 0.3030*** 0.3021*** 0.3130*** 0.2444***
(0.0092) (0.0092) (0.0091) (0.0109) (0.0216)
Observations 8,600 8,600 8,600 7,024 1,576
R-squared 0.0222 0.0246 0.0453 0.0472 0.0470
Month FE No Yes Yes Yes Yes
Job Characteristics No No Yes Yes Yes
Note: The dependent variable is a dummy variable equal to one if the application gets a positive callback. Positive
callback corresponds to cases in which the fictitious candidate received a request for complementary information or a
proposition for interview or hiring. “Job Distance” is a demeaned continuous variable in kilometers. “Unemployment
Rate” is a demeaned continuous variable of the ratio of individuals seeking for jobs over the labor force by commuting
zone. Department and month fixed effects are demeaned dummies. Job characteristics include demeaned dummies for
the type of contract, working time, gender of the recruiter, and years of professional experiences. All columns report
OLS linear probability model estimates. All columns report OLS linear probability model estimates. Robust standard
errors are clustered at the department level and reported below the coefficients. * significant at 10 percent, ** significant
at 5 percent, *** significant at 1 percent.
20You can also read