Draft Climate Response Plan 2021-2031 - Knox City Council
←
→
Page content transcription
If your browser does not render page correctly, please read the page content below
Draft Climate Response Plan 2021-2031
Draft Climate Response Plan 2021-2031
(Version 2 – February 2021)

Contents
1.      Introduction ........................................................................................................................................................ 3
2.      Climate Response Planning .................................................................................................................................. 5
     2.1 Sustainable Development Goals ........................................................................................................................ 5
3.      Technical and Scientific Summary ........................................................................................................................ 7
     3.1 Climatic Trends .................................................................................................................................................. 7
     3.2 Knox City Council Emissions ............................................................................................................................... 9
     3.3 Knox Community Emissions ............................................................................................................................. 11
     3.4 Carbon Emissions Reduction Goals .................................................................................................................. 11
     3.5 Knox’s Carbon Budget...................................................................................................................................... 12
4.      The Economics of Climate Action ....................................................................................................................... 14
     4.1 COVID-19 and Climate Action .......................................................................................................................... 14
     4.2 Investment Appetite ........................................................................................................................................ 14
5.      Climate Risk Assessment ................................................................................................................................... 16
6.      Our Community ................................................................................................................................................. 18
     6.1 Vulnerable and General Populations ................................................................................................................ 18
7.      Our Natural and Built Environment.................................................................................................................... 22
     7.1 Biodiversity ..................................................................................................................................................... 22
     7.2 Green & Leafy Streets ...................................................................................................................................... 23
     7.3 Active Transport .............................................................................................................................................. 25
8.      Our Council ....................................................................................................................................................... 26
     8.1 Energy ............................................................................................................................................................. 26
     8.2 Buildings and Facilities..................................................................................................................................... 26
     8.3 Infrastructure .................................................................................................................................................. 27
     8.4 Waste Management ........................................................................................................................................ 29
9.      Guiding Principles .............................................................................................................................................. 31
10. Action Plan ........................................................................................................................................................ 33
11. Monitoring, Evaluation, Review and Learning ................................................................................................... 41
     11.1 Progress Monitoring ...................................................................................................................................... 41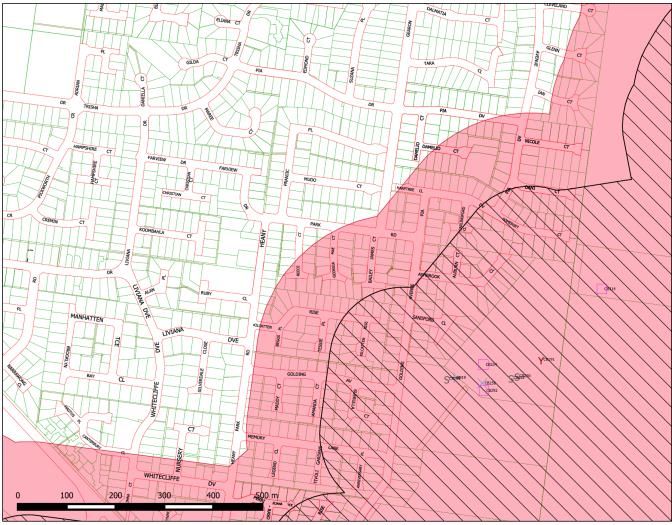
11.2 Impact Monitoring ......................................................................................................................................... 41
   11.3 Evaluation Trigger .......................................................................................................................................... 41
   11.4 Evaluation, Review and Learning ................................................................................................................... 42
12. References ........................................................................................................................................................ 43
Appendix A - Detail for Proposed Action Plan Interventions ...................................................................................... 45

Tables
Table 1: Council’s Carbon Emissions from all scopes 2015 to 2020 ............................................................................ 10
Table 2: Knox Community Emissions 2017 – 2019 (Source: Snapshot Climate) ........................................................... 11
Table 3: Scaled science-derived target for City of Knox .............................................................................................. 12
Table 4: Summary of proposed corporate and community actions. ........................................................................... 33
Table 5: Summary of corporate mitigation actions .................................................................................................... 34
Table 6: Summary of community mitigation actions .................................................................................................. 36

Figures
Figure 1: The Sustainable Development Goals (Source: United Nations) ...................................................................... 6
Figure 2: BOM 2019 and 2020 (respectively) annual mean temperatures compared to historical temperature
observations. .............................................................................................................................................................. 7
Figure 3: DELWP Victoria's Climate Science Report 2019 ............................................................................................. 8
Figure 4: DELWP Victorian Climate Projections 2019 Technical Report ........................................................................ 9
Figure 5: Average annual temperatures for Knox, Scoresby Weather Station 1965 - 2019 ........................................... 9
Figure 6: Carbon Emissions from Council’s buildings and fleet. Scope 1, 2 and 3. ...................................................... 10
Figure 7: Knox emissions vs EAGA average, tonnes per capita 2017. .......................................................................... 11
Figure 8: Representation of City of Knox's municipal science-derived target if used linearly ...................................... 13
Figure 9: Heat vulnerability map Knox ....................................................................................................................... 18
Figure 10: Number of households participating in Knox Gardens for Wildlife............................................................. 23
Figure 11: Tree cover as a percentage of total area 2018........................................................................................... 23
Figure 12: Percentage of change in tree canopy, 2014-2018 ...................................................................................... 24
Figure 13: Urban Heat Island effects in Knox 2018 ..................................................................................................... 24
Figure 14: Residences within 400m of public open space, 2018 ................................................................................. 25
Figure 15: Bushfire prone assets Boronia/Basin and Bayswater (respectively) ........................................................... 28
Figure 16: Bushfire prone assets Rowville.................................................................................................................. 29
Figure 17: Waste to landfill kilograms per household ................................................................................................ 30
Figure 18: Business-as-Usual GHG Emissions trajectory, including reductions from actions ....................................... 34
Figure 19: GHG Emissions Pathway: Efficiency Actions and Renewable Energy .......................................................... 48
Figure 20: Estimated impact of interventions for low emissions buildings through design in Knox ............................. 51
Figure 21: Estimated impact of facilitation of industrial working groups intervention in Knox .................................... 54
Figure 22: Estimated impact of industrial education intervention in Knox.................................................................. 54
Figure 23: Estimated impact of solar installation intervention in Knox ....................................................................... 57
Figure 24: Estimated impact of EV charging interventions in Knox ............................................................................. 60
Figure 25: Estimated impact of mode shift to car share services interventions in Knox .............................................. 62
Figure 26: Estimated impact of sustainable road building intervention in Knox .......................................................... 65

                                                                                                                                                                            2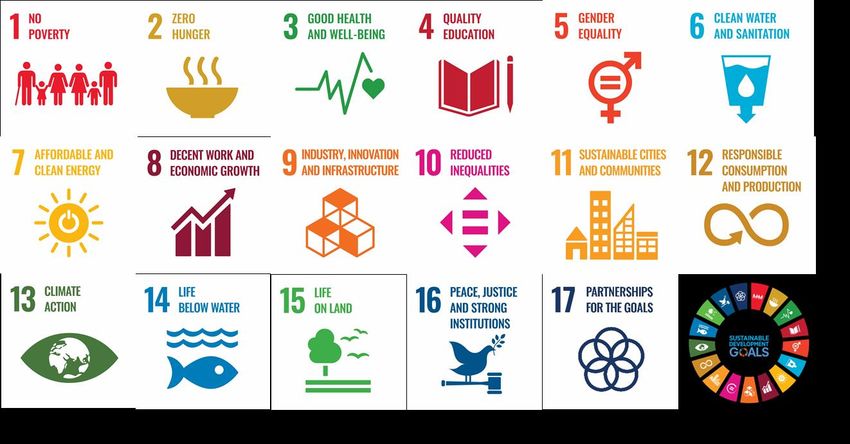
1. Introduction
In late 2019, Knox City Council reaffirmed its commitment to taking urgent action on climate change and committed
to commence developing a new Climate Response Plan in 2020.
The Knox Climate Response Plan (CRP) delivers a pathway to an emissions neutral Knox City Council by 2030 and sets
ambitious interim targets. It demonstrates how Knox will adapt and improve its resilience to the climate hazards
that impact the city now and in future climate scenarios. The CRP outlines the social, environmental and economic
benefits expected from implementing the Plan in line with the United Nations Sustainable Development Goals and
details Council’s governance, powers, and the partners who need to be engaged in order to accelerate the delivery of
Knox's mitigation targets and resilience goals.
Public input was sought during the development of this Plan in order to ensure the thoughts and needs of our
community were identified and included. This included communicating directly with the public at the Knox Festival
prior to the COVID-19 lockdown, and thereafter through online engagement with each Council Advisory Committee
to explain the approach to developing the CRP and to ask for input on what impacts and concerns each
representative group has around climate change. Additionally, feedback was sought on what each Advisory
Committee felt was important for Council to consider when developing an Action Plan. This feedback has been
incorporated into all relevant sections of this Plan.
A concurrent step in the development of the CRP was the completion of a municipal-wide climate risk assessment to
better understand, manage and respond to the changing frequency, severity, and scale of climate hazards and to
develop a detailed assessment of priority risks based on levels of exposure, sensitivity, and vulnerability. This risk
assessment enables Council to allocate resources and efforts to the areas that will be most affected. Eight key
systems at risk were identified:
Biodiversity;
Business;
Council operations;
Emergency management;
Infrastructure;
Recreation;
General population; and
Vulnerable populations.
The systems at risk are discussed in sections 5, 6, 7 and 8.
It is important to note that the development of the CRP has also taken into account and has been aligned to a
number of relevant strategic plans including (and not limited to) the following:
Knox Council and Community Plan 2017-2021
Emergency Management Plan
Knox Liveable Streets Plan 2012-2022
Knox Planning Scheme
Capital Works Sustainability Initiatives
Sustainable Building and Infrastructure Policy
Knox Integrated Transport Plan
Green Areas and Rural Strategy (currently being prepared)
3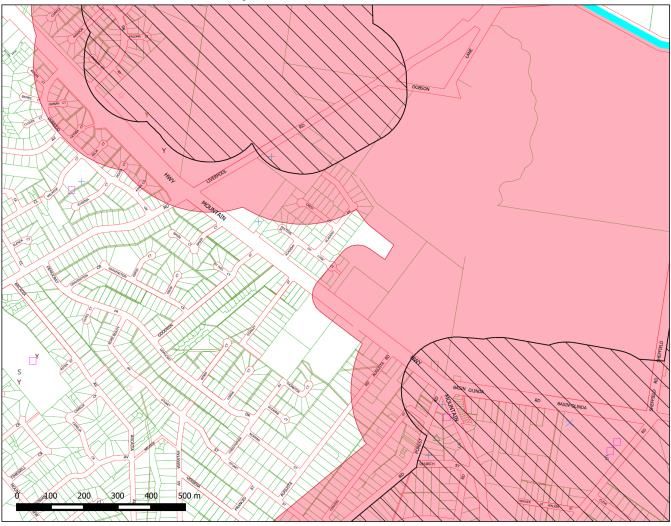
The draft CRP sits within the Knox Integrated Strategic Framework (illustrated below), and like all other Knox plans
and strategies, will be used to inform the development of the Knox Community and Council Plan. It is the Knox
Community and Council Plan which drives the allocation of resources and requires regular reporting to State
Government and the community.

                                                                                                                       4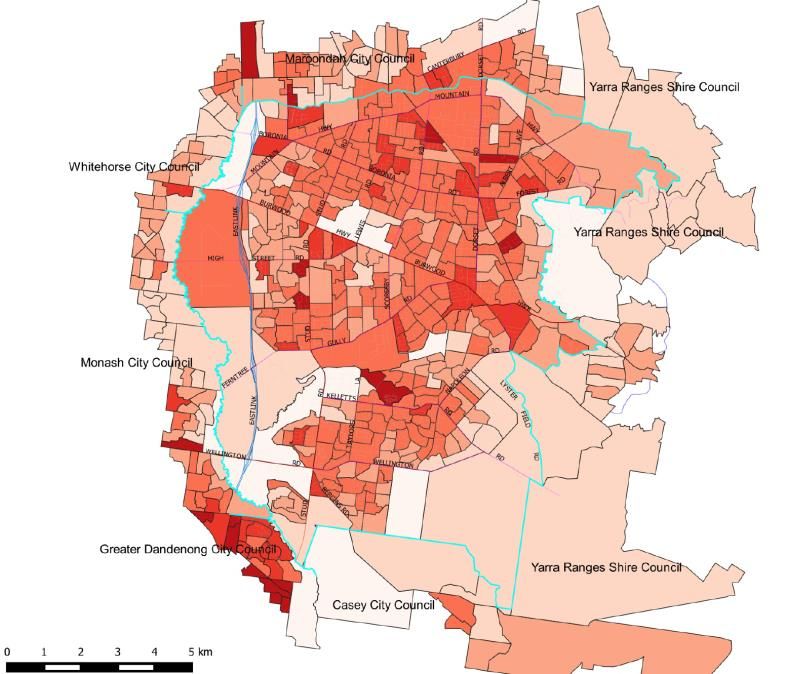
2. Climate Response Planning
Climate response planning is increasingly mandated for local government (Victorian Local Government Act 2020:
S9,2c) and the communities and partners with which they work. Governments are recognising the importance of
municipal-level climate response planning for addressing climate change. At the same time, as local governments
have responded to this challenge, they have begun to realise the additional benefits of taking climate change action.
In addition to yielding climate benefits, mitigation and adaptation actions can enable Councils to: meet their
development priorities; address social challenges and local environmental concerns; realise cost savings; and
respond to other international agendas, such as those captured in the United Nations Sustainable Development
Goals.
Local government is identified in the Climate Change Act 2017 as a decision-maker that must consider climate
change when preparing a municipal public health and wellbeing plan. Addressing climate change and its impacts on
health is also a focus area of the Victorian Public Health and Wellbeing Plan 2019-202. Under the Public Health and
Wellbeing Act 2008, Councils are required to have regard to the State Plan when preparing a municipal public health
and wellbeing plan.
At a regional level, Knox is part of the Eastern Alliance for Greenhouse Action, a formal collaboration of eight
councils in Melbourne’s east, working together on regional programs that reduce greenhouse gas emissions and
facilitate regional adaptation.
2.1 Sustainable Development Goals
The United Nations Sustainable Development Goals (SDGs) set out a framework of 17 transformational goals to
tackle our social, economic, and environmental challenges (see Figure 1 below). The SDGs have been adopted by all
193 member states of the United Nations, including Australia. As the level of government that works closest with
their communities, local governments already play a large role in achieving the SDGs, which will result in a more
sustainable, healthy, prosperous and just society.
At the SDG Summit in September 2015, Mayors from 40 countries met and declared their support and intention to
drive the SDGs. As well as calling for the localisation of the 2030 agenda, the Mayors particularly welcomed the
inclusion of SDG 11, Sustainable Cities and Communities as a ‘powerful driver of transformation’.
Local government plays an important part in achieving the SDGs. In the Australian Voluntary National Review (AVNR,
2018) the Federal Government stated that:
“many targets in the SDGs are in the purview of sub-national levels of government” and “The Australian
Government has adopted an approach to the SDGs that is appropriate for our national circumstances, with
government policy responsibilities and priorities devolved to the relevant agency and level.”
Councils have an opportunity to use the SDGs to:
Drive transformation that aligns with other local government authorities and levels of government;
Achieve integration by using the SDGs as the integrated framework for plans, strategies and reporting;
Align a diverse set of stakeholders in a universal agenda; and
Engage their employees and communities to help achieve the SDGs, including co-benefits from achieving
specific SDGs.
Co-benefits are defined as SDG goals and targets that are advanced through the achievement of other SDG targets.
Plans to achieve a specific target can easily overlook important contributions from other targets. For example, strong
5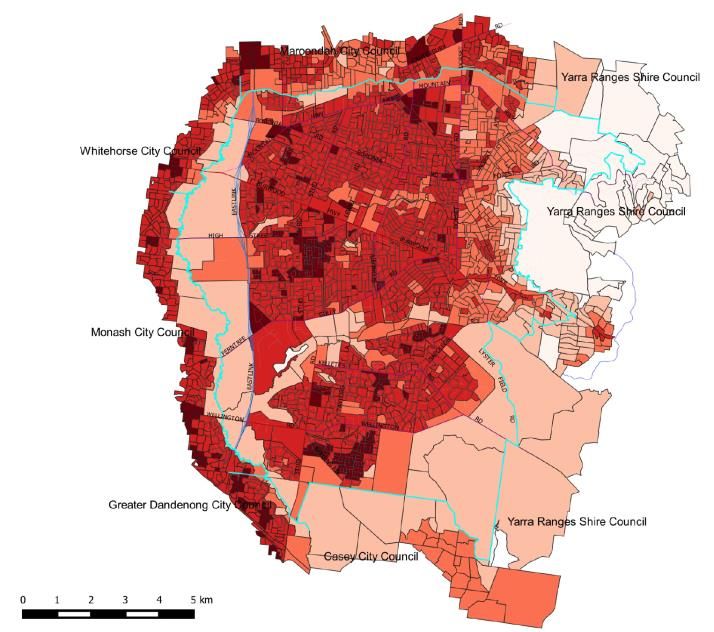
action on climate (SDG 13) can also benefit SDGs 7, 11, 12, 14, 15 etc. Understanding the co-benefits of achieving
targets can help design integrated policy platforms to consider these important contributions. The Action Plan of the
CRP will identify where actions align with the SDGs that will also benefit from robust climate action.

Figure 1: The Sustainable Development Goals (Source: United Nations)

                                                                                                                    6
3. Technical and Scientific Summary
3.1 Climatic Trends
Globally
Atmospheric carbon dioxide concentrations have risen from around 280 parts per million at the start of the industrial
revolution, to above 400 parts per million today (Global Carbon Project, 2018). The increasing concentration of
carbon dioxide, along with other greenhouse gases, are trapping heat in the Earth’s atmosphere and warming the
planet as a result of the enhanced greenhouse effect. In the recent geological history of the Earth, equivalent rates
of change have taken thousands of years to occur. The State of the Climate 2020 report released by the Bureau of
Meteorology (BoM) and CSIRO notes that the Earth’s climate system has not seen atmospheric carbon dioxide levels
above 400 parts per million since around 2.3 million years ago (BoM and CSIRO, 2020).
According to the Intergovernmental Panel on Climate Change (IPCC), the global surface temperature has warmed by
1oC since the middle of the 19th Century (IPCC, 2018). The State of the Climate 2020 report notes that every decade
since the 1980s has been warmer than the last. Due to the emissions already in the atmosphere, climate scientists
warn that a further warming of up to half a degree is already locked in. How much the climate changes will depend
strongly on the greenhouse gas emissions pathway that the world follows. To this end, the Paris Climate Agreement
is a global effort to limit the warming to below a 2oC increase (an increase of less than 2oC is below pre-industrial
levels), but make efforts to contain the temperature increase to 1.5oC.
Australia
Australia’s warmest year on record was in 2019, with the annual national mean temperature 1.52°C above average
as well as being Australia’s driest year on record (see Error! Reference source not found.). The 2020 BoM report
shows the highest temperature ever recorded in the Sydney Basin, at 48.9℃, occurred in 2020, on January 4.
Figure 2: BOM 2019 and 2020 (respectively) annual mean temperatures compared to historical temperature observations.
More recently, the BoM has released information that shows that 2020 was Australia's fourth-warmest year on
record. Notably:
Australia's area-averaged mean temperature for 2020 was 1.15°C above the 1961–1990 average;
Mean maximum temperatures were the eighth-warmest on record at 1.24°C above average;
Mean minimum temperatures were the fourth-warmest on record at 1.05°C above average; and
7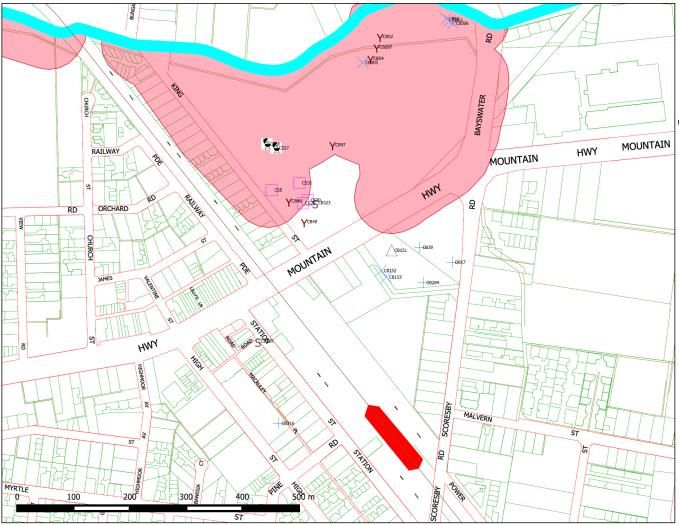
Annual mean temperatures for 2020 were above average for the majority of Australia, with close to average
annual mean temperatures for parts of eastern South Australia, and the west of Victoria and New South
Wales.
In addition, La Niña1 was declared in September 2020, reaching moderate strength by the end of the year. During a
La Niña phase, Australia's northern waters are warm with increased convection. This allows more moisture to be
lifted into the air than normal, typically resulting in increased rain for eastern and northern Australia, which can lead
to an increased flooding risk for some areas. That moisture can lead to cooler daytime temperatures however it is
worth remembering that despite the La Niña effect, 2020 was still the fourth hottest year on record for Australia.
Victoria
Victoria’s climate has changed in recent decades, becoming warmer and drier. These changes are expected to
continue in the future. Understanding the drivers and impacts of these changes, as well as what can be expected in
the future will help all levels of government to plan and adapt (DELWP, 2019). Annual rainfall is projected to
decrease across the state, due to declines across autumn, winter and spring. When extreme rainfall events do occur,
they are likely to be more intense.
The Victorian Climate Projections Report (DELWP, 2019) notes that by 2050, the climate in Melbourne is projected to
be similar to the climate currently experienced in Wangaratta. Days above 35oC are expected to increase from
around 8 per year to between 10 and 21 days, and nights over 20oC are expected to increase from nearly 6 nights a
year to between 13 to 18 nights per year. Fire danger days are also expected to increase by 42%, and there is
expected to be an overall reduction in rainfall totals, particularly in spring.
Figure 3: DELWP Victoria's Climate Science Report 2019
Figure 4 shows Victoria’s ‘climate stripes’, where each stripe represents the temperature for a given year, compared
to the 1961 to 1990 average, with red stripes indicating temperatures above average and blue stripes indicating
temperatures below average. These ‘climate stripes’ illustrate that temperatures have been increasing over the
recent decades.
1
La Niña is a phase of the El Niño Southern Oscillation (ENSO), which describes ocean and atmospheric circulations over the
Pacific Ocean.
8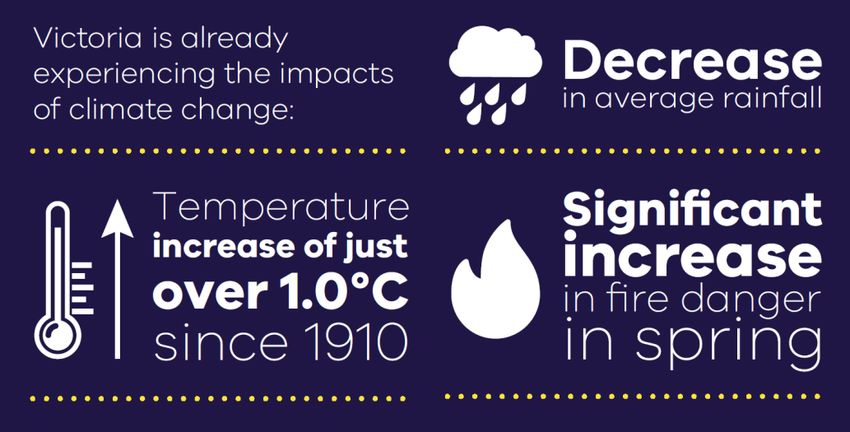
Figure 4: DELWP Victorian Climate Projections 2019 Technical Report
Knox
The ‘climate stripes’ for Knox (see Figure 5), show a warming trend for the average annual temperature (2.0°C
increase between 1965 and 2019) and the number of hot days over 35°C is also increasing since 1965. Average
temperatures were cooler in the 1960s (shown by white and blue stripes) and in recent years, there are more red
stripes indicating warmer temperatures. In addition, nearly half of the hot days over 35°C in 2019, were extreme
heat days, over 40°C. Data was not available from the Scoresby Weather Station between 1989-1996.
Figure 5: Average annual temperatures for Knox, Scoresby Weather Station 1965 - 2019
3.2 Knox City Council Emissions
Current carbon emissions from Council’s services and operations as well as the community emissions have been
documented, to better understand Knox’s starting position. Council’s corporate carbon emissions are determined
using the National Greenhouse and Energy Reporting System (NGERS). This framework categorises the emissions as
follows:
Scope 1: Emissions from a facility or site under the direct control of the Council (examples include emissions
from mains gas and fuel used in Council’s Fleet);
Scope 2: Indirect emissions created off-site for facilities under the direct control of the Council, mainly from
metered electricity purchased for Council’s facilities; and
Scope 3: Emissions from off-site facilities or activities, not under operational control of Council (examples
include unmetered electricity such as street lights, waste from Council operations, staff travel for work
purposes, emissions from contractor vehicles, and emissions from leased buildings).
Note: Inclusion of Scope 3 is optional due to the difficulty in obtaining the required data from various
sources such as suppliers, contractors and consultants.
The following Scope 3 emissions are included in Council’s carbon footprint described in Table 1 and Figure 6 below:
Energy used for streetlights; and
Business related air travel emissions.
It is proposed that as additional data becomes available, that Scope 3 emissions are reviewed and revised in the
future.
9Table 1 below outlines the emissions from Council operations from 2015 to 2020. It shows that electricity
consumption remains the largest contributor to our emissions at around 80%, followed by gas emissions at around
12%.
Table 1: Council’s Carbon Emissions from all scopes 2015 to 2020
Electricity Mains Gas Fleet Emmisions Flights Total
Emissions -
Emissions Emissions Petrol Diesel LPG Emissions
Financial Year (t CO2-e) (t CO2-e) (t CO2-e) (t CO2-e) (t CO2-e) (t CO2-e)
All Scopes (t
CO2-e)
2015-2016 13,187 1,511 284 624 8 4 15,618
2016-2017 10,460 1,590 311 681 9 5 13,056
2017-2018 8,395 1,522 263 614 7 4 10,805
2018-2019 8,470 1,160 254 722 2 3 10,611
2019-2020 7,670 1,196 262 659 6 6 9,799
As illustrated in Figure 6, the bulk replacement of 10,600 Streetlights to LED has contributed to a significant
reduction in Scope 3 emissions since 2015/16. The 2019/20 emissions have been partly impacted by the COVID-19
restrictions resulting in a reduction in energy and fuel use in a number of Council facilities in the final three months
of the 2019/20 financial year.
In addition, the Sustainability Initiatives Capital Works program has seen a number of buildings reduce emissions due
to energy efficiency upgrades and Solar PV installations. Rooftop solar has been installed in 28 Council buildings to
date amounting to over 640kW of installed capacity, along with 378kWh of battery storage in four
buildings. Improving energy and fuel efficiency standards, as well as an overall improvement to the Victorian
emissions factors (Victoria’s electricity emissions have improved as more renewable energy is added to the grid),
have contributed to a 37% reduction in Knox City Council’s greenhouse emissions since 2015/16.
Council Emissions - All Scopes (2015 - 2020)
(tonnes CO2 equivalent)
18,000
16,000
14,000
12,000
8,774
10,000 6,593
8,000 4,575 4,430
4,226
6,000
4,000 4,568 4,033 3,975 4,173 3,579
2,000
2,277 2,429 2,256 2,008 1,992
0
2015-2016 2016-2017 2017-2018 2018-2019 2019-2020
Scope 1 (t CO2-e) Scope 2 (t CO2-e) Scope 3 (t CO2-e)
Figure 6: Carbon Emissions from Council’s buildings and fleet. Scope 1, 2 and 3.
103.3 Knox Community Emissions
The ‘Snapshot Community Climate Tool’ which has been developed by Ironbark Sustainability and Beyond Zero
Emissions, provides a national database of community emissions for all local governments in Australia. This tool has
been used to obtain data on Knox community emissions between 2017 and 2019 (Table 2). The data shows that
Electricity (56%), Gas (22%) and Transport (19%) accounts for 97% of the Knox community’s emissions.
Table 2: Knox Community Emissions 2017 – 2019 (Source: Snapshot Climate)
Electricity Emissions Gas Emissions Transport Waste Agriculture Total
Financial Year Residential Commercial Industrial Residential Commercial Industrial Emissions Emissions Emissions Emissions
(t CO2-e) (t CO2-e) (t CO2-e) (t CO2-e) (t CO2-e) (t CO2-e) (t CO2-e) (t CO2-e) (t CO2-e) (t CO2-e)
2017-2018 323,100 363,400 1,146,300 168,200 66,100 208,500 603,800 51,600 200 2,931,200
2018-2019 310,800 349,300 1,142,800 170,200 127,700 409,200 605,600 50,700 600 3,166,900
The total greenhouse gas emissions in Knox equates to nearly 15 tonnes per capita with household electricity and gas
use accounting for around 3 tonnes of the per capita total (Figure 7). Emissions are higher in Knox than for the
Eastern Alliance for Greenhouse Action Councils (EAGA) average which is 13 tonnes per capita in total, and just
below 3 tonnes per capita in household emissions (State of Knox 2020).
16
14 14.63
(total) 13.22
12
(total)
10
8
6
4
2 3.1 2.9
Residential
0 emissions
Knox EAGA
Figure 7: Knox emissions vs EAGA average, tonnes per capita 2017.
3.4 Carbon Emissions Reduction Goals
Reducing emissions is a shared responsibility between governments, business and the community. Setting targets
enables efforts to be directed towards achieving that target, rather than letting emissions grow unchecked. As
previously mentioned, close to 200 of the world’s governments signed the landmark Paris Agreement. The Paris
Agreement forms the basis of science-based targets to limit global temperature increase to below 2°C by 2050.
However, to limit warming to below 2°C, let alone 1.5°C, current Paris pledges made by countries are not enough.
Carbon emissions need to decline at a much steeper rate in the near future and reach net-zero by mid-century to
have a 50% chance of keeping warming below 1.5°C.
Just as a financial budget guides and provides parameters for expenditure, a carbon budget provides parameters for
how much carbon can be emitted into the atmosphere before warming will exceed certain temperature thresholds.
The concept of a carbon budget emerged as a scientific concept from the IPCC’s 2014 Synthesis Report on Climate
11Change and relates to the cumulative amount of carbon emissions permitted over a period. Given that the carbon
budget is not annual, but cumulative, it means that once it is spent, carbon emissions have to be held at net zero to
avoid exceeding temperature targets.
To be consistent with the objectives of the Paris Agreement, and in light of the scientific information presented in
section 3.1 of this Plan, it is proposed that Knox Council reach emissions neutrality by 2030 at the latest. The
reduction will be based on Knox's corporate emissions inventory and modelling, outlining an accelerated reduction
to total emissions neutrality through to 2030. An emissions neutral Knox City Council means:
Net zero greenhouse gas (GHG) emissions from fuel use in buildings, transport and industry (scope 1);
Net zero GHG emissions from use of grid-supplied energy (scope 2);
Wherever possible, net zero GHG emissions related to indirect emissions (scope 3).
Furthermore, it is recommended that Council’s role as a community leader support and help drive emissions
reduction in the Knox community, towards zero net emissions by 2050. A net zero emissions target by 2050 has
been adopted by every state and territory government in Australia to meet the obligations of the Paris Agreement.
Data from both the Council emissions and community emissions, together with the strategic direction outlined in the
CRP enables recommendations on best practice actions to achieve Council’s emission reduction goals. The Action
Plan (Section 10) outlines the key measures that Council will need to take to achieve the net zero emissions target,
and also the climate adaptation measures required to manage the impact of climate change.
However, irrespective of how quickly emissions are reduced, some climate changes are irreversible (DEWLP, 2020).
The Climate Risk Assessment (Section 5) has identified that there are essential services and infrastructure which Knox
Council provides to our community which are vulnerable to a range of climate hazards. Due to Knox Council’s local
knowledge and close connection to the community, Council is often best placed to help the local community reduce
risks and adapt to climate change.
3.5 Knox’s Carbon Budget
For our community, Council has established a target to be emissions neutral by 2050, in line with State Government
targets. Using science-derived targets (SDTs) presents an effective and intuitive way to establish the boundaries of
what this overall trajectory should be, and from there, to identify targets that are in-line with Council’s and the
community’s aspirations. Importantly, the establishment of SDTs links our efforts to the international community
through alignment with the Paris Agreement.
The calculated SDT for remaining within 2°C for City of Knox is provided in Table 3.
Table 3: Scaled science-derived target for City of Knox
Remaining budget (t CO2-e) 23,020,889
“Runway” - Remaining years without change (years) 7.67
Required linear annual reduction 2021 – 2034 (t CO2-e p.a.) 195,775
Required linear rate of reduction 2021 – 2034 (%) 6.52%
12The Remaining Budget for the Knox community is the total amount of carbon that the municipality can emit if it is to
make a fair contribution to limit the temperature increase to 2°C. The remaining budget for City of Knox is 23,020 kt
CO2-e from 2018/19.
The ‘Runway’ or Remaining years without change (7.6 years) calculates how long this carbon budget would last,
based on the emissions released in 2018/19. If the municipality were to significantly reduce annual emissions this
runway would extend as the region would not be ‘spending’ its carbon budget as rapidly.
The Required annual reduction and Required rate of reduction shows that City of Knox’s emissions need to reduce by
195 kt CO2-e (6.5% of 2018/19 levels) per year until 2034, if the carbon budget is to be used linearly over this time
period.
City of Knox Municipal Science-derived Target
3500000
3000000
Annual emissions (tCO2e)
2500000
2000000
1500000
1000000
500000
0
18
19
20
21
22
23
24
25
26
27
28
29
30
31
32
33
34
20
20
20
20
20
20
20
20
20
20
20
20
20
20
20
20
20
Figure 8: Representation of City of Knox's municipal science-derived target if used linearly
The SDT, which is developed in line with the recognised science of the Intergovernmental Panel on Climate Change
(IPCC), connects our efforts to Australia’s commitment to the Paris Agreement. This connection provides the yard
stick against which to assess the effectiveness of different actions and interventions developed through an evidence-
based action planning (EBAP) process. This EBAP process ensures that all interventions are considered through an
evaluation of their effectiveness, cost and probability of success, based on the evidence of real projects, research
and professional expertise.
Whilst understanding the necessity of meeting this target, it is also important to understand Council’s level of
accountability. Reducing municipal greenhouse gas emissions must be a whole of community effort and actions
taken by State and Federal governments and emissions intensive industries will be key in ensuring Australia stays
within its national carbon budget. Council may advocate for and support these actions or engage in collaborative
planning with key stakeholders, but ultimately is not solely responsible for meeting the full municipal emissions
target.
134. The Economics of Climate Action
Deloitte Access Economics’ report A New Choice: Australia’s Climate for Growth states that net zero is an economic
necessity (Deloitte Access Economics, 2020). The cost to Australia of a global failure to deliver a new growth
recovery is -6% of GDP and over 880,000 jobs would be lost by 2070. Compared to this future, Deloitte Access
Economics estimates a new growth recovery would grow Australia’s economy by $680 billion (present value terms)
and increase GDP by 2.6% by 2070. This new growth path adds over 250,000 jobs by 2070. It also claims that “there
is no free ride for Australia – while doing nothing is a choice, it is not costless.” A ‘no policy action’ scenario does not
result in uninterrupted economic growth. A ‘no policy action’ pathway as the economy recovers from the COVID-19
crisis– one that does not deliberately and rapidly mitigate climate change – will result in significant economic losses.
This is true in Australia, and the rest of the world.
4.1 COVID-19 and Climate Action
It is important to discuss Australia’s economic outlook and climate action in the context of the unprecedented global
health crisis of COVID-19 and its subsequent economic impacts. Economies globally are all facing the same
challenge: how to shift from an economic baseline that was already changing, and recover to a ‘new’ resilient
economic path post-COVID-19. Both government and private sector investment is needed to fill the chasm COVID-19
has left in the economy. This investment will present an opportunity to accelerate Australia’s inevitable shift to a
low emission economic structure.
The economic costs of the locked-in warming that is occurring, and moving to net zero by 2050, is a 0.1% loss in GDP
growth, on average, over the 30 years to 2050 (Deloitte Access Economics, 2020). This 0.1% loss in Australia’s GDP by
2050 is estimated to be $90 billion, in present value terms. Of this $90 billion cost of moving to net zero, $23 billion,
or 26% is due to the locked-in impacts of climate change. The remaining $67 billion, by 2050, represents the cost to
the economy of reducing emissions to reach net zero in a new growth recovery.
A $67 billion cost to transform the economy by 2050 is a small price to pay, relative to the size of the Australian
economy. In dollar terms, for comparison, the JobKeeper program cost the Federal budget just over $65 billion in
2020 alone – and this is the necessary price Australia is paying to minimise the worst economic consequences of
COVID-19.
The economy impacts the climate, and the climate impacts the economy. Very few forces can impact the Australian
economy like the damages associated with climate change – not when considering the scale, persistence and
systemic nature of the impacts, as we have seen in 2020. Climate change, if left unmitigated, can erode the
productive capacity of the economy. It can change how people work, what is produced and where it is produced, and
shift the preferences of what people buy. Industries that rely on people power, such as construction and
manufacturing, which make up large elements of the Knox community’s industry, will experience hotter working
environments that not only disrupt comfort levels, but as temperatures continue to rise, hotter conditions become a
concern for workers health and safety and their ability to perform tasks.
4.2 Investment Appetite
Over 150 global corporations have signed a public statement calling for a net-zero economic recovery (World
Resources Institute, 2020). Global consulting firm McKinsey has pointed out this would create more jobs and growth
than a high-carbon recovery (McKinsey & Company, 2020). Further, government investment on renewable energy
has been shown to create five times more employment than spending on fossil fuels (Beyond Zero Emissions, 2020).
14Institutional investors such as superfunds, banks and corporate investors have a large and growing appetite to fund
projects that reduce emissions. The Investor Group on Climate Change reports that Australia’s financial services
sector has come together in an unprecedented coalition to promote a transformation of the Australian financial
system to support the transition of the economy to net zero emissions by 2050, consistent with the Paris Agreement
and the UN Sustainable Development Goals (Investor Group on Climate Change, 2020).
155. Climate Risk Assessment
Local governments provide a wide range of community-based services and infrastructure exposed to the impacts of
climate change. Council is the first line of response for many risks facing the community, and their risk profile is likely
to shift with projected changes in the frequency, severity, and scale of climate hazards.
These challenges will be encountered against background socio-economic trends such as population growth, housing
affordability, water and energy demand, and technology changes. Climate change will exacerbate existing socio-
economic issues, disproportionately impacting those most vulnerable in the community, widening the social
inequality gap, and disrupting jobs and employment patterns (Australian Academy of Science, 2015).
Knox Council undertook a Climate Change Risk Assessment, with the objective of assessing the vulnerability of key
‘systems at risk’ across the municipality to develop a detailed assessment of priority risks based on levels of
exposure, sensitivity, and vulnerability.
The Risk Assessment identified eight key ‘systems at risk’:
Biodiversity;
Businesses;
Council operations;
Emergency management;
General population;
Infrastructure;
Recreation; and,
Vulnerable populations.
Within each ‘system at risk’, several ‘sub-systems’ were defined and their vulnerability to various physical climate
risks was assessed based on their exposure, sensitivity, adaptive capacity, relative significance, and the level of
control exercised by Council. Based on the vulnerability assessment, Council identified four focus areas for further
assessment, including:
Vulnerable populations: Older persons and people with disabilities;
Biodiversity: Council reserves, flora, and fauna;
Buildings: Council owned buildings and recreation facilities, and;
Infrastructure: Stormwater, roads, footpaths, and bike paths.
These areas and their risk profiles are discussed further in sections 6, 7 and 8 below. Whilst Council operations and
role as planning authority were also identified as key areas of vulnerability, the complexity associated with these two
areas warranted a deeper level of assessment than could be achieved within the scope of the Climate Risk
Assessment, and therefore the exploration of these systems is deferred to a later phase of work.
Vulnerable populations
Older persons are considered one of the most significant areas of risk for Council due to Council’s direct
responsibility in assisting older persons, as well as due to older persons’ high level of vulnerability to acute climate
stressors, in particular heatwaves. This segment of vulnerable people was considered to be at extreme risk.
16People with a disability were expected to have more extensive support networks, therefore were considered a
slightly lower risk. Council also play a less direct role in supporting this segment of the population.
Biodiversity
Council’s bushland reserves and other open spaces are an important part of the broader network of vital habitat
spaces that connect a highly fragmented environment, all of which support a diverse range of flora and fauna. These
environments are considered at high risk to both acute and extreme weather events, and longer-term shifts in the
climate. A crucial role for Council is to support ongoing collaboration with community and government agencies to
reconnect habitats and reduce the impact of fragmentation through a biodiversity plan and urban forest strategy.
Buildings
Bushfires, storms, heatwaves, and floods pose a ‘high’ risk to Council facilities due to the potential impact to users
and assets. This was also identified as a key liability risk, flagged for further investigation as part of Council’s next
steps. It was also identified that there is a gap in procedures to govern the safe operating conditions of facilities
during extreme weather events.
Infrastructure
Stormwater infrastructure, roads, and pathways were considered at high risk from flood and storm events, due the
potential for disruption of essential services and impact to residential properties. Council is taking active measures to
improve stormwater management and the preparedness of the community for high rainfall events, however these
systems are considered to be an area of potentially high liability risk and further work is recommended to explore its
magnitude.
These subsystems are elaborated on in sections 6, 7 and 8 below.
176. Our Community
6.1 Vulnerable and General Populations
Cumulative sensitivity is of particular relevance among vulnerable populations. Cumulative sensitivity is when two or
more of the sub-systems intersect, for example in Knox there is a high prevalence of chronic health conditions and
disabilities in the older persons segment of their population. As Knox’s population is ageing (15% and projected to
increase), and due to the direct role Council plays in supporting older persons, this sub-system was identified as a
key area for further assessment. Whilst children also received relatively high scores in assessment, they were
deemed to have strong support networks through families, childcare and education systems, and therefore not
considered for further assessment.
Across the key climate stressors, heatwaves were associated with consistently high levels of vulnerability across most
sub-systems. This is due to the regional nature of heatwaves (e.g. impacting the whole municipality rather than
specific areas), and therefore individuals are unable to simply move away from the event. They are required to seek
shelter with appropriate cooling and water, but the danger is less obvious than for more obvious and localised
events, such as floods and bushfires.
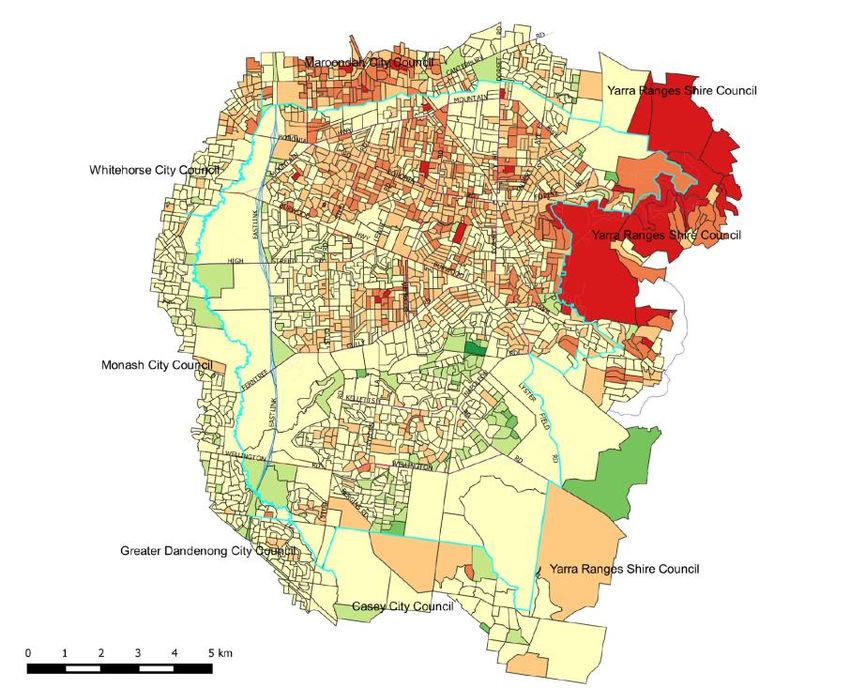
Figure 9: Heat vulnerability map Knox
The Heat Vulnerability Index rating of Figure 9 is determined by three components: heat exposure, sensitivity to heat
(due to land cover, population density, and age), and adaptive capacity (e.g. socioeconomic advantage or
disadvantage) where 1 equals low vulnerability and 5 equals high vulnerability. Equal weighting (one third each) is
given to heat exposure, sensitivity to heat, and adaptive capability. This demonstrates that in Knox there are areas
where residents may be exposed to significant heat stress at times and who may lack the adaptive capacity to cope.
The Climate Risk Assessment identified the most at risk as:
Older persons: For the purpose of this assessment, older persons are defined as individuals aged 65 years or
older. This segment of the community makes up approximately 15% of the municipality’s population.
People with a disability: People with a disability were determined based on the Census of Population and
Housing definition, which defines the profound or severe disability population as:
18'Those people needing help or assistance in one or more of the three core activity areas of self-care, mobility,
and communication, because of a long-term health condition (lasting six months or more), a disability (lasting
six months or more), or old age' (ABS, 2016).
This segment makes up approximately 5% of the municipality’s population.
There is a significant intersection between these two sub-systems, with over half of the individuals deemed as
‘needing assistance’ also being over 65 years old.
Older persons
The impacts of climate change and the costs of action and adaptation are unevenly distributed, with low income
earners and disadvantaged groups, including substantial proportions of older people, likely to be affected first and
most severely. The effects of climate change on older people on low or fixed incomes, who are disadvantaged
socially, or who have health issues, will be significant because they have less capacity to adapt to the effects of
extreme weather conditions including:
higher temperatures and longer, more significant heat waves,
increased costs for essential goods and services, and
damage to housing and the built environment (COTA, 2019).
While climate change affects everyone, there is a growing body of evidence that it poses specific risks for older
people. They are more vulnerable to the effects of temperature extremes and have a significantly higher mortality
risk in extreme weather. The combination of chronic health problems and social isolation, in addition to more limited
access to services, can reduce their capacity to cope with climate-related stresses. Minor conditions can quickly
become major challenges that overwhelm an older person’s ability to cope.
The risk to older people is enhanced by a multitude of underlying factors such as housing affordability, housing
quality, income levels and cost of utilities. ABS 2016 Census data shows that 550 Knox households aged 65+ years
were in housing stress, with many located in bushfire prone areas. These individuals are less likely to have capacity
or disposable income to spend on home improvements or garden maintenance, which can be key mitigation
measures for extreme weather events. The greatest risk however comes from heatwaves causing more deaths than
any other emergency in Knox combined.
Knox’s Community Access and Support team maintains a register of older persons who are vulnerable during an
emergency event and provide them with advance notice when extreme weather is forecast. However, this register
doesn’t capture all vulnerable members within the community. In addition to the Community Access and Support
team’s register, the Emergency Management Team maintains a broader vulnerable people register, providing an
additional check point during extreme weather events.
Complementary to the above contact registers, Knox runs a ‘Ready to Go’ volunteer program to support older
persons in planning for emergency events, such as heatwaves and bushfires.
Council also provides a range of services for older persons, including domestic assistance, personal care, flexible
respite, escorted shopping, food services, occupational therapy, home modifications, home maintenance, social
support (individuals and groups), community transport, housing support, and specialised access support. However,
following national reform across the aged care sector, Council, from 1 July 2021, will transition out of in-home
services. Moving forward Council will work even more closely with vulnerable populations and continue to provide
the remaining range of services.
19People with a disability
The inherent risk of acute climate events for people with a disability can be impacted by their mobility and/ or
communication abilities. It was assumed that people with a disability are likely to have a broader support network
through family or service providers, therefore isolation was expected to be less of an acute issue compared to older
persons, therefore slightly reducing the likelihood.
Council’s role in relation to people with a disability has changed significantly with the roll out of the National
Disability Insurance Scheme (NDIS). Council no longer provides any direct services to people with a disability, and has
a role limited to provision of accessible public facilities and services, information, education, and capacity building.
However, it is recognised that the NDIS does not support all people with a disability and support networks might be
lacking or failing some of the people in this category.
General Population Health
The World Health Organisation describes climate change as the defining issue for public health in the 21 st century.
Our health is dependent on the health of our environment. However, our changing climate has significant
consequences for the environment and for public health, wellbeing and safety, the consequences of which are
already being felt. The direct and indirect impacts of climate change are likely to exacerbate existing public health
risks and represent an unacceptably high and potentially catastrophic risk to human health. Direct impacts, including
hypo- and hyperthermia, heat stress, injury, trauma and death, are caused by exposure to more frequent and
intense extreme weather events such as bushfires, droughts, floods and heatwaves. Indirect impacts, mediated
through natural and human systems affected by climate change include:
Vector-borne diseases (those transmitted from vectors such as mosquitos to humans)
Zoonotic diseases (those transmitted from animals to humans)
Water-borne diseases (resulting from exposure to harmful algae and pathogenic microorganisms affecting
drinking water, recreational water, including aquatic facilities, and water supplied for domestic use)
Food-borne diseases (such as salmonellosis)
Exposure to contaminants such as mycotoxins in food
Impacts on the micro and macro nutritional quality of food
Exacerbation of existing chronic diseases such as cardiovascular and respiratory diseases as a result of higher
temperatures, poorer air quality and airborne pollen. (Victorian Government, 2020)
Aside from its effects on physical health, climate change can also adversely affect mental health. Extreme weather
events such as floods, droughts and bushfires can lead to psychological distress due to trauma, illness, loss of loved
ones, destruction of property and displacement, and disruption of communities, goods and services. The
incremental change to our environment and fear of what the future may bring can also have negative impacts on
mental wellbeing. According to a recent survey, depression or severe anxiety related to climate change was noted
by half of Victorian healthcare professionals (Sustainability Victoria, 2020).
Conversely, there are many benefits from taking strong action on climate change with respect to public health. The
Climate and Health Alliance notes that the health benefits from climate mitigation policies reducing air pollution can
offset the cost of public health implementation tenfold (CAHA, 2017).
Children
Doctors for the Environment have released research that outlines how climate change is threatening the underlying
social, economic and environmental determinants of child health (DEA, 2015). Reduced availability of food, water
and sanitation and disruption to education and social stability are already occurring in developing countries.
Australia is not immune to such effects in the future.
20Children have a longer life expectancy, and are therefore more at risk from the effects of repeated or prolonged
exposures. On a broader scale, early effects of climate change on a generation’s physical or mental health could
leave lasting consequences on human capital as children reach adult life, and eventually on subsequent generations.
Children are particularly vulnerable to a changing climate because:
They require more food, liquids and oxygen for their body weight compared to adults, which increases their
risk from hazards such as air pollution, water shortage and contamination, and malnutrition.
They have difficulty coping with stresses from increasing average and extreme temperatures because of their
immaturity of physiology and metabolism.
Their developing immune systems make them more vulnerable to many infections.
Their rapid growth and development in utero and childhood means exposure to harmful situations such as
maternal and/or childhood malnutrition, or exposure to air pollutants leading to chronic asthma, can have
ongoing, severe and long-term effects into adult life.
Psychological trauma exposure in childhood can lead to alterations in a developing brain’s function and
longer term cognitive and mental health impacts.
Their behaviour is different and they lack many self-protection mechanisms. As an example, they tend to
spend more time outdoors thereby exposing themselves to hazards such as dehydration and sunburn.
They rely on primary care givers to protect and provide for them and will suffer more if their responsible
adult is impaired.
Sport
Climate change and extreme weather events threaten the viability of Australian sport as it’s currently played, either
in the back yard, at local grounds, or in professional tournaments. Heatwaves, changed rain patterns, floods, and
drought are impacting grounds and facilities around the country. Climate change will continue to have direct impacts
on all sports. Heat directly affects athletic performance and welfare. Drought and changed rainfall patterns affect
ground surfaces, player safety and increase management costs. These range from increased water and energy use to
insurance premiums to cover the increased injury risks of harder grounds. Extreme rainfall threatens short-term
ground washouts, and more extensive damage to grounds surfaces, which also impact maintenance and insurance
costs.
Extreme heat (i.e. the frequency of days over 35 degrees) is just one of the impacts from climate change that affects
athletes and poses risks to spectators and event staff. Athletes of all levels are discovering that record-breaking hot
temperatures make it harder to play and perform. The challenges of extreme heat on indoor facilities could also
include cost of efficiently cooling large spaces to provide a safe and comfortable venue for patrons and participants.
The heat impact is greatest where significant protective equipment is required such as cricket (Cricket Australia,
2019) or those sports played on synthetic surfaces such as tennis (Tennis Australia, 2019) where the surface
temperature could be much higher than natural surfaces.
Smoke and air pollution can also have a major impact on people's ability to safely participate in sport. In Australia,
particularly during heat waves, smoke from bush fires can become a significant risk and may exacerbate other heat
related conditions. In December 2019, in response to unprecedented levels of smoke pollution from bush fires across
the country, the Australian Institute of Sport (AIS) developed a position statement on Smoke Pollution and Exercise
(AIS, 2020) to provide guidance and advice to decision makers.
The most immediate impact of extended periods of low rainfall and high heat, or insufficient water supply, is the
deterioration of playing surfaces. Poor ground conditions also increase the risk of injuries, alter playing conditions
and diminish the appeal of playing.
21You can also read