Draft - Novel Infrasound Monitor Project - real geophysics research on a budget - Ian Robinson
←
→
Page content transcription
If your browser does not render page correctly, please read the page content below
Novel Infrasound Monitor Project - real
geophysics research on a budget
               Ian, Saul ‡ & Nathan§ Robinson
               www.starfishprime.co.uk, Guisborough, UK
               E-mail: i.robinson@starfishprime.co.uk

               Abstract. Described here is a well established opensource geophysics project
               to monitor atmospheric infrasound 24/7. It employs a modern digital, I2 C
               enabled differential pressure sensor - unlike the older analog devices more
               commonly used. Python software automatically uploads plots whilst data is
               stored in standard .mseed format for further analysis. Very open-ended with

                                      t
               lots of opportunities for students of all levels, schools and above, to redesign
               and test replacement components. This is real science, in a little studied area.
                                   af
               The equipment required is relatively cheap and offers many opportunities for
               students to build and refine a sensing system of research quality. It may be of
               interest as a national school’s network producing results of real scientific and
               educational value at little cost.
             Dr
1. Introduction

Infrasound is commonly defined as periodic air pressure variations at a frequency
below the range of human hearing i.e. below about 20Hz. Signals with a period
greater than 100 seconds (10-2 ) Hz are swamped by variations due to the weather
so typically the range of interest is ∼ 0.01 to 20Hz.
     The human ear is sensitive to frequencies from ∼20Hz to ∼ 22kHz at birth.
The upper frequency tends to decline with age and exposure to loud sounds.
Amongst other mammals some cetacea such as porpoises may be sensitive up
to 150kHz. Low frequency sensitivity has been less well studied however elephants
are believed to communicate via infrasound and birds, such as homing pigeons
appear to navigate using naturally occurring infrasound sources.
‡ Laurence Jackson School, Guisborough
§ Prior Pursglove College, Guisborough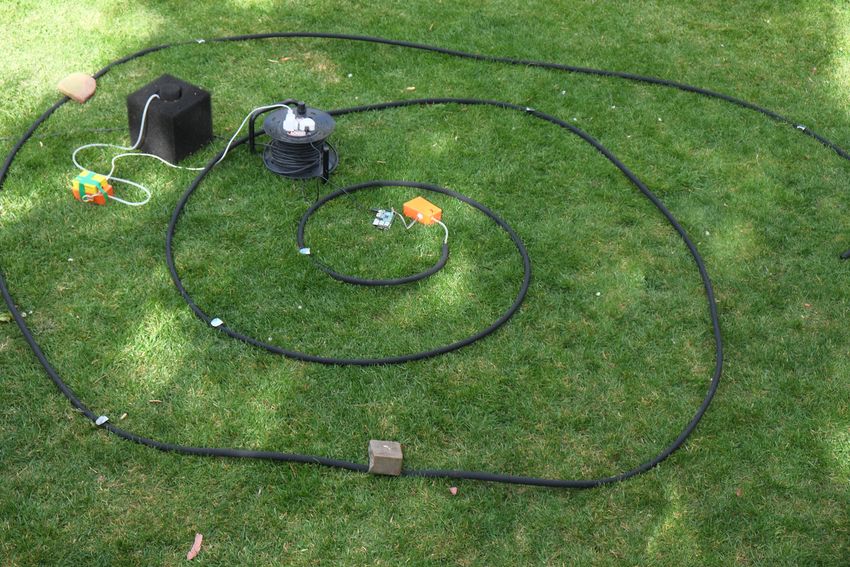
Novel Infrasound Monitor Project - real geophysics research on a budget              2

     Infrasound may be generated by natural and man-made events. Natural
sources include volcanoes, earthquakes, avalanches, tides, lighting - especially in
the upper atmosphere and meteors. Man-made sources may be air-conditioning,
wind-farms, aeroplanes, rockets, large industrial plant, and explosions. An
international network of infrasound monitors is used by the Comprehensive
Nuclear-Test-Ban Treaty Organization (C.T.B.T.O.) looking for signals indicating
an atmospheric nuclear explosion [1, 2].

                                    t
                                 af
             Dr

            Figure 1: CTBTO Infrasound ‘Pipe Array’ - Greenland [3]

    Infrasound propagates well through the atmosphere and may be detected
hundreds of km from the source.

2. Why Investigate Infrasound?

This is a fascinating relatively little studied area of geophysics wide open to further
study. There was little research in the field before the 1960s. An infrasound
monitor may be used as a static station, after storms, sonic booms etc. one may
download the raw data files and analyse the signal. As a portable device it permits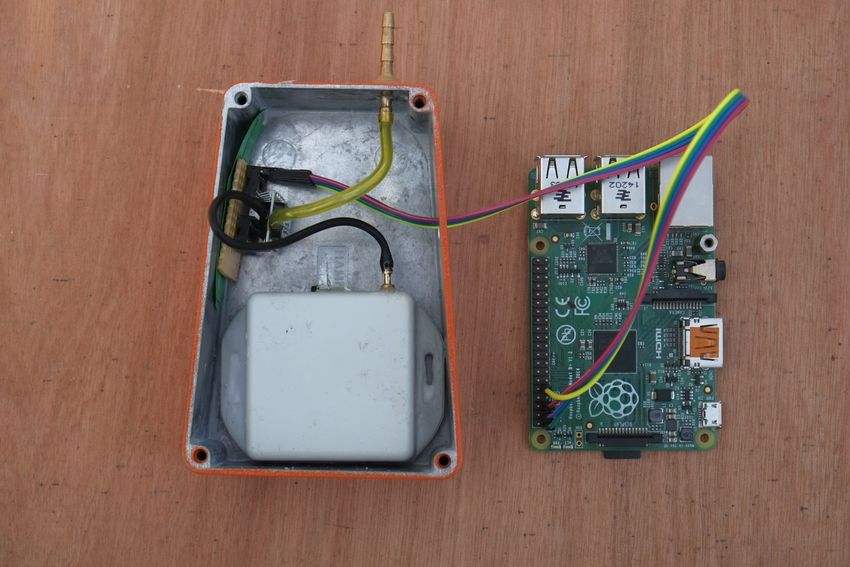
Novel Infrasound Monitor Project - real geophysics research on a budget            3

field studies near such sites of interest as wind turbines, quarries, airfields, and
beaches.The system described here allows students to build a monitor capable of
recording pressure variations of 4 x 10⁻² Pa in the range 20 to 10-2 Hz.

2.1. Some Physics
Sound is a longitudinal periodic pressure variation of a fluid, the general physics
of which may be readily found elsewhere.
     However of particular note here is the frequency dependant attenuation of
sound in air.
     Stoke’s law of sound attenuation gives the sound attenuation factor α for a
plane wave as
                    2ηω 2
               α=                                                               (1)
                    3ρc3
Where α is the attenuation rate (m−1 ), η the dynamic viscosity coefficient (Pascal
seconds), ω the wave’s angular frequency (rads−1 ) where ω = 2πf , ρ the density
of air and c the wavespeed.

                                   t
     It follows that the amplitude A at distance r is given by
                                af
              Ar = A0 e−αr                                                       (2)
     Acoustic I=intensity (W m−2 ) is defined as
                    A2
               I=                                                               (3)
                   2ρc
             Dr
where A is the amplitude (Pa), ρ the equilibrium density of air, and c the
wavespeed.
     We can therefore see that the amplitude attenuation varies as f 2 and thus
the intensity varies as the square of this. This is one reason why infrasound may
propagate over hundreds of km whilst higher frequency sounds attenuate much
more quickly.
     As the human ear is sensitive to a very wide range of intensities the loudness
level is often expressed in decibels - the log of the ratio of the sound to some
reference value.
                            p2             p
               L = 10log10 2 = 20log10                                          (4)
                           pref           pref
Here p is the root-mean-square peak pressure and pref is typically 20µPa,
approximately the minimum threshold of human hearing. It follows that a sound
level of 120dB - such as at a loud rock concert, represents a peak pressure variation
106 times the threshold of human hearing.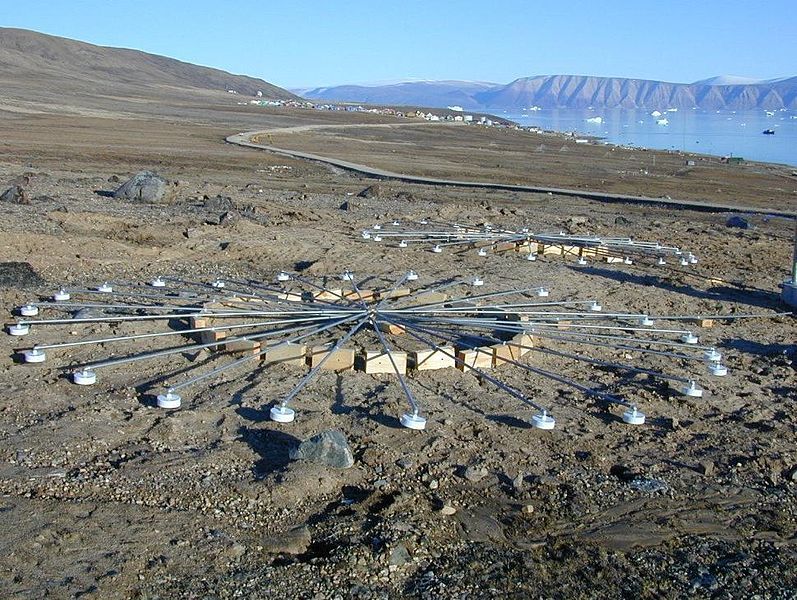
Novel Infrasound Monitor Project - real geophysics research on a budget             4

3. Infrasound Detection

Infrasound may be monitored with either a ‘slow’ microphone or a fast pressure
(barometric) sensor. Capacitive microphones have been used widely and whilst
quite practical to build in a school workshop would add an extra level of build
complexity and require very stable voltage supplies. Cheaper electret microphones
suffer from a marked non-linearity at low frequencies [4] and the most widely tested
low-cost one, the Matsushita WM-54D5, is no longer available.
     ‘Fast’ pressure sensors may be used , either absolute sensors which measure
total atmospheric pressure or differential sensors measuring the difference in
pressure between their two ports. For a resolution of say 0.1Pa an absolute sensor
will need a resolution of 1:106 , difficult to achieve requiring a very stable voltage
supply as well as an ADC of some 20 bits resolution.
     This system described here uses a digital differential device, employing a mems
sensor to monitor the pressure difference between its two ports with a resolution
of approximately 0.04Pa across a range of ± 125Pa. One port is connected to the

                                   t
atmosphere via some wind-shield whilst the other ‘reference’ port is connected to
a slightly leaky enclosure - the backing volume. The sensor costs approx £40 and
                                af
may be powered directly from the output pins of a Raspberry PI with which it
also communicates via the 2 wire digital I2 C protocol.
     Putting these in some context, a Chinook helicopter at 200m caused a
peak pressure variation of ≈ ±0.25P a whilst the 2020 Storm Denis generated
             Dr
∆P ≈ ±50P a in north England.

4. The System

The system’s sensor is the Amphenol DLVR-F50D, a micro-electromechanical
system (mems) where both electronic and mechanical components are fabricated
on silicon. This particular device is a piezo-resistive differential pressure sensor
with inbuilt temperature compensation. It internally converts the varying analog
voltage across a silicon membrane into a digital signal which is transmitted over
a 2 wire output using the I2 C protocol. The sensor’s range of ± 125Pa is divided
into 6,553 steps giving a resolution of < 0.04 Pa. It is very simple to use with
only 4 connections required. Gnd and +3.3V inputs are taken directly from the
Raspberry Pi’s header pins whilst the two I2 C outputs (SDA & SCL) lead back to
the Pi’s.
     The authors have released open-source python software to read the I2 C signal,
Novel Infrasound Monitor Project - real geophysics research on a budget 5
process, plot and store data.
Sensor Pi
I2 C
Internet
Figure 2: System Overview
5. The Backing Volume
Backing Volume
t needle leak
af
atmosphere
Dr
mems sensor
A differential pressure transducer measures difference in pressure between
its two ports, one connected to the atmosphere, the other to a sealed container
generally known as the backing volume. This backing volume needs a slight,
calibrated leak acting to protect the sensor and as a pneumatic filter. Too
great a pressure difference due to weather changes may damage the sensor. As
the ambient air pressure gradually changes pressure within the backing volume
equalises with this via the leak - effectively zeroing the sensor. The leak thus
acts as a pneumatic filter, removing very low frequency signals, less than 0.01
Hz caused by atmospheric pressure variation. The aim here being to measure
infrasound rather than barometric variation due to the weather.
The backing volume is a hermetically sealed box connected via a tube to
the sensor. A fine capillary tube gradually relieves pressure differences between
the inside and the atmosphere. A suitable pressure equalisation period of 100-Novel Infrasound Monitor Project - real geophysics research on a budget 6
t
af
Figure 3: Pneumatic Filter ‘Backing Volume’
200s require the capillary bore and length to be matched with the volume of the
Dr
enclosure fig 3. This volume & capillary may be modelled as a resistor-capacitor
circuit with an acoustic resistance R which may be defined as [5]
8η
R= l (5)
πr4
Where r and l are the radius and length of the capillary and η the shear viscosity
of the ambient air (η ' 1.8 × 10⁻⁵ kgm−1 s−1 ).
Similarly the acoustic capacitance may be modelled as
v
C= (6)
γP
with γ the adiabatic gas constant (γ = 1.40), v the chamber volume and P ambient
pressure.
Thus we may define the backing volume’s time constant, analogous to τ = RC
as
v 8ηlv
τ = RC = R = 4 (7)
γPa πr γPaNovel Infrasound Monitor Project - real geophysics research on a budget 7
We may now calculate the length and radius of a suitable capillary for a given
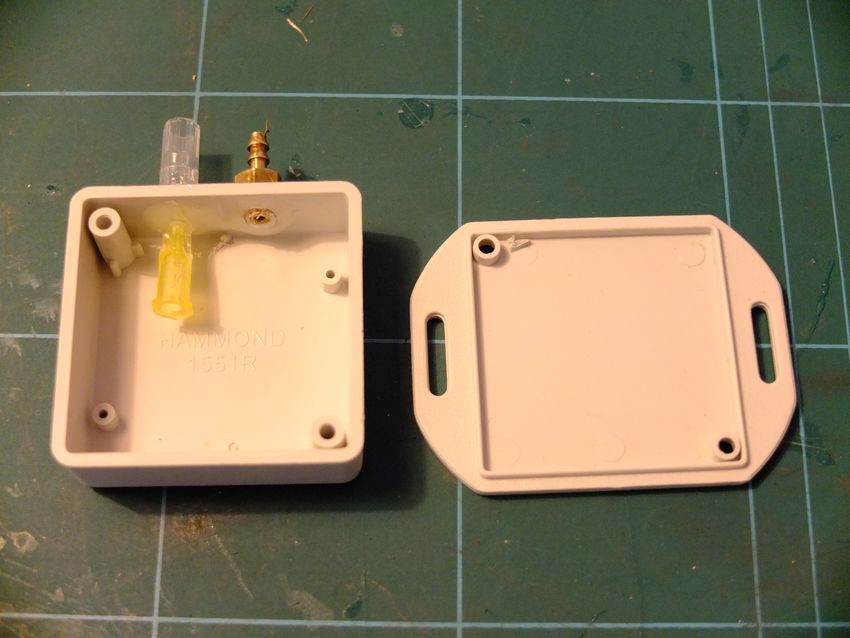
backing volume. Precision capillary tubing may be prohibitively expensive. A
fine hypodermic needle (30G, 0.3x13mm), readily available online, glued into a
pre-drilled hole in a Hammond 1551RFLGY plastic enclosure has been shown to
exhibit a suitable time-constant of 100-150s.
6. The Raspberry PI
The Raspberry Pi is the workhorse of the system. Software has been written in
Python which interrogates the mems sensor approximately 40 times per second.
These pressure readings are stored every few minutes until midnight when the
cumulative day’s readings are saved and a new day’s recording begun. At intervals
(15 minutes in the case of my own systems) two plots , one of raw pressure (Fig
5) and one of acoustic power are generated and saved to disc. These are uploaded
to a remote website hourly by a separate crontab script via ftp. The entire system
draws about 8 watts and has been left running unattended now for over 2 years.
t
Data is viewed and downloaded for detailed analysis over the Internet.
af
Dr
Figure 4: Complete rig no 3
The static device may left in some dusty forgotten corner of a loft-space orNovel Infrasound Monitor Project - real geophysics research on a budget 8
outbuilding uploading plots to a website. When some notable event occurs, such as
a storm or sonic boom one downloads the raw data file for more detailed analysis.
Data is saved in the geophysics standard .mseed format permitting signal
analysis using a range of geophysics software. Routines have been written in the
open-source python ObsPy suite to facilitate a range of analysis. These may be
readily extended by keen students giving a valuable insight into programming and
such signal processing techniques as Fourier Analysis. A general purpose Python
program has been developed to give students a start on this, figs 8 & 10 .
t
af
Dr
Figure 5: Daily Raw Plot during Storm Ciara
For mobile use the Pi may be powered from a USB power-bank for a day
or so whilst a lead acid battery can keep it running for months. As the PI does
not have an internal clock a separate, high accuracy real-time clock is included in
the design to provide reliable timestamps when the system is powered up without
network access such as during field studies.Novel Infrasound Monitor Project - real geophysics research on a budget 9
7. Wind Filter
Local turbulance of wind across the sensor leads to extraneous noise [6] becoming
more pronounced at lower frequencies. Some sort of wind-filer is desirable. Many
different designs have been investigated - indeed this is ripe for original studies by
students. Suitable filters can be though of as averaging local pressure variations
across the filter, i.e. random turbulence causing a higher pressure at one part of
the filter is likely to be negated by a similarly lower pressure elsewhere whilst the
desired low frequency coherent signal is passed.
Common filers include; pipes or porous hose, foam blocks and tents - of the
camping variety[7]! Notably missing from literature is the humble loft-space.
A simple loftspace appears to do a good job of reducing noise presumably as
localised pressure variations cancel across its large surface. We have had two rigs
running since 2018. One in a domestic loft whilst the other is 8m away, outside in
the lee of an 8ft fence with a 30cl square foam pond filter acting as both noise and
environmental filter. Despite the external rig requiring a 2m hose, of 2mm bore,
t
running from the foam wind-shield it typically records absolute pressure variations
almost double those of the loft-space [8]. Differences in frequency response have
af
been observed and will be studied further.
We have tested the use of porous ‘garden sprinkler’ hose. A 20m length was
adapted by plugging both ends. From one plug emerges a narrow flexible tube to
the sensor head. This can le laid on the ground in a spiral or straight line. Tests on
Dr
an exposed windy beach indicated that the hose performed better than the foam
block at noise reduction.
8. Sample Results
8.1. Wind Turbine
On a blustery day we took readings some 100m from a local wind-turbine using a
spiralled 20m porous hose as a wind-filter. Interestingly infrasound levels during
the car journey dwarfed those at the site itself Fig 7.
Using the Obspy python routines Saul analysed the signals. Having filmed
the turbine he determined a ’blade pass frequency’ of 0.75Hz. He could reasonably
expect this to be the fundamental frequency f0 and see signals at this and its
harmonics nf0 . After trying various F.F.T. visualisations he did, exactly where
predicted except forf0 which, whilst strong, was masked by noise (note -log scale)
Fig 8.Novel Infrasound Monitor Project - real geophysics research on a budget 10
t
Figure 6: Pond filter tested alongside spiral hose
af
8.2. Gas Flare
About 5.5 km from the sensor and separated by low hills sits the Olefins No 6 plant
Dr
on Teesside, a large liquid naphtha cracker. The plant began ’flaring’ - burning
off gas, at approx 07:25 on 18/7/2017 (video [9]). A clear signal was picked up for
the 36 hours of the event. Shown in Fig 9 with the red and blue lines denoting
approximate start and end of the flare. The vertical axis shows pressure variation
in Pa.
8.3. Helicopter
A Chinook helicopter passed overhead with clear signals picked up by both
monitors (loftspace and outside). A simple wavelet analysis shows a clear signal
in the 5-12Hz range, with clean sin components at 2-3Hz figs 10 11 .Novel Infrasound Monitor Project - real geophysics research on a budget 11
t
af
Dr
Figure 7: Quiet gap in centre windfarm, either side - car journey
9. National and International Scope
There are few national infrasound networks outside those operated under the aegis
of the C.T.B.T.O. Seismometer networks such as IRIS have proved very popular
with schools. This is a new field and national networks of infra-sound stations could
generate much interest in budding physicists and geologists as well as producing
real scientific data.
10. Educational Benefits
Few pre-university science students have direct experience of real science. Projects
such as this can combine real science with real-world systems engineering. Stu-
dents may work in teams to build, test and install rather sophisticated real-timeNovel Infrasound Monitor Project - real geophysics research on a budget 12
Figure 8: Wind Turbine: f.f.t. showing fundamental and harmonics
t
af
Dr
Figure 9: Gas plant flaring 6km away
geophysics monitoring systems. When the initial install is up and running it can
them be further developed, different pressure sensors, various wind-shields such asNovel Infrasound Monitor Project - real geophysics research on a budget 13
t
af
Dr
Figure 10: Wavelet transform (f.f.t.) of helicopter approx 200m overhead at 10-12
min and 23-27 min
porous hose may be tested, wireless links between the sensor and base station, sta-
tistical filters added to the software. The system is designed this to be sufficiently
simple to allow construction by 11-16 yr olds (this has been done) whilst offering
sufficient development potential for older students. Students are attracted to the
combination of physics, computing and electronics along with space science and
geophysics.
Geophysics is under-appreciated, even at A-level despite the stellar career
prospects. Projects such as this could stimulate interest in geology, physics and
computing.Novel Infrasound Monitor Project - real geophysics research on a budget 14
Figure 11: Helicopter Infrasound Power bands
11. Further Information
t
af
The hardware costs are small, each sensor rig will cost no more than £100, less if
one has a spare P.C. or Raspberry Pi.
Detailed construction instructions and the software can be downloaded from
www.starfishprime.co.uk/downloads/downloads.html .
Dr
The authors have no commercial interest in this project nor with any
equipment suppliers with the project entirely self-funded. Design and code are
released open-source.
12. References
[1] “The infrasound network and how it works.”
https://www.ctbto.org/verification-regime/
monitoring-technologies-how-they-work/infrasound-monitoring/.
[2] “Ctbo map of signatories and monitoring stations.” https://www.ctbto.org/map/.
[3] “The official ctbto photostream.” https://www.flickr.com/people/40662521@N07/.
[4] “Techlib - infrasound.” http://www.techlib.com/area_50/infrasound.htm.
[5] Marcillo and Johnson, “Implementation, characterization, and evaluation of an inexpensive
low-power low-noise infrasound sensor based on a micromachined differential pressure
transducer and a mechanical filter.,” Journal of Atmospheric and Oceanic
Technology,Vol29, 2012.
[6] Raspet and Abbott, “New systems for wind noise reduction for infrasonic measurements.,”
Infrasound Monitoring for Atmospheric Studies, 2019.Novel Infrasound Monitor Project - real geophysics research on a budget 15
[7] Noble and Raspet, “Infrasound wind noise reduction via porous fabric domes.,” The
Journal of the Acoustical Society of America, 2014.
[8] “Digital high sensitivity infrasound monitor - real geophysics research on a budget.”
https://www.starfishprime.co.uk/projects/infrasound/infrasound.html, 2020.
[9] “Redcar sabic flare stack during machine trip.”
https://www.youtube.com/watch?v=QsZzawj1l8s, 2017.
[10] Bedard and Georges, “Atmospheric infrasound.,” Physics Today 53, 2000.
[11] Gitterman and Hofstetter, “Infrasound calibration experiment in israel: preparation and
test shots,” Proceedings of the 30th Monitoring Research Review ”Ground-Based Nuclear
Explosion Monitoring Technologies”, Portsmouth, Virginia, 2008.
[12] Hart and McDonald, “Infrasound sensor and porous-hose filter evaluation results,” 2008.
[13] Walker and Hedlin, “A review of wind-noise reduction methodologies.,” Infrasound
Monitoring for Atmospheric Studies, 2009.
t
af
DrYou can also read