DRAFT Wastewater Planning Project Draft Report - Town of Enfield, New Hampshire - Enfield NH
←
→
Page content transcription
If your browser does not render page correctly, please read the page content below
Town of
                                                      Enfield, New
                                                      Hampshire

                                                  T
                                 AF
                                                      Wastewater
                                                      Planning
                                                      Project
                        R
              D

                                                      Draft Report

                          DPC Engineering, LLC
                             22 Northfield Road,
                        Longmeadow, MA 01106
                P: 413-567-6310 F: 413-451-1030
                       www.DPCengineering.com         February 2021
…progressive solutions for municipal infrastructure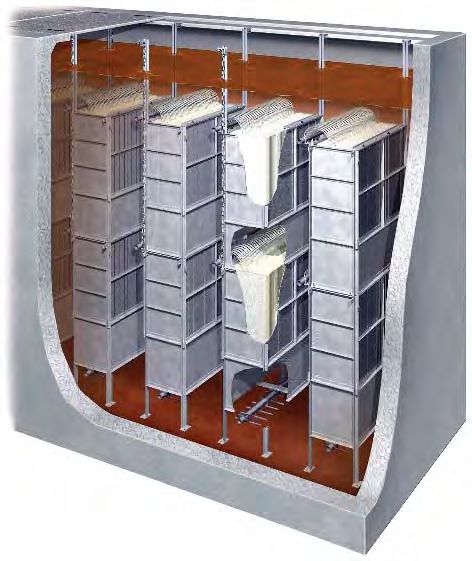
TABLE OF CONTENTS
SECTION                                                                                                               PAGE NO.
1.   INTRODUCTION AND BACKGROUND .................................................................. 1
     1.1        Project Overview .................................................................................................. 1
     1.2        Planning Area Background .................................................................................. 1
     1.3        Planning Period ................................................................................................... 3
     1.4        Scope of Work ..................................................................................................... 4
2.   WASTEWATER INFRASTRUCTURE...................................................................... 5
     2.1        Sanitary Sewer System ........................................................................................ 5
     2.2        Wastewater Treatment and Disposal ................................................................... 6
3.   LOCAL VERSUS REGIONAL ALTERNATIVES ..................................................... 7
     3.1        Alternative 1 – Sequencing Batch Reactor Local Alternative ................................ 7
     3.2        Alternative 2 – Membrane Bioreactor Local Alternative ...................................... 11
     3.3        Alternative 3 – Optimize Enfield Infrastructure Regional Alternative ................... 15
     3.4        Local Wastewater Site Evaluation ...................................................................... 16
     3.5        Impact To The Collection System (Local Alternatives) ....................................... 16

                                                                        T
     3.6        Groundwater Disposal System (Local Alternatives)............................................ 16
     3.7        Alternatives Evaluation....................................................................................... 17
4.
                                              AF
     IMPLEMENTATION PLAN..................................................................................... 20
     4.1        Wastewater Collection System........................................................................... 20
     4.2        Wastewater Pump Stations ................................................................................ 20
     4.3        Wastewater Treatment and Disposal ................................................................. 20
     4.4        Planning Level Opinion of Probable Costs ......................................................... 20
5.   WASTEWATER FINANCIAL MODEL ................................................................... 22
                               R
     5.1        Existing Rate Structure ...................................................................................... 22
     5.2        Benchmarking Analysis ...................................................................................... 22
     5.3        Current Sewer Budget........................................................................................ 23
     5.4        Sewer Capital Plan ............................................................................................ 23
                 D

     5.5        Sewer Rates and Revenues Projections ............................................................ 23
     5.6        Funding Alternatives .......................................................................................... 26
     5.7        Next Steps ......................................................................................................... 28

Town of Enfield, New Hampshire                              Page i                                                     Draft Report
Wastewater Planning Project                                                                                          February 2021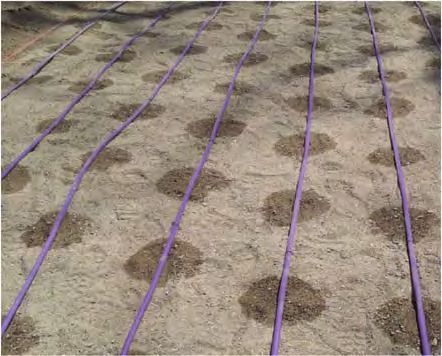
LIST OF REPORT TABLES
TABLE                                                                                                                          PAGE NO.
Table 1-1: Population Trends (1960 – 2010) ............................................................................................ 2
Table 1-2: Town and Sewer Service Area Population Trends ................................................................... 3
Table 2-1: Enfield Collection System Composition ................................................................................... 5
Table 2-2: Enfield Pump Stations ............................................................................................................. 6
Table 3-1: SBR Cycle Descriptions ......................................................................................................... 7
Table 3-2: Alternative 1 – Planning Level Operating Process Conditions ................................................. 9
Table 3-3: Alternative 1 – Planning Level Opinion of Probable Project Cost ............................................ 9
Table 3-4: Alternative 1 – Planning Level Opinion of Probable Annual O&M Costs ................................ 10
Table 3-5: Alternative 2 – Planning Level Operating Process Conditions ............................................... 13
Table 3-6: Alternative 2 – Planning Level Opinion of Probable Project Cost .......................................... 13
Table 3-7: Alternative 2 – Planning Level Opinion of Probable Annual O&M Costs ................................ 14
Table 3-8: Alternative 3 – Opinion of Probable Annual Costs................................................................. 15

                                                                                T
Table 3-9: Wastewater Site Evaluation Criteria ..................................................................................... 16
Table 3-10: Opinion of Probable Costs for Comparison ......................................................................... 18
                                                    AF
Table 3-11: Alternatives Summary Table – Annual Sewer Cost per EDU............................................... 18
Table 3-12: Alternatives Summary Table – Annual Sewer Cost as a Percent of MHI ............................. 18
Table 3-13: Matrix Analysis – Alternative Recommendation .................................................................. 19
Table 4-1: Recommended Improvements Plan and OPPC (CY2021) ..................................................... 20
Table 4-2: Recommended Improvements Phasing Plan by Calendar Year ............................................. 21
                                     R
Table 5-1: Summary of Sewer Customers Tiers (CY2021) ..................................................................... 22
Table 5-2: Sewer Rate Comparison ....................................................................................................... 22
Table 5-3: Sewer Budget Revenue and Expense Projections ................................................................. 24
                      D

Table 5-4: Sewer Rate and Average Annual Sewer Cost for Residential Sewer Users (Tier S3) ............. 25
Table 5-5: USDA Funding Eligibility Guidelines ...................................................................................... 28
Table 5-6: USDA Loan Categories ......................................................................................................... 28

Town of Enfield, New Hampshire                                     Page ii                                                      Draft Report
Wastewater Planning Project                                                                                                   February 2021
LIST OF REPORT FIGURES
FIGURE                                                                                                                  PAGE NO.
Figure R1: Population Trends (1960 – 2010)............................................................................................ 2
Figure R2: Town and Sewer Service Area Population Trends .................................................................. 3

                                             LIST OF ATTACHED FIGURES

Figure 2-1        Sanitary Sewer Collection System
Figure 3-1        Local WWTP Site Evaluation
Figure 3-2        Local WWTP Collection System Alternatives

                                                   LIST OF APPENDICES

Appendix A:        Force Main Alternative Opinion of Probable Costs

                                                                           T
                                                  AF
                                   R
                     D

Town of Enfield, New Hampshire                                 Page iii                                                  Draft Report
Wastewater Planning Project                                                                                            February 2021
1. INTRODUCTION AND BACKGROUND
1.1 PROJECT OVERVIEW
The Town of Enfield owns and operates a wastewater collection system that currently serves
approximately 619 sewer users in Enfield. The Town does not own and operate a wastewater
treatment facility, but instead discharges wastewater to the Lebanon Wastewater Treatment Plant
(WWTP) for treatment. Wastewater flows are conveyed to Lebanon via a force main (FM), and
flows travel through the City of Lebanon’s collection system before reaching the Lebanon WWTP
for treatment and disposal.
1.2 PLANNING AREA BACKGROUND
1.2.1 Background
The Town is located in the southwestern corner of Grafton County, New Hampshire, a part of the
Upper Valley Region of the State, approximately 11 miles east of the Connecticut River and the
State of Vermont. The Town is approximately 43.1 square miles is size, with a population of
approximately 4,582 as of the 2010 United States Census.
The Town is bordered to the west by Lebanon, the regional commercial and population center.
T
The Sullivan County Towns of Plainfield, Grantham and Springfield lie to the south, while Canaan
and Hanover are to the north, and Grafton to the east. Interstate 89 travels through the relatively
undeveloped southwestern portion of Town and State Highways 4 and 4A form the major arteries
AF
for the various villages that comprise Enfield. Mascoma Lake represents Enfield’s lowest elevation
at 751 feet above sea level, while the highest elevation is over 2,000 feet in a small area near
Halfmile Pond.
The Route 4 and Route 4A corridors are served by the Town’s sanitary sewer collection system
which conveys wastewater to the City of Lebanon’s WWTP. The Enfield collection system was
constructed in 1988. Prior to construction of the wastewater collection system, untreated sewage
R
from Enfield was a major source of pollution to the Mascoma River and Lake.
1.2.2 Organizational Profile
The Town is governed by an elected three-member Board of Selectmen. The Board of Selectmen
D
meets regularly to review budgets, capital projects, and hold public hearings. The Town also has
several other Boards, Committees and Departments of both elected and appointed members that
carry out municipal activities, set policies, and hold public forums to solicit resident and business
input. Town Meetings are held throughout the year to approve the budget and other warrant
articles.
Town Departments and Boards directly involved in wastewater asset management planning
include the Board of Selectmen, the Town Manager, and the Department of Public Works. The
responsibility of the Department of Public Works is oversight, management and operation of the
Sanitary Sewer Collection System and Wastewater Pump Stations. For parcels not served by
the sanitary sewer system, property owners are responsible for the operation and maintenance
of their on-site wastewater disposal systems (septic systems).
1.2.3 Geographic Profile
The Town is intersected by Interstate 89 as it travels North/South through the southwestern
portion of Town. The nearest major urban population centers in the State of New Hampshire
include the City of Concord, which is 55 miles to the southeast, and the City of Manchester, which
is 75 miles to the southeast.
Town of Enfield, New Hampshire Page 1 Draft Report
Wastewater Planning Project February 2021The Town was incorporated in 1761. The total land area is approximately 40.3 square miles. The
Town has mostly been developed in the vicinity of the Route 4 and Route 4A corridors. The Town
is primarily a rural residential community with some commercial development centered along the
Route 4 and Route 4A corridors. The majority of undeveloped areas are zoned for agricultural
use and a large portion of the agricultural land is permanently protected from development.
1.2.4 Demographic Profile
Historical population information provided by the United States Census Bureau from 1960 to 2010
is provided in Table 1-1. The Town experienced a 15.8% increase in population in the 1960s,
followed by a 25.6% increase in population in the 1970s and a 35.4% increase in the 1980s. The
population increased again during the 1990s by 25.3% and by 16.1% in the 2000s. Over the past
60-years the United States Census Bureau data indicates that the Town has an increasing
population trend, which is contrary to the population trends for other rural communities throughout
New England as a whole. A summary of the population trends for the Town based on the
populations reported in the United States Census Bureau are presented below in Table 1-1.
Table 1-1: Population Trends (1960 – 2010)
T
Year Population % Change
1960 1,867 15.8%
1970
AF 2,345 25.6%
1980 3,175 35.4%
1990 3,979 25.3%
2000 4,618 16.1%
2010 4,582 - 0.8%
R
A graph of the population trends for the Town is presented below in Figure R1.
Figure R1: Population Trends (1960 – 2010)
D
6,000
5,000
4,000
Population
3,000
2,000
US Census
1,000 Census Trend
0
1950 1960 1970 1980 1990 2000 2010 2020
Year
Town of Enfield, New Hampshire Page 2 Draft Report
Wastewater Planning Project February 20211.3 PLANNING PERIOD
The planning period for this Project is from 2020 to 2040. To date, the collection system expansion
has been limited to the areas in the vicinity of Route 4 and Route 4A. The current sewer service
population is estimated at 1,387. Based on historical population trends provided by the United
States Census Bureau, it is estimated that the population will increase 47.5% by the year 2040.
This projected population increase may result in an estimated sewer service population of 1,689
for the sanitary sewer service area. A summary of the Town population and the sewer service
population projections is presented below in Table 1-2.
Table 1-2: Town and Sewer Service Area Population Trends
Town Estimated Sewer
Year
Population Service Population
1960 1,867 0
1970 2,345 0
1980 3,175 614
T
1990 3,979 770
2000 4,618 893
2010
AF 4,582 1,017
2020 5,548 1,387
2030 6,154 1,538
2040 6,760 1,689
A graph of the Town and sewer service population projections are presented in Figure R2.
R
Figure R2: Town and Sewer Service Area Population Trends
Population Trends
D
8,000
7,000
6,000
5,000
Population
US Census
Projection
4,000
Sewer Service
3,000 Sewer Growth
Census Trend
2,000
1,000
0
1960 1970 1980 1990 2000 2010 2020 2030 2040 2050
Year
Town of Enfield, New Hampshire Page 3 Draft Report
Wastewater Planning Project February 2021The projected sewer service population shown on Figure R2 includes infill with limited sewer
extensions within the existing sanitary sewer system. The projected sewer service population
does not include major expansions of the collection system.
1.4 SCOPE OF WORK
The scope of work of the Wastewater Planning Project focuses on the following components:
Background Information:
1. Review current wastewater IMA with Lebanon
2. Review past planning documents.
Local Wastewater Alternatives:
1. Evaluate sites in Town for the conceptual local WWTP.
2. Evaluate two wastewater treatment systems, including membrane bioreactor (MBR)
and sequencing batch reactor (SBR) configurations.
3. Evaluate conceptual sewer needs to redirect the Town’s wastewater flows to the in-
T
Town site.
4. Develop a capital improvement plan to integrate the proposed alternative.
5. Prepare an implementation plan for the recommendations, including funding/finance
AF
options, schedule and annualized cost projections.
Wastewater Financial Model:
1. Develop benchmarking for similar wastewater utilities.
2. Review current operation expenses, debt service, capital plan, and reserve funds.
3. Integrate the recommendations for the recommended local wastewater alternative
R
4. Develop a cash flow and revenue projections for the next 5 fiscal years.
5. Evaluate the anticipated sewer rates for the next 5 fiscal years.
D
Town of Enfield, New Hampshire Page 4 Draft Report
Wastewater Planning Project February 20212. WASTEWATER INFRASTRUCTURE
2.1 SANITARY SEWER SYSTEM
2.1.1 Sanitary Sewer Collection System
The Enfield sanitary sewer collection system includes approximately 45,260 linear feet (LF) of
gravity sewer and 226 manholes. The collection system converges to the Route 4A Pump Station,
before being pumped into the Lebanon collection system, flowing by gravity to the Lebanon
WWTP for treatment and disposal. There are six (6) pump stations in the Enfield collection
system. The collection system, shown in Figure 2-1, is comprised of 6 to 16-inch diameter gravity
sewers, constructed of DI and PVC pipe materials. The majority of the Enfield collection system
was constructed in the late 1980s with extensions in 1992 and 1997 to serve the Flanders Street
area and Prospect Hill area. Overall, the collection system is comprised of approximately 12%
ductile iron (DI) gravity sewer mains, and 88% polyvinyl chloride (PVC) gravity sewer mains. A
summary of the collection system by pipe type and pipe diameter is presented in Table 2-1.
Table 2-1: Enfield Collection System Composition
Percent of Total
T
Pipe Type Pipe Diameter (in) Pipe Length (lf)
System
DI 6 1,052 2.5%
AF
8 778 1.8%
12 2,630 6.2%
16 838 2.0%
PVC 8 30,679 72.1%
10 1,355 3.2%
R
12 3,076 7.2%
15 2,151 5.0%
Total = 42,560 100.0%
D
The collection system was GIS mapped and evaluated as part of the Wastewater Asset
Management Plan, and a summary of the flow monitoring, manhole inspections, and sonar testing
can be found in the Wastewater Asset Management Plan (Final Report) dated April 2020. The
recommended capital improvements and implementation plan for the collection system are
reflected in the Wastewater Financial Model presented in Section 5.
2.1.2 Wastewater Pump Stations
The Town owns and operates six (6) pump stations, listed in Table 2-2. The pump stations were
evaluated as part of the Wastewater Asset Management Plan, and a summary of the existing
conditions assessment, needs, and recommended capital improvements can be found in the
Wastewater Asset Management Plan (Final Report) dated April 2020. The recommended capital
improvements and implementation plan for the pump stations are reflected in the Wastewater
Financial Model presented in Section 5.
Town of Enfield, New Hampshire Page 5 Draft Report
Wastewater Planning Project February 2021Table 2-2: Enfield Pump Stations
Pump Station Name Location (Street)
Lakeview PS Route 4A
Lower Shaker Village PS Route 4A
McConnell Road PS McConnel Road
Route 4A Enfield PS Route 4A
Shaker Bridge PS Main Street
Wells Street PS Wells Street
2.2 WASTEWATER TREATMENT AND DISPOSAL
The Town does not own and operate a wastewater treatment facility, but instead discharges
wastewater to the Lebanon WWTP for treatment. Wastewater flows are conveyed to Lebanon
via a force main, and flows travel through the City of Lebanon’s collection system before reaching
T
the Lebanon WWTP for treatment and disposal. The Town has an intermunicipal agreement (IMA)
with Lebanon that allows for 300,000 GPD. The Lebanon WWTP is designed for 3.18 million
gallons per day (MGD), with peak flows up to 6 MGD.
2.2.1 Intermunicipal Agreement
AF
The IMA between the Town and the City was first executed in 2005. The IMA allows for a yearly
average flow of 300,000 GPD of wastewater to be conveyed from the Town to the Lebanon
WWTP for treatment and disposal. The IMA also included provisions to allow Enfield residents to
have their septic waste hauled to the Lebanon WWTP. The Town agreed to pay the City quarterly
based on the amount of wastewater (flow), as well as the wastewater characteristics, measured
by biological oxygen demand (BOD) and total suspended solids (TSS). A late payment charge of
R
9% was agreed upon if the City did not receive payment within 45 days. An update to the IMA
was executed in 2019. The IMA stipulates that the Town’s sewer ordinances are updated when
changes to the City’s sewer regulations are imposed. This puts the Town at a disadvantage
regarding management of its sewer system, and the fees it pays to Lebanon.
D
2.2.2 Recent Upgrades to the Lebanon WWTP & Collection System
The City of Lebanon completed a $10.6 million-dollar upgrades project at their WWTP in 2016.
Major components of the upgrades included a new influent screen, influent pumps, upgrades to
the primary clarifiers, primary sludge pumps, chemical feed systems, SCADA and HVAC,
dewatering, odor control, and biological nutrient removal (BNR) for nitrogen and phosphorous.
Lebanon is currently in the process of completing a $75 million-dollar combined sewer overflow
(CSO) sewer separation project. The sewer separation project includes separation of
approximately 15 miles of combined sewers in the City. The City is the midst of a 5-year sewer
rate increase at 7.2% per year to fund the debt service for the projects
Town of Enfield, New Hampshire Page 6 Draft Report
Wastewater Planning Project February 20213. LOCAL VERSUS REGIONAL ALTERNATIVES
3.1 ALTERNATIVE 1 – SEQUENCING BATCH REACTOR LOCAL ALTERNATIVE
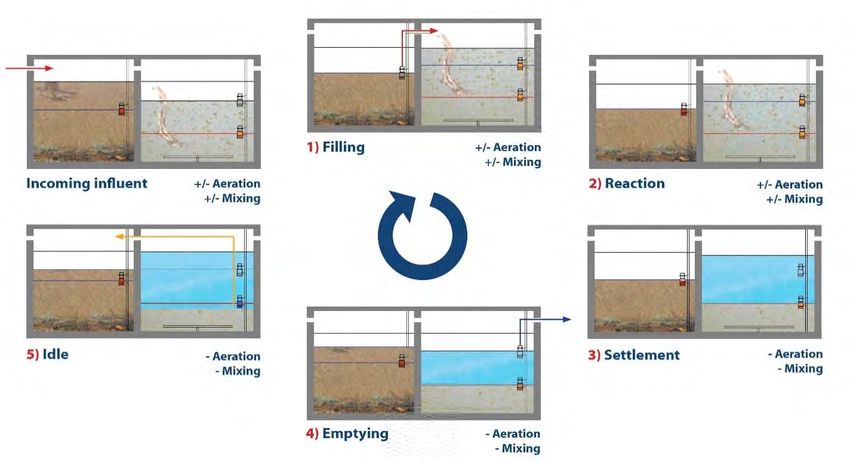
3.1.1 General Process Description
The Sequencing Batch Reactor (SBR) process is an activated sludge process that utilizes batch
(fill/draw) operations for treatment. The system batch operations can be configured with the
treatment and clarification of the wastewater occurring within one reactor which acts as both the
aeration basin and the secondary clarifier. The use of one reactor to accomplish multiple
operational tasks allows for an increased treatment capacity within the same footprint. The batch
reactor is sized to provide an aerobic zone that provides an oxygen rich environment necessary
for organic carbon removal. The reactor sequencing and process operations can also be
configured to provide enhanced treatment for nutrient removal if required. The same reactor also
provides quiescent conditions ideal for settling and separation of biological solids. A simple
process flow schematic is provided below. A general overview of the typical SBR cycles is
provided in Table 3-1.
T
Table 3-1: SBR Cycle Descriptions
Cycle Description
AF
The mix fill is the first cycle in the SBR process. During this cycle the reactor is fed influent
Mix – Fill wastewater while the mixed liquor suspended solids (MLSS) inventory within the reactor
is mixed.
During this cycle the reactor is fed influent wastewater while the MLSS inventory within the
React – Fill reactor is mixed and a dissolved oxygen concentration of 2.0 mg/L is maintained within
the reactor. During this cycle the reactor operates in a similar manner to an aeration basin.
R
During this cycle the reactor is operating in an identical manner to the React-Fill cycle with
React the exception that no influent wastewater is being fed to the reactor. During this cycle the
reactor operates in a similar manner to an aeration basin.
D
During this cycle the reactor turbulence has stopped and a quiescent reactor surface has
been created. The quiescent reactor surface allows for effective Type III and Type IV
Settle
settling of the MLSS via gravity. During this cycle the reactor operates in a similar manner
to a secondary clarifier.
The decant cycle is the last cycle in the SBR process. During this cycle the reactor volume
is being decanted by gravity to the downstream processes for further treatment. During
Decant/Idle this cycle the reactor operates in a similar manner to a secondary clarifier. If the decant is
completed before the cycle time is completed it enters an idle phase while it waits for the
next cycle to begin.
Town of Enfield, New Hampshire Page 7 Draft Report
Wastewater Planning Project February 2021T
Source: BioAzul
AF
3.1.2 Nitrogen Removal Capabilities
The efficiency of nitrogen removal in SBR process is a function primarily of the amount of readily
degradable organic carbon available in the influent and the reactor cycle times / hydraulic
retention times. With typical municipal wastewater influent characteristics, the SBR process, when
properly designed and operated has been demonstrated to achieve effluent nitrogen levels in the
range of 4.0 to 10.0 mg/L.
R
3.1.3 Phosphorous Removal Capabilities
The SBR process when operated as noted above does not provide for any biological phosphorous
removal except for the phosphorous required for cell growth. The SBR process operations can be
D
modified to optimize for biological phosphorous removal if needed.
3.1.4 Conceptual Process Design and Projected Performance
A desktop analysis and associated preliminary process calculations were completed for this
alternative. The desktop analysis anticipates that with proper operation and the anticipated
influent characteristics noted above the WWTP can achieve the following effluent requirements
of:
20 mg/L effluent biological oxygen demand (BOD) / total suspended solids (TSS)
1.0 mg/L effluent ammonia nitrogen
10 mg/L effluent total nitrogen (TN) with a 6-hour total cycle time.
3.1.5 Proposed Operating Parameters
This section provides additional details of the proposed operating parameters necessary for
implementation of this process. The operating parameters form the basis utilized for the
development of the planning level opinion of probable costs and outline the capabilities of this
alternative to be constructed for the current needs and expanded in the future should additional
treatment capacity be required. Based on the analysis completed the planning level current day
Town of Enfield, New Hampshire Page 8 Draft Report
Wastewater Planning Project February 2021and buildout operating conditions for this alternative are provided in Table 3-2. The current
average daily flow is approximately 0.075 MGD with a theoretical buildout condition average daily
flow of 0.300 MGD. The buildout condition includes the current average daily flow of
approximately 0.075 MGD.
Table 3-2: Alternative 1 – Planning Level Operating Process Conditions
Component Current Conditions Buildout Conditions
Average Daily Flow, MGD 0.075 0.300
Design Average Daily Flow, MGD 0.150 0.300
Equalization Basins Operational, each 1 1
Equalization Basins Volume, gal each 180,000 180,000
SBR Basins Operational, each 2 4
Reactor Volume, gal each 180,000 180,000
Total Reactor Volume in Service, gal 360,000 720,000
T
Operating MLSS, mg/L 4,500 4,500
SBR Cycles, per day 4 4
AF
SBR Cycle Times, hrs 6 6
3.1.6 Cost Estimate
The current day planning level opinion of probable costs for this alternative is approximately
$39,580,000. A summary of the planning level opinion of probable costs is provided in Table 3-3.
Table 3-3: Alternative 1 – Planning Level Opinion of Probable Project Cost
R
Unit Process Opinion of Probable Cost
Headworks Screening $940,000
D
Headworks Grit Removal $1,490,000
Influent Pump Station $770,000
SBR Process Equipment $5,100,000
SBR Concrete $8,450,000
Effluent Dosing Tank $2,110,000
Drip Dispersal System $600,000
Solids Processing System $1,070,000
Plant Water System $680,000
Main Electrical Gear $1,300,000
Emergency Generator $650,000
Process Building Area $1,170,000
Land Acquisition $3,900,000
Land Clearing and Preparation $520,000
Town of Enfield, New Hampshire Page 9 Draft Report
Wastewater Planning Project February 2021Unit Process Opinion of Probable Cost
Site Fencing $320,000
Site Restoration and Pavement $460,000
Construction Sub-Total $29,530,000
Allowance for Contingency, Engineering, Legal, Bond Counsel, and $10,050,000
Short-Term Interest (34%)
Opinion of Probable Project Cost (CY2021) $39,580,000
3.1.7 O&M Estimate
The current day planning level opinion of the annual operations and maintenance (O&M) costs
for this alternative is $984,000 per year. This estimate includes the costs associated with
operating the SBR WWTP, and the costs associated with operating the Town’s sanitary sewer
collection system. A summary of the planning level annual O&M costs for the SBR local alternative
is provided in Table 3-4.
T
Table 3-4: Alternative 1 – Planning Level Opinion of Probable Annual O&M Costs
Component Opinion of Probable Cost
AF
Operations Staff $408,000
Sewer Fund Administration $12,000
Process Electrical $110,000
Non-Process Electrical $11,000
Sludge Disposal $51,000
R
Solids Handling Operations $74,000
Supplemental Carbon Allowance $103,000
Alkalinity Allowance $28,000
D
Polymer Allowance $25,000
Fuel Allowance $12,000
Sub-Total of Annual O&M Costs $834,000
Equipment Maintenance Fund $50,000
Long-term Equipment Replacement/Capital Fund $100,000
Sub-Total of Annual Capital Funds $150,000
Opinion of Probable Annual O&M Cost (CY2021) $984,000
Town of Enfield, New Hampshire Page 10 Draft Report
Wastewater Planning Project February 20213.2 ALTERNATIVE 2 – MEMBRANE BIOREACTOR LOCAL ALTERNATIVE
3.2.1 General Process Description
The Four-Stage Bardenpho Process with a Membrane Bioreactor (MBR) is an activated sludge-
based nitrogen removal process with four distinct zones; a pre-anoxic zone, an aerobic zone, a
post anoxic zone and a re-aeration zone. The Four Stage Bardenpho process is configured to
take advantage of the typically high readily degradable organic carbon found in the influent
wastewater. The use of the high readily degradable organic carbon within the influent wastewater
provides an efficient and cost-effective source of organic carbon to drive the de-nitrification
process in the pre-anoxic zone. The pre-anoxic zone provides de-nitrification (reduction of nitrate
and nitrite (NOx) to Nitrogen gas) using the available readily degradable organic carbon in the
influent wastewater effectively removing the nitrogen returned to it (in the form of NOx), from the
end of the aerobic zone by way of an Internal Mixed Liquor Recycle (IMLR). The aerobic zone
provides the oxygen necessary for both organic carbon removal as well as nitrification (a two-step
biological process for the conversion of ammonia to nitrite and then nitrate). The IMLR typically
ranges from 100% to as much as 300% of the design flow and returns a portion of the nitrified
aerobic zone effluent to the pre-anoxic zone for de-nitrification. Because all of the aerobic zone
T
effluent cannot physically be returned to the pre-anoxic zone the aerobic zone effluent will contain
some residual nitrate.
Ultrafiltration membranes are submerged within the aeration basin and the aeration basin MLSS
AF
is double or triple the concentration of a normal activated sludge system. The increase in the
MLSS effectively increases the biomass within the aeration basin allowing for an increased
treatment capacity within the same footprint. A simple process flow schematic is provided below.
R
D
3.2.2 Ultrafiltration Membranes
The ultrafiltration membranes are an engineered solids separation technology, which are carefully
designed to utilize a nominal pores size in the range of 20 – 40 nm for solids separation.
Ultrafiltration membranes utilize a solids flux along a pressurized membrane barrier to produce a
high purity water. The pressurized membrane acts as a physical barrier for suspended solids,
non-soluble organics, bacteria, viruses, endotoxins and other pathogens. In wastewater
treatment the ultrafiltration membranes are immersed in an aeration tank, in direct contact with
mixed liquor. Through the use of a permeate pump, a vacuum is applied across membranes. The
vacuum draws the treated water through the hollow fiber ultrafiltration membranes. Permeate is
Town of Enfield, New Hampshire Page 11 Draft Report
Wastewater Planning Project February 2021then discharged to downstream processes for further treatment
(usually to disinfection). Periodically scour air is introduced into the
membrane module to scour the external surface of the membrane
fibers. The scour air produces turbulence within the membrane and
transfers rejected solids away from the membrane surface as part of
a recycle to the aerobic zone. Ultrafiltration membranes are typically
operated at MLSS concentration in the range of 8,000 to 12,000
mg/L (typically 2,000 to 4,000 mg/L for conventional systems). In its
simplest form the ultrafiltration membrane process combines the unit
operations of aeration, secondary clarification and filtration systems
into a single process, thus simplifying operations and significantly
reducing the overall system space requirements. One of the
benefits of an ultrafiltration membrane system is that it is possible to
handle extremely high organic loads in a compact footprint.
3.2.3 Nitrogen Removal Capabilities
The efficiency of nitrogen removal in pre-anoxic zone of the Four-Stage Bardenpho process is a
T
function primarily of the amount of readily degradable organic carbon available in the influent and
the IMLR rate. The efficiency of nitrogen removal in post-anoxic zone of the Four-Stage
Bardenpho process is a function primarily of the amount of available readily degradable organic
and the hydraulic retention time within the post anoxic zone. With typical municipal wastewater
AF
influent characteristics, the Four-Stage Bardenpho process, when properly designed and
operated has been demonstrated to achieve effluent TN levels approaching the limits of
technology in the range of 2.5 to 3.0 mg/L.
3.2.4 Phosphorous Removal Capabilities
The Four-Stage Bardenpho process when operated as noted above does not provide for any
biological phosphorous removal except for the phosphorous required for cell growth. The Four-
R
Stage Bardenpho process operations can be modified to optimize for biological phosphorous
removal if needed.
3.2.5 Conceptual Process Design and Projected Performance
D
A desktop analysis and associated preliminary process calculations were completed for this
alternative. The desktop analysis anticipates that with proper operation and the anticipated
influent characteristics noted above the WWTP can achieve the following effluent requirements
of:
20 mg/L effluent BOD / TSS
1.0 mg/L effluent Ammonia Nitrogen
2.0 mg/L effluent TN
3.2.6 Proposed Operating Parameters
This section provides additional details of the proposed operating parameters necessary for
implementation of this process. The operating parameters form the basis utilized for the
development of the planning level opinion of probable costs and outline the capabilities of this
alternative to be constructed for the current needs and expanded in the future should additional
treatment capacity be required. Based on the analysis completed the planning level current day
and build out operating conditions for this alternative are provided in Table 3-5. The current
average daily flow is approximately 0.075 MGD with a theoretical buildout condition average daily
Town of Enfield, New Hampshire Page 12 Draft Report
Wastewater Planning Project February 2021flow of 0.300 MGD. The buildout condition includes the current average daily flow of
approximately 0.075 MGD.
Table 3-5: Alternative 2 – Planning Level Operating Process Conditions
Component Current Conditions Buildout Conditions
Average Daily Flow, MGD 0.075 0.300
Design Average Daily Flow, MGD 0.150 0.300
Equalization Basins Operational, each 1 1
Equalization Basins Volume, gal each 180,000 180,000
MBR Basins Operational, each 1 2
Aerobic Volume, gal each 100,000 100,000
Total Aerobic Volume in Service, gal 100,000 200,000
Anoxic Volume, gal each 100,000 100,000
T
Total Anoxic Volume in Service, gal 100,000 200,000
Operating MLSS, mg/L 8,000 12,000
3.2.7 Cost Estimate
AF
The current day planning level opinion of probable costs is approximately $35,180,000. A
summary of the planning level opinion of probable costs is provided in Table 3-6.
Table 3-6: Alternative 2 – Planning Level Opinion of Probable Project Cost
Unit Process Opinion of Probable Cost
R
Headworks Screening $940,000
Headworks Grit Removal $1,490,000
D
Influent Pump Station $770,000
MBR Process Equipment $4,160,000
MBR Concrete $5,440,000
Effluent Dosing Tank $2,110,000
Drip Dispersal System $600,000
Solids Processing System $1,070,000
Plant Water System $680,000
Main Electrical Gear $1,300,000
Emergency Generator $650,000
Process Building Area $1,950,000
Land Acquisition $3,900,000
Land Clearing and Preparation $520,000
Site Fencing $210,000
Town of Enfield, New Hampshire Page 13 Draft Report
Wastewater Planning Project February 2021Unit Process Opinion of Probable Cost
Site Restoration and Pavement $460,000
Construction Sub-Total $26,250,000
Allowance for Contingency, Engineering, Legal, Bond Counsel, and $8,930,000
Short-Term Interest (34%)
Opinion of Probable Project Cost (CY2021) $35,180,000
3.2.8 O&M Estimate
The current day planning level opinion of the annual O&M costs for this alternative is $1,210,000
per year. This estimate includes the costs associated with operating the MBR WWTP, and the
costs associated with operating the Town’s sanitary sewer collection system. A summary of the
planning level annual O&M costs for the MBR local alternative is provided in Table 3-7.
Table 3-7: Alternative 2 – Planning Level Opinion of Probable Annual O&M Costs
T
Component Opinion of Probable Cost
Operations Staff $408,000
Sewer Fund Administration $12,000
AF
Process Electrical $180,000
Non-Process Electrical $12,000
Sludge Disposal $61,000
Solids Handling Operations $64,000
Supplemental Carbon Allowance $256,000
R
Alkalinity Allowance $55,000
Polymer Allowance $0
D
Fuel Allowance $12,000
Sub-Total of Annual O&M Costs $1,060,000
Equipment Maintenance Fund $50,000
Long-term Equipment Replacement/Capital Fund $100,000
Sub-Total of Annual Capital Funds $150,000
Opinion of Probable Annual Cost (CY2021) $1,210,000
Town of Enfield, New Hampshire Page 14 Draft Report
Wastewater Planning Project February 20213.3 ALTERNATIVE 3 – OPTIMIZE ENFIELD INFRASTRUCTURE REGIONAL ALTERNATIVE
The third alternative is a “no-action” alternative, or continuing to rely on the City of Lebanon for
wastewater treatment and disposal. There would be no additional capital costs associated with
this alternative, aside from those presented in the Wastewater Asset Management Plan (Final
Report) dated April 2020, for the renewal of existing wastewater infrastructure.
3.3.1 O&M Estimate
The current day planning level O&M estimate is approximately $742,000 per year. This estimate
includes the costs associated with operating the Town’s sanitary sewer collection system, and
payment to the City of Lebanon for wastewater treatment and disposal. A summary of the planning
level annual O&M costs for Alternative 3 is provided in Table 3-8.
Table 3-8: Alternative 3 – Opinion of Probable Annual Costs
Component Opinion of Probable Cost
Sewer Fund Personnel Administration $32,000
T
Sewer Fund Administration $66,500
Contracted Services $800
Survey & Engineering $4,300
AF
Electrical Utilities $14,900
Heating Oil $100
Heating Gas $400
Collection System Maintenance $25,600
Pump Station Maintenance $16,000
R
Equipment Rental $400
Supplies $2,200
D
Odor Control $2,600
Water Meters $2,200
Gasoline $1,100
Diesel Fuel $100
Grounds & Easement Maintenance $1,100
Vehicle/Equip Repairs/Maintenance $600
New & Replacement Equipment $1,100
Wastewater Treatment Fees to Lebanon $520,000
Sub-Total of Annual O&M Costs = $692,000
Equipment Maintenance Fund $50,000
Sub-Total of Annual Capital Funds = $50,000
Opinion of Probable Annual Cost = $742,000
Town of Enfield, New Hampshire Page 15 Draft Report
Wastewater Planning Project February 20213.4 LOCAL WASTEWATER SITE EVALUATION
Implementation of a local wastewater alternative will require a location in Town for the proposed
WWTP and disposal system. Based on discussion with New Hampshire Department of
Environmental Services (NHDES), it is unlikely that EPA will issue a new NPDES permit for
surface water disposal, requiring a groundwater discharge permit for a local alternative. Fourteen
potential sites in Town were evaluated as potential locations for a local WWTP. These sites,
shown in Figure 3-1, included Town-owned parcels and private parcels (which would require
purchase by the Town, an easement, or land taking) that are large enough to construct both a
WWTP and groundwater disposal system.
Each site was evaluated and scored from 1 through 5, with 5 being optimal and 1 being sub-
optimal, on the criteria listed in Table 3-9.
Table 3-9: Wastewater Site Evaluation Criteria
Evaluation Criteria Minimum Score Maximum Score
Lot Size 1 5
T
Soils 1 5
Proximity to Existing Sewer System 1 5
Environmental/Permitting
AF 1 5
Land Availability/Ownership 1 5
Social/Public Acceptance 1 5
Based on the evaluation criteria, two sites were selected by Town staff for further evaluation.
These sites include Site A (Parcel #010-010-000-000) Evenchance Road and Site J (Parcel #014-
069-000-000) 453 US Route 4. The costs associated with construction of a local wastewater
R
treatment and disposal system at Site A (Site Alternative A) and Site J (Site Alternative J) are
discussed in Section 3.5.
3.5 IMPACT TO THE COLLECTION SYSTEM (LOCAL ALTERNATIVES)
D
Implementation of a local wastewater alternative will require reconfiguration of the Town’s existing
wastewater collection system. The proposed collection system reconfiguration for each of the two
site alternatives is shown in Figure 3-2. Both alternatives require construction of a new pump
station at the Enfield/Lebanon Town line to redirect wastewater flows that currently discharge into
the City of Lebanon’s collection system. Site Alternative A requires construction of approximately
450 LF of force main to convey flows to the proposed site. The planning level opinion of probable
costs is $3,146,000. Site Alternative J requires construction of approximately 16,200 LF of force
main, as well as modifications to the Shaker Bridge PS, to convey flows to the site. The planning
level opinion of probable costs is $24,532,000. Detailed OPCs for the collection system
reconfigurations for Site A and Site J are provided in Appendix A.
3.6 GROUNDWATER DISPOSAL SYSTEM (LOCAL ALTERNATIVES)
Implementation of a local wastewater alternative will require construction of a means to dispose
of the treated wastewater back into the natural environment. NHDES has published Land
Treatment and Disposal of Reclaimed Wastewater: Guidance for Groundwater Discharge
Permitting, which provides guidance for obtaining permits to develop new groundwater
discharges. In New Hampshire, the use of reclaimed wastewater has been limited to discharges
Town of Enfield, New Hampshire Page 16 Draft Report
Wastewater Planning Project February 2021to the land surface to: 1) recharge aquifers; 2)
irrigate turf at golf courses; or 3) make snow.
Discharge to the local groundwater bodies is most
feasible for Enfield.
The NHDES groundwater discharge guidance is
broken into four (4) main reclaimed wastewater
disposal methods: 1) rapid infiltration (RI) systems;
2) slow rate (SR) infiltration systems; 3) spray
irrigation of turf at golf courses; and 4) snow making.
As discussed prior, discharge directly to
groundwater is the most feasible option for Enfield.
RI systems require highly permeable soils, while SR
systems can be successful on moderately
permeable or forested land. At this stage of the
planning process, the more conservative design Typical Effluent Disposal System
approach is to assume the use of a SR system. Installation
T
SR systems can include spray irrigation or drip
irrigation/drip dispersal methods. Based on the requirement of year-round disposal, drip dispersal
was selected as the alternative to be considered for Enfield. Drip dispersal is operable throughout
the year and is useful where slopes or soils may not support any other conventional method of
AF
wastewater disposal. These subsurface SR disposal systems require pretreatment and filtration
and are operated under pressure. The treated wastewater is applied to soil slowly and uniformly
using a network of narrow tubing placed below ground at shallow depth. Drip dispersal systems
are also typically less disruptive to construct.
While treatment systems can be constructed in relatively small footprints, the effluent groundwater
disposal systems require multiple acres of land. As such, land acquisition (and improvement of
R
the land prior to construction) is a major cost consideration of effluent disposal systems.
3.7 ALTERNATIVES EVALUATION
3.7.1 Selection of a Local Site
D
Based on the costs presented in Section 3.5, Site Alternative A is the only practicable alternative.
Construction of a force main from the Enfield/Lebanon Town line to Site Alternative J would be
cost prohibitive, and is not economically viable for the Town.
3.7.2 Summary of Alternatives and Opinion of Probable Project Costs
Three alternatives were evaluated for wastewater disposal. The alternatives were:
Alternative 1 –SBR Local Alterative at Alternative Site A
Alternative 2 –MBR Local Alternative at Alternative Site A
Alternative 3 – Optimize Enfield Infrastructure Regional Alternative
The planning level opinion of the probable construction costs for each alternative is provided
below. The planning level opinions of the probable costs were developed without the benefit of
final design drawings and may not reflect actual installed costs. These costs are to be used for
planning purposes, only. Opinions of probable costs have been developed based on similar
recent projects and equipment manufacturers’ cost data. The current day (CY2021) opinion of
probable cost includes soft costs such as engineering and contingency, and are shown in Table
3-10.
Town of Enfield, New Hampshire Page 17 Draft Report
Wastewater Planning Project February 2021Table 3-10: Opinion of Probable Costs for Comparison
Component Alternate 1 Alternate 2 Alternate 3
Local - SBR Local - MBR Regional
Opinion of Capital Costs - WWTP $39,650,000 $35,340,000 $0
Opinion of Capital Costs - FM $3,146,000 $3,146,000 $0
Annual O&M Costs $834,000 $1,060,000 $692,000
Annual Capital Costs $150,000 $150,000 $50,000
3.7.3 Comparison of Alternative and Impacts to Sewer Costs
The opinions of probable project costs were escalated to the years of implementation for the
comparison of alternatives. Three financing sources were evaluated for the two local projects:
conventional financing at 3% per year over 20 years, NHDES Clean Water State Revolving Fund
(CWSRF) financing at 2% over 20 years, and United State Department of Agriculture Rural
Development (USDA-RD) financing at 3% over 40 years (assuming no grant). These
funding/financing programs are discussed in detail in Section 5. For the regional alternative, it
T
was assumed that the wastewater treatment and disposal costs to Lebanon will continue to rise
at a rate of 8% per year. A summary of the cost per EDU and annual sewer cost as a percent of
MHI in CY2024 are shown in Table 3-11 and Table 3-12.
AF
Table 3-11: Alternatives Summary Table – Annual Sewer Cost per EDU
Alternative Conventional NHDES CWSRF USDA-RD
Alternative 1 - SBR $6,628 $6,202 $4,414
Alternative 2 -MBR $6,373 $5,994 $4,401
Alternative 3 – Regional $1,612 $1,612 $1,612
R
Table 3-12: Alternatives Summary Table – Annual Sewer Cost as a Percent of MHI
Alternative Conventional NHDES CWSRF USDA-RD
D
Alternative 1 - SBR 14.1% 13.3% 9.6%
Alternative 2 -MBR 14.6% 13.7% 10.1%
Alternative 3 – Regional 3.8% 3.8% 3.8%
3.7.4 Alternative Evaluation Matrix
The matrix analysis utilized to determine the recommend alternative is summarized in Table 3-
13. The matrix has been provided to compare key criteria including compatibility of the alternative
with the existing infrastructure, project capital and operational costs, and develop a
recommendation of a preferred alternative for implementation.
Town of Enfield, New Hampshire Page 18 Draft Report
Wastewater Planning Project February 2021Table 3-13: Matrix Analysis – Alternative Recommendation
Alternative 1 Alternative 2 Alternative 3
Local - SBR Local - MBR Regional
Criteria
Score Score Score
Capital Costs 1 1 5
Yearly Operational Costs 4 3 5
Operational Flexibility 5 5 1
Future Expansion Sustainability 5 5 3
Site Constraint Requirements 1 1 5
Impact to the Collection System 2 2 5
Management/Control Flexibility 5 5 1
Chemical Consumption 3 3 5
T
Electrical Consumption 2 2 5
Permitting 1 1 5
Resiliency 5 5 5
AF
Total 34 33 45
The ranking criteria range from 5, being good, to 1, being poor. At a planning level Alternative 1
and Alternative 2 have similar capital costs. Based on the capital and operational costs, site
constraints, and permitting challenges, Alternative 3 - Optimize Enfield Infrastructure
Regional Alternative is recommended.
R
D
Town of Enfield, New Hampshire Page 19 Draft Report
Wastewater Planning Project February 20214. IMPLEMENTATION PLAN
4.1 WASTEWATER COLLECTION SYSTEM
As summarized in the Wastewater Asset Management Plan, the Enfield collection system is in
fair condition. The majority of the existing infrastructure is in good condition; however, access is
difficult throughout a significant portion of the collection system. We recommended that the Town
implement the recommended plan as summarized in the Wastewater Asset Management Plan
(Final Report) dated April 2020, including improvement of access to the collection system, and
further evaluation of the infrastructure.
4.2 WASTEWATER PUMP STATIONS
As summarized in the Wastewater Asset Management Plan, the majority of the mechanical
equipment and components in operation at the pump stations are approximately 20-30 years old,
and the typical useful life of mechanical equipment is 20 years. We recommended that the Town
implement the recommended plan as summarized in the Wastewater Asset Management Plan
(Final Report) dated April 2020, including upgrades to the mechanical equipment and components
as well as the physical structures of the Town’s pump stations.
T
4.3 WASTEWATER TREATMENT AND DISPOSAL
Based on the alternative’s evaluation of the local versus regional treatment alternatives presented
in Section 3, we recommended that the Town implement Alternative 3 – Optimize Enfield
AF
Infrastructure Regional Alternative, and continue to utilize the City of Lebanon’s WWTP for
treatment and disposal. The costs associated with the local alternatives are unaffordable absent
a major grant from USDA-RD or other funding sources. Pending any major changes to the fee
that the Town pays the City for treatment and disposal, the Town should continue its relationship
with the City of Lebanon, and revisit this evaluation should the fee rise significantly. Another factor
that could affect the affordability of the local alternatives is the number of sewer customers. If the
Town of Enfield is able to grow the number of sewer customers significantly, it could decrease
R
the cost per household and warrant the consideration of a local treatment alternative.
4.4 PLANNING LEVEL OPINION OF PROBABLE COSTS
The current day planning level opinion of probable costs for the Recommended Implementation
D
Plan are provided in Table 4-1, and include costs carried forward from the Wastewater Asset
Management Plan for the sanitary sewer collection system and pump stations. The recommended
plan by calendar year is provided in Table 4-2.
Table 4-1: Recommended Improvements Plan and OPPC (CY2021)
Component OPPC
Sanitary Sewer System (Years 1 $388,000
through 5)
Pump Stations $11,254,000
Wastewater Treatment and Disposal $0
Total = $11,642,000
The costs presented in Table 4-1 were developed without benefit of final design drawings and
may not reflect actual installed costs; these costs are to be used for planning purposes only.
Opinions of probable costs have been developed based on similar recent projects and preliminary
equipment manufacturers’ cost data. Line-item costs are to be considered installed costs,
Town of Enfield, New Hampshire Page 20 Draft Report
Wastewater Planning Project February 2021including contractor overhead and profit and start-up and operator training. The opinion of cost
includes soft costs such as engineering and contingency. The costs for the Project provided in
Table 4-1 have not been escalated to the years of construction. All project costs are presented
in current dollars and need to be escalated to the midpoint of construction. The recommended
improvements phasing by calendar year and proposed implementation plan are shown in Table
4-2.
Table 4-2: Recommended Improvements Phasing Plan by Calendar Year
Starting Ending
OPPC
Component Calendar Calendar
(CY2021)
Year Year
Sanitary Sewer System $388,000 2022 2026
Pump Stations $11,254,000 2022 2041
Wastewater Treatment and $0 N/A N/A
Disposal
T
Total = AF $11,642,000 2021 2040
R
D
Town of Enfield, New Hampshire Page 21 Draft Report
Wastewater Planning Project February 20215. WASTEWATER FINANCIAL MODEL
5.1 EXISTING RATE STRUCTURE
The Town utilizes an Enterprise Fund for its wastewater utility. The revenues for the Enterprise
Fund are generated through a sewer user fee system based on the water consumption of each
customer. The revenues are utilized for funding the annual operation and maintenance (O&M)
costs of the wastewater utility as well as capital expenditures and debt service. Sewer customers
are categorized into seven tiers based on their quarterly sewer consumption, and are charged a
variable fixed cost share, sewer consumption per 1000 gallons, and sewer deficit charge per 1000
gallons based on their tier. The sewer deficit charge is a temporary charge to offset the sewer
deficit. The Town plans to recoup the deficit and remove the charge by the end of CY2023. A
summary of the sewer tiers is shown in Table 5-1.
Table 5-1: Summary of Sewer Customers Tiers (CY2021)
Sewer Deficit
Consumption Fixed Cost Sewer Rate per
Sewer Tier Rate per 100
(gal/quarter) Share 1000 gal
gal
T
S1 0-1,999 $27.00 $20.64 $6.15
S2 2,000-5,999 $54.00 $20.64 $6.15
S3 6,000-14,999
AF $76.00 $20.64 $6.15
S4 15,000-23,999 $108.00 $20.64 $6.15
S5 24,000-44,999 $146.00 $28.81 $8.57
S6 45,000-59,999 $227.00 $28.81 $8.57
S7 60,000+ $308.00 $28.81 $8.57
R
5.2 BENCHMARKING ANALYSIS
A benchmarking analysis was completed to help the Town understand how it compares to its
peers in terms of its current sewer rates. A number of similar sized communities and wastewater
D
utilities were evaluated for the rate comparison, and a number of factors were considered
including: population, geography, size of the sewer system, median household income, and
method of treatment. Sewer consumption was normalized for the comparison, and based on an
average usage of 72,000 gallons per year. Four communities were chosen for comparison and
summarized in Table 5-2.
Table 5-2: Sewer Rate Comparison
Average Annual
Community % of MHI
Sewer Bill1
Statewide $679 1.13%
2
Enfield $1,651 2.00%
Lebanon $953 1.48%
Wolfeboro $1,113 2.18%
Holderness (Plymouth Village
$926 1.38%
W&S District)
Town of Enfield, New Hampshire Page 22 Draft Report
Wastewater Planning Project February 2021Average Annual
Community % of MHI
Sewer Bill1
Conway (Conway Village Fire
$1,277 2.14%
District)
Notes:
1. Based on usage of 200 gal/day (6,000 gal/month; 72,000 gal/year).
2. Excludes temporary sewer deficit charge.
5.3 CURRENT SEWER BUDGET
The Town’s sewer budget can be designated into three categories: O&M, capital projects, and
debt service. O&M represents the expenses required to operate and maintain the sewer system
on a daily basis. This includes fixed costs such as staffing salaries to variable costs such as
electricity. Capital projects are projects that are required to evaluate, updated, and maintain the
sewer infrastructure, and can be either one time or recurring costs. Debt service includes all debt
payments that have been taken on by the Sewer Enterprise Fund.
5.4 SEWER CAPITAL PLAN
T
The Town carries an allowance for capital in its sewer budget for small capital projects. Larger
capital projects are presented to the Town and voted on at the Annual Town Meeting. Most
AF
recently, the Town voted against the proposed $1.9 million dollar project to make improvements
to the sewer system at the 2020 Annual Town Meeting. The Town prepares a capital
improvements plan (CIP) every five years. The most recent CIP, which includes CY2020-2025,
includes one recommended sewer capital project for the replacement of the generator at the
Shaker Bridge PS in CY2022. This capital project, along with the recommended capital
improvements as presented in the Wastewater Asset Management Plan (Final Report) dated April
2020, were integrated into the Wastewater Financial Model.
R
5.5 SEWER RATES AND REVENUES PROJECTIONS
Impacts to the sewer rates were modeled based on the current rate structure. The impacts of the
regional and local wastewater alternatives to the sewer rates and are shown in Table 3-12 and
D
Table 3-13 in Section 3. Based on the recommended alternative, Alternative 3 – Optimize Enfield
Infrastructure Regional Alternative, the projected sewer rates were modeled over the next 5 years.
These sewer rate projections include the Town’s current O&M budget, increased at 3% per year,
the CIP recommended by the Town, the CIP as recommended in the Wastewater Asset
Management Plan, and the existing sewer debt service. The temporary sewer deficit charge was
not included in this evaluation, as the Town already has a plan in place to recoup the deficit.
A summary of the revenue and expense projections for CY2022 to CY2026 are shown in Table
5-3, and a summary of the projected sewer rates and average sewer costs for CY2022 to CY2026
are shown in Table 5-4. The same percent increase to the sewer rate per 1,000 gallons and fixed
sewer cost share was used for all sewer tiers. Based on recent sewer revenues that average
sewer consumption is 42,000 gallons per year. The rate projections shown are for sewer
customers that fall into the S3 tier (6,000 – 14,999 gallons/quarter), which is where the majority
of residentials sewer users fall.
Town of Enfield, New Hampshire Page 23 Draft Report
Wastewater Planning Project February 2021You can also read