DRIHM and DRIHM2US: e-Infrastructures for hydro-meteo research
←
→
Page content transcription
If your browser does not render page correctly, please read the page content below
DRIHM and DRIHM2US:
 e-Infrastructures for
hydro-meteo research

                Fabio Delogu
          CIMA Research Foundation

            fabio.delogu@cimafoundation.org

                   in cooperation with:

 A. Provenzale, D. Kranzlmueller, J. von Hardenbergh, E.
Palazzi, A. Pieri, A. Clematis, D. D’Agostino, A. Galizia, D.
 Gochis, M. Schiffers, F. Siccardi, A.Parodi, N. Rebora, L.
           Molini, E. Fiori, T. Bedrina, F. Viterbo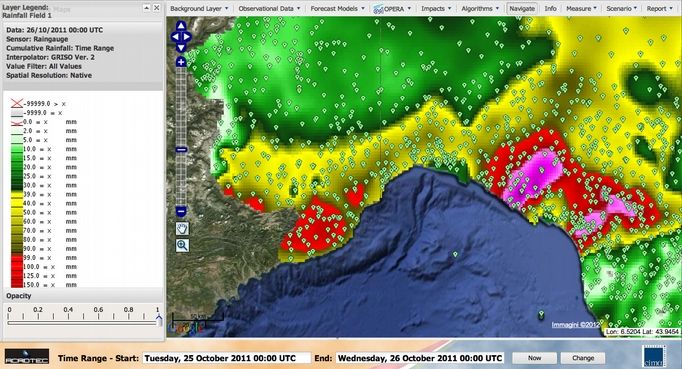
Outlook

l Motivations
l Severe events classification
l Mediterranean area and a paradigmatic event
l Hydro-meteorology and e-Infrastructure:
  DRIHM project
l DRIHM2US project
l Conclusions
Motivations
l Severe storms, and floods/flash-floods are highly
  impacting on human society and economical activities

Left panel: annual damages ($USA billion) caused by reported natural disasters (1990
    – 2009, source:/www.emdat.be, International Disaster Database). Right panel:
number of people affected by natural disasters (1950-2009, source:/www.emdat.be).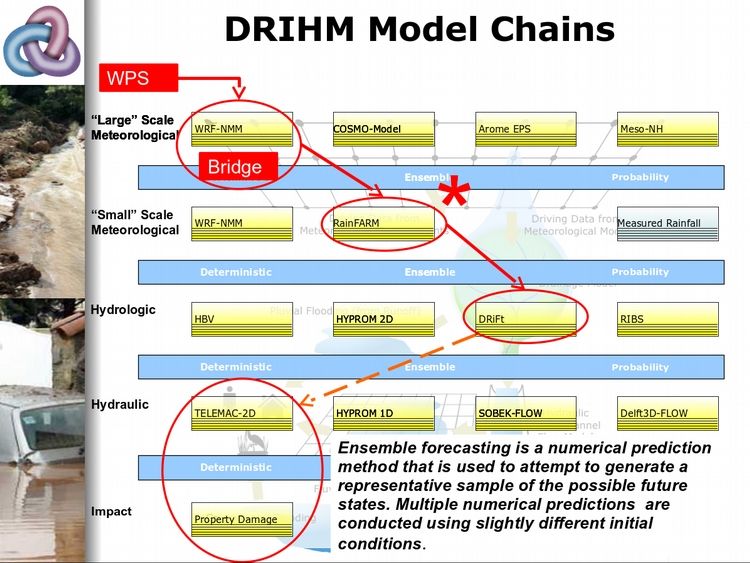
Motivations

The Mediterranean region

                                      SSMI and raingauge
                                         observations
                                         1978-1994

l The FLASH project estimated over 29 billion euros the
  material damages produced by floods in the Mediterranean
  region during the 1990-2006 period
l The total number of casualties has been estimated over
  4,500, concentrating in the Mediterranean African
  countries.
Severe events classification

             Molini et al. developed a
             procedure to single out heavy
             rainfall events and to classify
  Type I
             them on the basis of:
 d=19 hrs
             1.Duration
             2.Spatial extent
             3.Large/small-scale triggering

            Molini, L., Parodi, A., & Siccardi, F. (2009). Dealing with
Type II     uncertainty: an analysis of the severe weather events over
            Italy in 2006. Nat. Hazards Earth Syst. Sci, 9, 1775-1786.
d= 8 hrs
Type I                  Type II
       d=19 hrs                 d= 8 hrs

Type I events:               Type II events:
l Long-lived (lasting more   l Brief and localized
  than 12 hours)               (lasting less than 12
l Spatially distributed        hours)
  (more than 50x50 km2)      l Spatially concentrated
                               (less than 50x50 km2)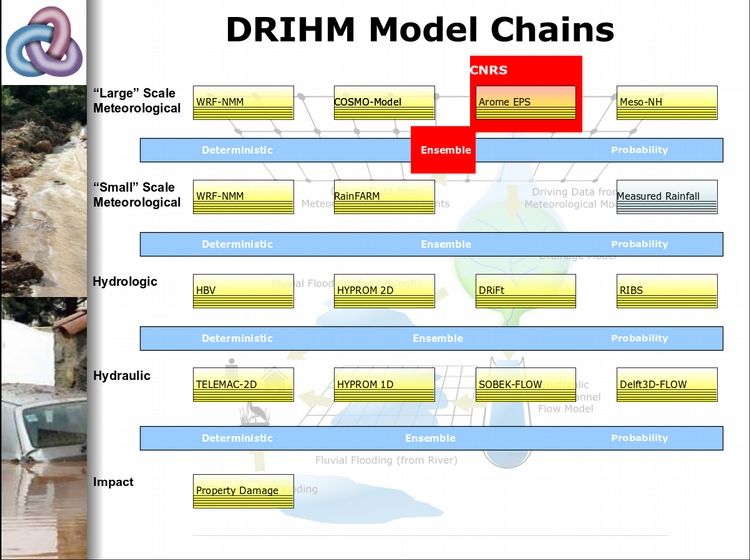
Equilibrium and non-equilibrium
LOW degree of      Non-Equilibrium
 predictability      conditions

                     CAPE (convective
   Triggering
                    available potential
    condition
                    energy) is build up
determines the
                     from large scale
spatio-temporal
                   processes over long
behavior of the
                      timescales and
  corresponding
                   removed by sudden
 severe rainfall
                    triggering of deep
     events
                     moist convection
Equilibrium and non-equilibrium
HIGH degree of            Equilibrium
 predictability           conditions

Large scale forcing
  determines the
statistical properties
                            The rate of
 of convection and
                            creation of
         the
                         CAPE by forcing
 spatio-temporal
                          is balanced by
  behavior of the
                         its consumption
   corresponding
                           by convection
  severe rainfall
       events
A convective time scale for
equilibrium e non-equilibrium
conditions
A convective
adjustment
timescale C
is estimated from the rate at which
instability (measured by CAPE) is
being removed by convective
heating
Molini, L., Parodi, A., Rebora, N., & Craig, G. C. (2011). Classifying severe
rainfall events over Italy by hydrometeorological and dynamical criteria.
Quarterly Journal of the Royal Meteorological Society, 137(654), 148-154.
dCAPE 1 iR Lv g
0.022
0.045 iR
dt 3600 T0 0c pA convective time scale for
equilibrium e non-equilibrium
conditions
CAPE CAPE
C
dCAPE .045 iR
00.022
dt
Equilibrium Non-Equilibrium
conditions conditions
Convective
timescale
CS ~ 6 hoursItalian raingauges network
Type I event
CS= 6 hrs
Type II event
CS= 6 hrsNON Equilibrium
CS= 6 hrs
EquilibriumWhen do these events occur?
1h annual rainfall maxima 24h annual rainfall maxima
Liguria Boni, G., Parodi, A., &
Rudari, R. (2006). Extreme
rainfall events: Learning
from raingauge time series.
Journal of Hydrology,
327(3), 304-314.
Boni, G., Parodi, A., &
Siccardi, F. (2008). A new
Piedmont parsimonious methodology
of mapping the spatial
variability of annual
maximum rainfall in
mountainous
environments. Journal of
Hydrometeorology, 9(3),
492-506.
TrivenetoA Mediterranean paradigmatic
event:
Genoa 2011 flash-floodObserved rainfall depth 9-15 UTC Observed rainfall depth 0-24 UTC
A multiscale severe event: synoptic
A multiscale severe event: mesoscale
Low-level cold and dry
flow
Large-scale frontal system
Low-level warm and
moist flow
Advanced Scatterometer (ASCAT) ocean surface wind vectors data of
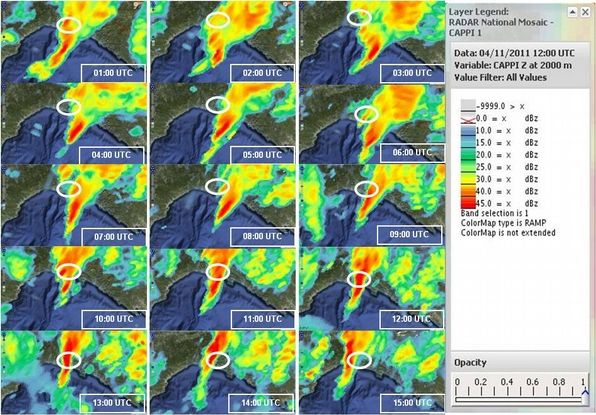
25km resolution, on november 4th 2011, descending pass (10 UTC).A multiscale severe event: mesoscale
Radar maps from the Italian radar network showing the intense
thunderstorm wandering along the Liguria coastline
(1-15UTC): White ellipsoid identifies the mostly affected areaA multiscale severe event: microscale
Rain wrapped Tornado/Waterspout taken from Sant'Ilario
-GE- looking SW on Nov. 4th at 12.30 PM and 12.35 PMAn equilibrium event
Another example in the
   Mediterranean:
   25 october 2011
All together, these events challenge our current
scientific understanding and call for focused and
joint hydro-meteorological and ICT research to:

a)understand, explain and predict the physical
 processes producing such extreme storms;
b)understand the possible intensification of such
 events in the Mediterranean region and their
 physical origin;
c)explore the potential of the increasing
 computational     power     and      Information
 Communication Technology (ICT), such as grid
 computing and petascale computing systems, to
 provide deeper understanding of those events.
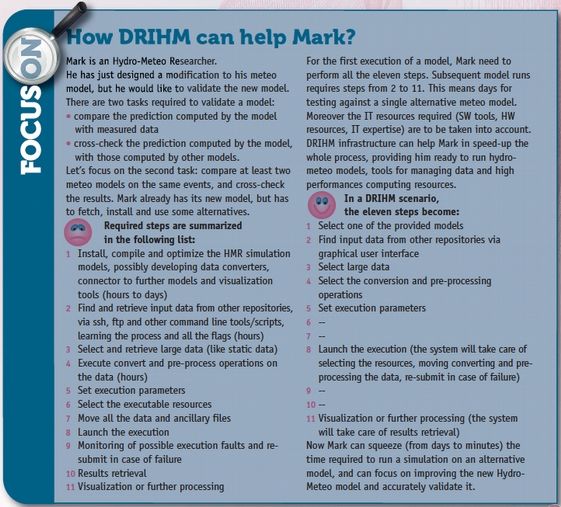
Conceptual showcase
That’s the reason why...
FP7 DRIHMS project

DRIHMS: 2009-2011
Budget: 0.25 Meuro
Project Director:
A. Parodi (CIMA)
The ICT-HMR challenge...

                      RHMSS Baseline Chain
   CIMA Baseline
      Chain

Requirements collection & Limitations today
Why DRIHM? l Forecasting severe storms and floods is a key topic in HMR/early warning l Storms do not respect country boundaries – a pan-European approach to data access and modeling is necessary Satellite cloud liquid water composite (week ending 5/11/2011) clearly shows the cyclone track from USA east coast to Mediterranean.
DRIHM e-Science environment

DRIHM: 2011-2015
Budget: 3.5 Meuro
Project Director:
A. Parodi (CIMA)
3.6.2
Summary of model setups
Meteorological scenarios
More than 30 high-resolution, multi-model scenarios.
3 different ensembles from 2 different ensemble prediction systems.
In the same format (netCDF-CF).
Allowing processing by many free, off-the-shelf post-processing and visualization
softwares (here the NCAR Command Language – NCL, NC-View, CDO, Panoply).
Directly comparable with WaterML 2.0 observations.

                   Bisagno
                  watershed
Comparison of model fields
Full hydrometeorological chains
Summarizing all the information produced by a chain in one plot
Comparison of different rainfalls
                       DRiFt driven by
                          Arome
                         ensemble
                        member #6

     DRiFt driven by
       Meso-NH
       ensemble
     member DRI54
The happy end...
Thinking globally ... DRIHM2US

DRIHM2US: 2012-2014
Budget: 0.5 Meuro
Project Director:
A. Parodi (CIMA)

       Upper panel: satellite cloud liquid water composite (week ending
       5/11/2011) clearly shows the cyclone track from USA east coast to
       Mediterranean. Lower left panel: snowstorm impacts example on USA east
       coast. Lower right panel: Genoa city (Italy) under massive flash-flood
       event.
DRIHM2US interoperability testbeds Main components of our multi-layer design and the interactions between collaborating projects in the US and Europe, in particular as organized under DRIHM2US and its US counterpart, SCIHM (Standards-based CyberInfrastructure for HydroMeteorology). The two projects overlap in their reliance on open community standards developed for high performance resource management and for domain services and catalogs, and on joint use of the data and services infrastructure, as well as parallel institutional development and community engagement.
DRIHM2US interoperability
           testbeds

Schematic showing the suite of multi-physics options
available for experimentation in the SCIHM use cases
    from WRF-Hydro (left) or from DRIHM (right).
And the climate change… SSMI and raingauge observations 1978-1994
DRIHM2US … WRF-Continuum
                             Following the WRF-Hydro scheme and structure

                 Problems:
                 l
                   Continuum is based on a sequential structure;
                 l
                   Continuum I/O are not in a standard format;
                 l
                   Continuum code is not parallelized;
                 l
                   ...
                 l

   F. Silvestro, S. Gabellani, F. Delogu,
           R. Rudari, and G. Boni
Exploiting remote sensing land surface
temperature in distributed hydrological
modelling: the example of the Continuum
model.
 Hydrol. Earth Syst. Sci., 17, 39-62, 2013
DRIHM2US … WRF-Continuum Work planning: 1) Model benchmark 2) Write pre-processing data tools 3) Rewrite Continuum code (drives by Energy Balance) using coupler-driver functions l Initialization l Routing l Finalization 4) Couple Continuum with NOAH-LSM 5) Couple Continuum with WRF 6) Parallelize WRF-Continuum
Thank you for your attention!

        Questions ?
You can also read