DSTAU STATUS REPORT 2021 - CERN DOCUMENT SERVER
←
→
Page content transcription
If your browser does not render page correctly, please read the page content below
DsTau status report 2021
                                                                               The DsTau Collaboration
                                                                                         May 2021

                                                1     Progress since the last one year
                                                The progress in the last one year is devoted to the preparation of the physics run, as well as
                                                the analysis of the pilot run. The bottleneck of the pilot run analysis has been the computing
                                                infrastructure, requiring specific hardware such as a large memory of 256 GB or a GPU. We
                                                have increased the data processing capacity within the collaborating institutes and the speed
                                                drastically increased. The dedicated decay search targeting the small kinks of Ds → τ decays
                                                was developed and is being tested.
                                                    The 2021 run has been schedule in Sep-Oct 2021. All the components of the run are in
                                                preparation. Each of them is reported here.
                                                    As a collaboration, the structure has been more professionally defined. The MoU among
                                                the collaborators and CERN was signed.
CERN-SPSC-2021-020 / SPSC-SR-295

                                                2     Pilot run analysis
                                                2.1    Data processing and data quality
                                                Processing of the 2018 pilot run data is being done smoothly. For the moment, 16 mod-
                                                ules have been fully processed (up to track reconstruction level) and 15 of them have been
                                                uploaded to CERN EOS storage system. In June 2020 a new data processing server with
                                                128 GB of RAM, 30 TB of disk space, and GPU was deployed in Institute of Space Science
                                   01/06/2021

                                                (Magurele, Romania) in addition to the two Nagoya/Kyushu working servers. 5.5 data mod-
                                                ules have been processed on this new machine up to now. In the last months of last year,
                                                computing and storage resources were allocated for our experiment in TRUBA computing
                                                center of Middle East Technical University (Ankara, Turkey). After dedicated environment
                                                setup and preliminary tests, one full DsTau data module has been successfully processed
                                                using the TRUBA resource management system. Also, in March 2021 a new data processing
                                                server with 256 GB of RAM, ∼40 TB of network storage space, and GPU was deployed in
                                                JINR.
                                                    Currently, the processed data occupy approximately 90.5% of the 100 TB space allocated
                                                for our experiment at CERN EOS. For the rest modules of the 2018 run, it is currently enough
                                                storage space in the collaborating institutes (METU, Nagoya/Kyushu, ISS, and JINR). The
                                                EOS storage (∼1 PB) for the physics run is to be set up. We intend to explore the possibility
                                                of reducing the amount of information to be stored for a long time and better estimate the
                                                amount of disk space required for the 2021-22 data.

                                                                                              1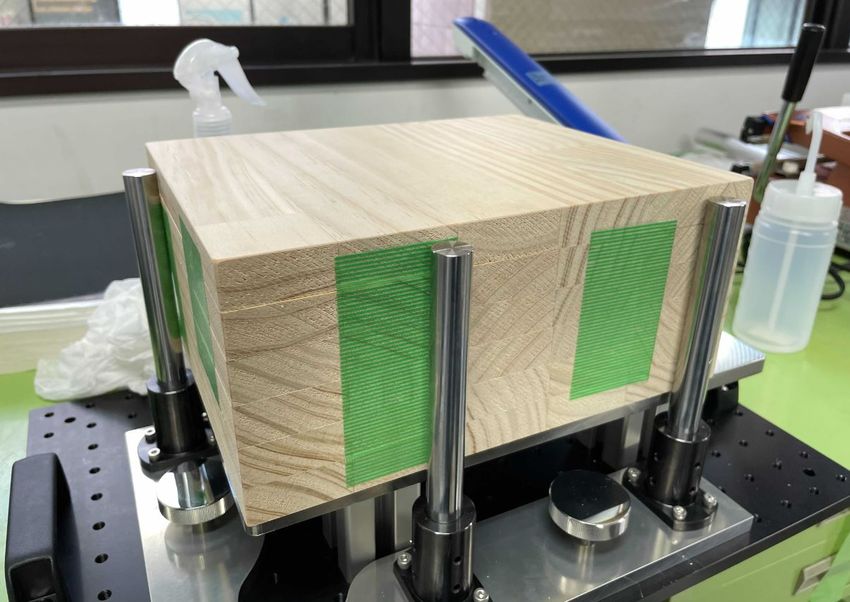
For the purpose of track reconstruction and further data analysis, the whole volume of
each module was divided into many (∼500-570) overlapping sub-volumes with sub-areas of
1.7 × 1.7 cm2 size. In some sub-volumes, reconstructed data quality was not good enough
because of problems with the positional alignment between films. This usually applied to edge
sub-volumes, with the exception of the ones in modules PD24 and PD26. The sub-volumes
with low data quality will be reprocessed with optimized alignment conditions. Information
of the processed modules is given in Table 1.
                                                       #Bad rec.
      Module        Processed in          Size, TB       #All
                                                                   sub-volumes ratio, %
       PD02        Nagoya/Kyushu             ∼6                         7.9
       PD03      Nagoya/Kyushu, ISS          6.6                        8.3
       PD04        Nagoya/Kyushu             8.3                       20.6
       PD05        Nagoya/Kyushu             7.0                       13.8
       PD10             ISS                  4.3                        4.4
       PD11        Nagoya/Kyushu             5.1                        7.1
       PD12        Nagoya/Kyushu             4.8                        6.7
       PD13             ISS                  4.4                       12.2
       PD14             ISS                  4.4                        6.3
       PD16        Nagoya/Kyushu             4.7                       12.9
       PD18        Nagoya/Kyushu             4.9                       19.4
       PD19             ISS                  6.0                        7.2
       PD22            METU                  6.1                       11.6
       PD24        Nagoya/Kyushu             4.6                       65.6
       PD26             ISS                  6.2                       48.0
       PD27        Nagoya/Kyushu             5.4                        9.0

Table 1: Information of the processed DsTau data modules of the 2018 run. The first module
(PD02) data have not been uploaded to CERN EOS yet.

2.2    MC simulations (FLUKA)
Simulation programs based on different packages have been developed and their consistency
has been tested. Since Fluka simulator is available in two versions supported by two teams
(INFN and CERN versions), we made a comparison of their performance. Here are the
results.
    Track multiplicity distributions from primary proton interactions in the whole detector,
including the momentum estimator, are compared (Figure 1). Both generators simulates
interactions of the same number (105 ) of initial protons.
    In Figure 1a for all the daughters produced by primary protons, both simulators give
similar distributions. For comparison, the Kolmogorov test is used, in this case the probability
having a value of 0.1656. Figure 1b presents only the charged daughters produced by primary
protons. Both the distributions show the same behaviour. The Kolmogorov probability is
0.011. Figure 1c is for the neutral daughters. Both the generators model similarly. The
Kolmogorov probability is 0.2326. Figure 1d presents the distributions of heavy particles.
Both distributions have the same shape, where the Kolmogorov probability is 0.053.

                                               2
All daughters - primary interactions mult_all_INFN Charged daughters-primary interactions mult_ch_INFN
0.022
#
#
Entries 7722 0.045 Entries 7722
0.02 Mean 68.65 Mean 26.29
RMS 55.58 0.04 RMS 21.31
0.018
mult_all_CERN mult_ch_CERN
0.016 0.035
Entries 7718 Entries 7718
0.014 Mean 68.5 0.03 Mean 24.85
RMS 53.67 RMS 18.76
0.012 0.025
INFN Fluka INFN Fluka
0.01
FlukaCERN 0.02 FlukaCERN
0.008
0.015
0.006
0.01
0.004
0.002 0.005
0 0
0 20 40 60 80 100 120 140 160 180 200 220 240 0 20 40 60 80 100 120 140 160 180 200 220 240
Multiplicity Multiplicity
(a) All daughters (b) Charged daughters
Neutral daughters - primary interactions mult_0_INFN Heavy daughters - primary interactions mult_H_INFN
#
#
0.035 Entries 7722 Entries 7722
Mean 36.31 0.3 Mean 7.618
0.03 RMS 28.82 RMS 9.968
mult_0_CERN mult_H_CERN
0.25
Entries 7718 Entries 7718
0.025
Mean 36.09 Mean 7.917
RMS 27.62 0.2 RMS 10
0.02
INFN Fluka INFN Fluka
0.15
0.015 FlukaCERN FlukaCERN
0.1
0.01
0.005 0.05
0 0
0 20 40 60 80 100 120 140 160 180 200 220 240 0 20 40 60 80 100 120 140 160 180 200 220 240
Multiplicity Multiplicity
(c) Neutral daughters (d) Heavy daughters
Figure 1: Track multiplicity distributions for primary proton interactions, normalized to the
total number of vertices. Results obtained with the INFN version of Fluka is shown in blue,
and with the CERN version of Fluka in red.
×10
3 All daughters - primary interactions
220 FlukaINFN
#
200
FlukaCERN
180
tan_INFN_Feb21
160 Entries 542204
140 Mean 0.09456
RMS 0.08506
120 tan_CERN_Feb21
100 Entries 531447
Mean 0.0927
80 RMS 0.08492
60
40
20
0
0 0.05 0.1 0.15 0.2 0.25 0.3
tan(θ)
Figure 2: Angular distribution for the daughters from primary proton interactions, the nor-
malization is to the number of vertices
3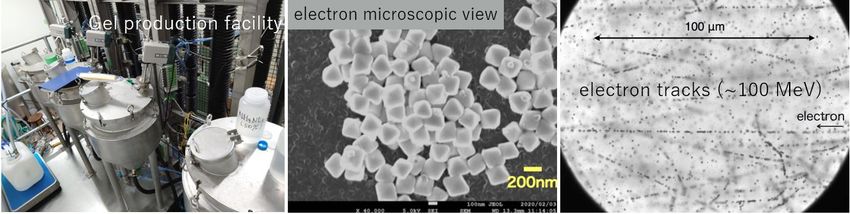
In Figure 2, the angular distributions of all the daughters resulted from primary proton
interactions within the whole detector structure are compared. They are normalized by
the total number of vertices. The CERN version of Fluka generates slightly more forward
particles, but the difference is minor.
    Following these checks, we concluded the CERN/INFN versions are equivalent for our
use.

2.3    MC simulations (Geant4)
Geant4 based simulation of 400 GeV/c proton interactions in the DsTau detector has been
developed. This allows us to compare different physics lists in Geant4 as well as external
models such as Pythia and EPOS by propagating the generated events in Geant4. The output
format is made fully consistent with one used in the Fluka based simulation. Comparison of
the charged track multiplicity in primary proton interactions and their angular distributions
obtained by different simulation tool are shown in Figure 3. Analysis of the reconstructed
data is ongoing.

Figure 3: Distributions of number of charged tracks in primary proton interactions (top) and
distributions of track angles normalised on the number of interactions (bottom). Only events
with 4 or more tracks are taken into account.

    The latest version of Geant4 (10.7) includes charm physics making possible the charm
samples simulation independently for development/update and test of software. The work
on charm sample study is in progress — comparison of charm samples produced by Geant4,
Fluka and PYTHIA are shown in Figure 4 and the distributions of kinematic variables are
in Figure 5. As we can see from the distributions, Geant4 charms production is base on the
model different from the one used in PYTHIA and Fluka, which can be used for estimation
of systematic uncertainties affecting the signal registration efficiency. The work on primary
proton interactions and signal registration study with Geant4 is ongoing.

                                             4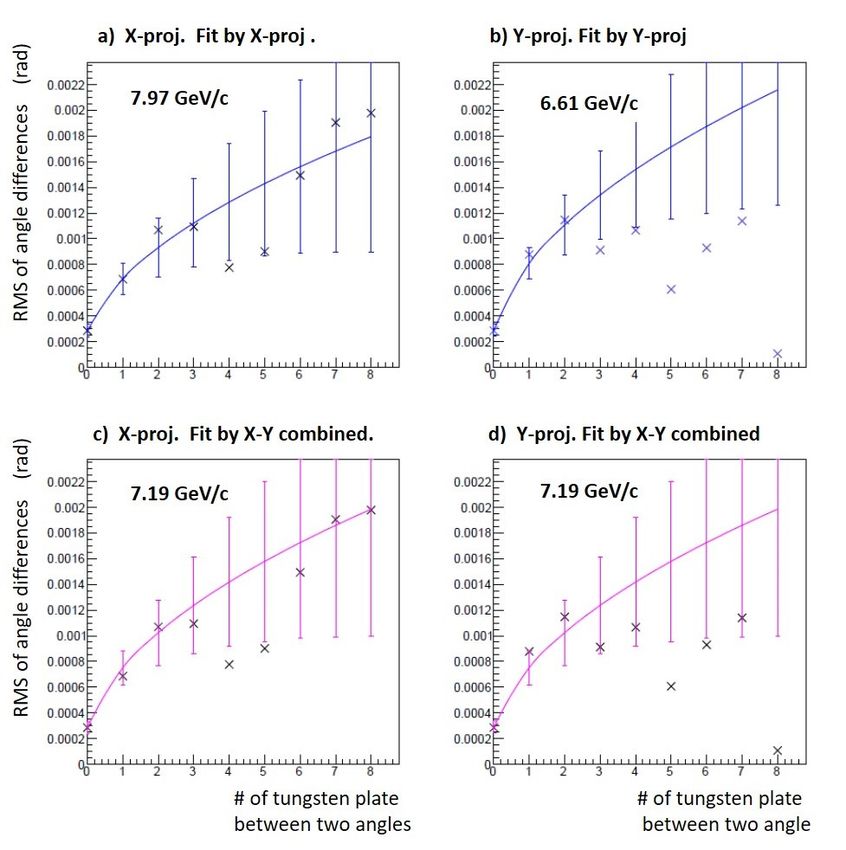
Figure 4: Charm samples produced by different generators in 400 GeV/c proton interactions.

Figure 5: Angular and energy distributions of charms produced by different generators in
400 GeV/c proton interactions.

                                            5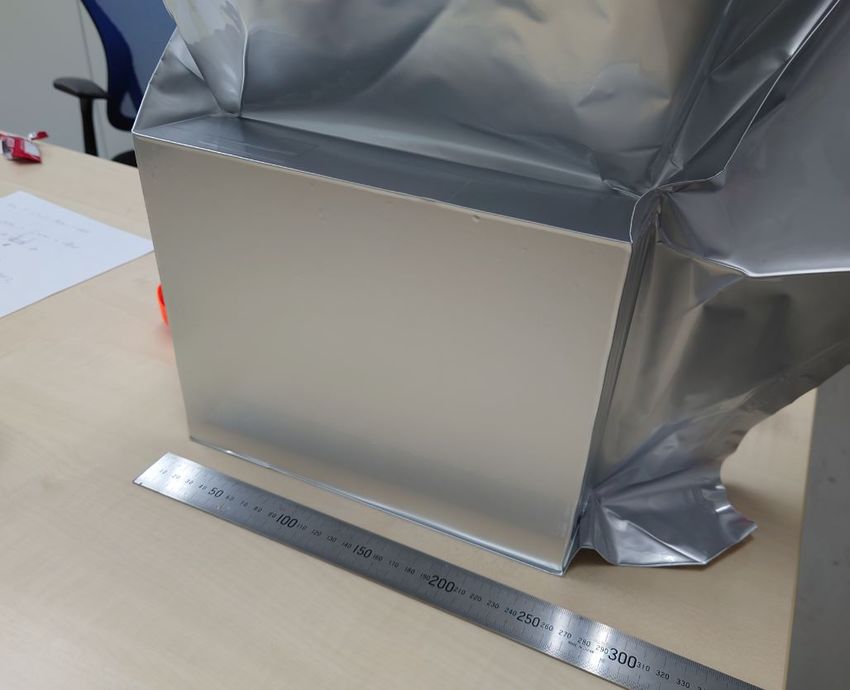
2.4    Search for Ds → τ events in the pilot data
The topology of Ds → τ events appear as a double kink (kink = charged 1-prong topology)
and another charged/neutral topology. The selection criteria for τ → X / charm → X are
described in the previous report.
    The selected events with “two decay topologies” && “one of them with charged decay
topology (kink)” are then checked under the hypothesis of Ds → τ → X decays. Since the
kink angles at Ds → τ decays are expected to be small (average 7 mrad), the Ds and τ
trajectories are likely reconstructed as a single track. Therefore a dedicated algorithm that
searches such small kinks using all the segments in reconstructing tracks was developed. It
checks possible small kink angles at each plate where the parent tracks of the charged decay
topology passed through, calculating track angles before and after the assumed small kink
point. The track angles are calculated using positions after the precise alignment procedure
described in [1]. The angular resolution depends on the available length of the parent and
daughter parts and is shown in Fig. 14 of [1]. For the selection of Ds → τ decays, possible
small kinks with kink angle ≥2 mrad are selected.
    Figure 6 shows one of the example detected by the algorithm. The event has two relatively
large kinks (47 mrad and 56 mrad). When the parents of the kinks are checked, one of
them express a small kink of 2.9 mrad. The tracks before and after the small kink were
originally reconstructed as a single track, but the algorithm successfully identify the kink.
The performance of the algorithm, including the background rate, is being checked.

Figure 6: Demonstration of the small kink detection algorithm. An event with two large
kinks was selected in Data. One of the kink parents has a small kink of 2.9 mrad. In this
display, the extension of tracks segments on individual films are drawn using fitted track
angles.

2.5    Kinematical analysis for charm candidate events
For selected double decays topology events, a consistency with the hypothesis of charm-pair
events are tested by measuring momentum of decay daughters by multiple coulomb scattering
(MCS). For example, neutral 2-prong decay topology, named N2, can be due to two body
decays of Ks0 , Λ0 . They can be identified by Pt valance by two daughters (coplanarity)
and the Pt Jacobian peak value (Ks0 : 206 MeV/c, Λ0 : 101 MeV/c), then it’s possible to
                                             6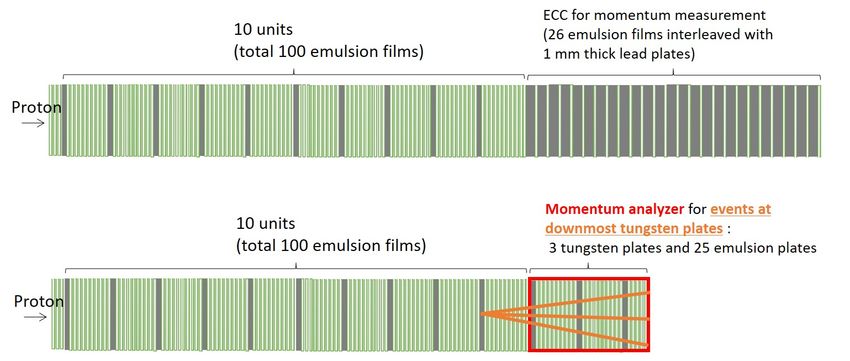
reject from charm candidate sample. In the case of charged decay topology, charged 1-prong
(C1) or 3-prong (C3), decay Pt is larger than the case of hadron interaction with low track
multiplicity.
    We need to measure the scattering at tungsten plates with good angular resolution. The
basetrack angular resolution is limited by the optical and mechanical limitation of the readout
system (∼2 mrad), resulting in the detectable momentum of a few GeV/c. This is insufficient
for our purpose. Instead, we use track positions to define track angles. The plate to plate po-
sition alignment is well below 0.4µm, thanks to high energy beam protons penetrating many
plates. These protons are used as the reference for the position alignment. By connecting
a track positions at a plate and that at 5 plate down stream plate, the angular resolution
reaches ∼0.2 mrad.
    In order to increase statistics of scattering angles measurements, the track should be
reconstructed beyond the standard analysis unit of 30 emulsion films. A module has 10
analysis units in the beam direction, 105 emulsion plate in total, but the data processing
unit is separated into 30 plates by 30 plates overlapping 10 plates. So, a track should
be connected from one reconstruction unit to the next downstream unit until the track
vanished. The maximum number of angle differences between a tungsten plate is 10 − n, n
is the event happened unit number from upstream in each projection. The scattering can
be measured in x,y two projections separately and cross check can be done. A few hundred
tracks at most upstream unit are measured their momentum using maximum 9 times MCS
scattering measurement at a tungsten plate and resulting ∆p/p ∼15-25% up to 30 GeV/c.
The detectable maximum momentum is well covering the expected momentum region of
charm daughters and with a good resolution. For events in downstream unit, we confirmed
the momentum resolution getting worse as 35-45% but maximum detectable momentum is
not changed by using two tungsten plates.
    Implementation of this method in the standard analysis chain is in progress and we will
use the momentum value as a parameter not only for validation but also for event selection.

3     Preparation for 2021 run
3.1    Detector structure
We will employ both tungsten and molybdenum plates as proton interacting targets. This
is because the Beam Dump Facility is planning to use a proton interaction target made
of both of them. The weight density and interaction (radiation) length of molybdenum
and tungsten is different. Molybdenum have 53% weight density and 1.5 (2.7) × longer
interaction (radiation) length with respect to tungsten. In order to make compatible proton
interactions, 1mm molybdenum plates and 0.5mm tungsten plates are used for each target
module respectively. An analysis units is composed of a target plate, 10 emulsion and 9
plastic spacers. A detector module is made as 10 analysis units followed by momentum
analyzer.
    In the pilot run and the experimental proposal, we put a lead-emulsion ECC as mo-
mentum analyzer just after the 10 units of tungsten target and emulsion tracker to perform
kinematical analysis (Figure. 8). However it was found that the track density in the ECC part
quickly increases due to electromagnetic shower components (Figure. 9), which made read-
out by the scanning system difficult (it is possible to scan but we needed a special treatment

                                              7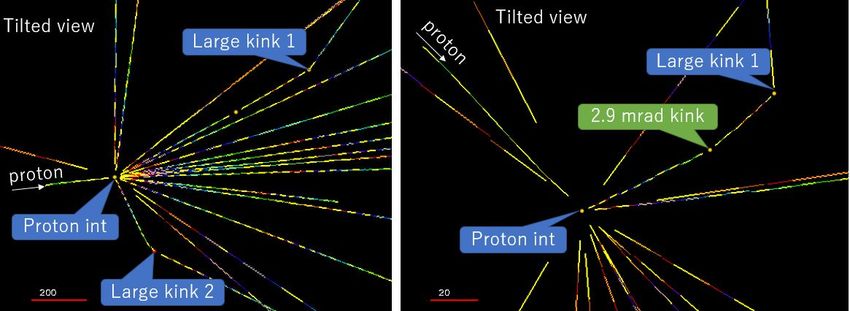
Figure 7: An example of a track’s angle difference vs. number of tungsten plates: root mean
square of angle differences and number of tungsten plates between two angles are plot with
momentum fit line. Left plots a),c) show x-projection, right plots b),d) show y-projection.
Top a),b), momentum fit by each projection. Bottom c),d), momentum fit by X-Y combined
with likelihood method. Looking at the vertical axis at the number of tungsten plate equal
zero represent nearly the angular accuracy and the value ∼ 0.2 to 0.3 mrad. (slightly affected
by MCS at emulsion and plastic plates.)

of these films). While as mentioned previous subsection, the analysis of pilot run show the
momentum measurement by tungsten emulsion tracker units itself have comparable momen-
tum resolution and measurable momentum is even higher. Therefore, we propose a change
of the detector structure as shown in Figure 8 on the bottom. This allows to scan the films
in the momentum analyzer with the standard scanning, but also maintains the momentum
measurement performances. The comparison of the momentum measurement performance is
summarized in Table.2

3.2    Emulsion film production
A large scale emulsion gel production facility has been established in Nagoya University
and operating since 2020. Figure 10 shows an electron microscope photo of the produced
silver bromide crystals. The emulsion sensitivity was obtained by exposing the produced
emulsion to several tens MeV electrons at the UVSOR Synchrotron Facility (Okazaki, Japan),
measuring ∼ 50 grains per 100 micron for minimum ionizing particles (Figure 10-right). This
                                              8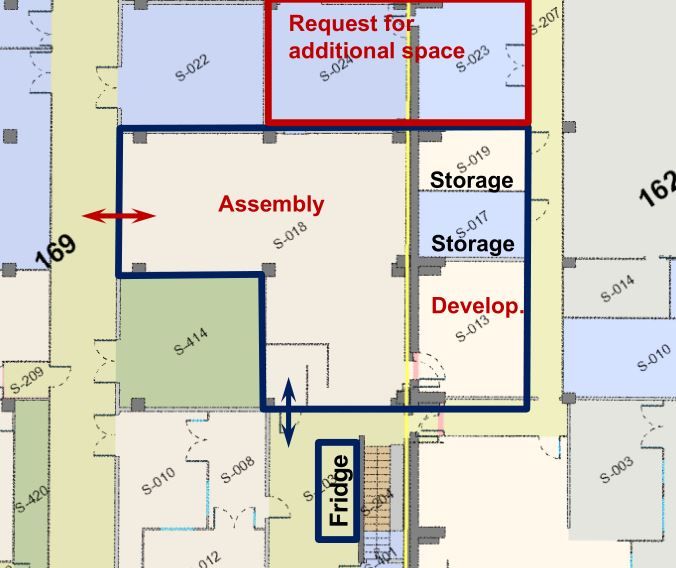
Figure 8: Detector Structure : top) Original detector structure , Lead Emulsion ECC is
followed after 10 tungsten emulsion tracker units. bottom) New design, 3 additional Units is
followed as momentum analyzer for events happened in down stream Units.

Figure 9: The progress of the Track density along beam direction : Geant4 estimation for
progress of track density for different detector structures. One with 12.5 units corresponds
to the newly proposed detector structure. Plate no.1 to 105 is Analysis units and plate 106
to the end is plates for momentum analyzer. W (Mo) represent tungsten (molybdenum)
analysis unit. Top histogram shows all the track, while bottom is limited by angle within 0.1
rad respect to the beam direction.

                                             9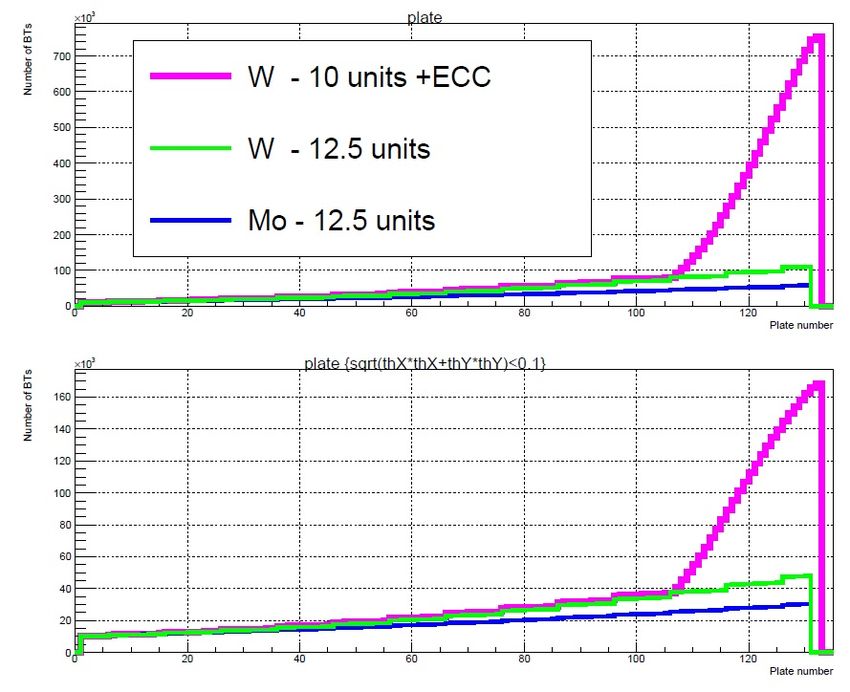
Original: lead emulsion ECC         New: additional tungsten units
  Structure          25 1mm lead, 26 emulsion plates     3 0.5mm tungsten, 25 emulsion
                                                         plates
  Momentum           20 - 40% (upstream ev.)             15 - 40% (upstream ev.)
  resolution         20 - 40% (downstream ev.)           35 - 45% (downstream ev.)
  Weight             15.0 kg                             2.4 kg

Table 2: Comparison of original and new structures of the momentum analyzer. Left: original
lead emulsion ECC. Right: new proposed design, adding two tungsten analysis units to the
main analysis module. The momentum resolution is similar each other.

is sufficient for the detection of minimum ionizing particles in 70 µm of emulsion layer. The
unit amount of the gel production per shift is equivalent to 7 m2 .

Figure 10: Left: Microscopic view of silver bromide crystals. Right: β-ray tracks in the
emulsion layer.

    The produced gel is then to be shaped into films (70 µm emulsion layer deposited on
both sides of 210 µm plastic base). A semi-automated film production facility has also
been set up in Nagoya University (Figure 11-left). The commissioning of the production
in winter 2020 was resulted in a nonuniform emulsion thickness, as shown in Figure 11-
center. However, improvements were applied in the pouring procedure and the quality of
films became satisfactory level, as shown in Figure 11-right.
    Originally, we aimed to add an additional layer of 1 µm gelatin to protect the emulsion
surface from mechanical damages (so-called the protection coat). However, this feature has
not been implemented yet. This will turn into an additional “cleaning” process after film
development (more human work), but will not affect physics performance (the pilot runs
were done without the protection coat).
    The gel/film production has just started since May 17th . Due to the COVID pandemic,
the man power of the production is limited to the Japanese people. Even travels within Japan
by employees of Japanese Universities are partly prohibited or not recommended, therefore
the production largely relies on the people in Nagoya University and Aichi University of
Education. The production speed is currently two batches per week, corresponding to 14
m2 /week. The production is planned during May-June. A total film will be about 100 m2
or 2000 25 cm × 20 cm films. The necessary shifters per week (= a production of 14 m2 of
emulsion films) was estimated from the first weeks of mass production and shown in Table 3.
The currently, 20 shifters are needed to produce 14 m2 . This value would decrease by time
                                              10
by improving efficiency of each task (but not less than 14 shifters).
Figure 11: Left: Film production facility. Center: An early produced film with stripe patterns
on the emulsion surface. Right: Improved film quality. Ready for mass production.
Task # shifters per week Approx # of shifts
Preparation of additives 2 shifters × 2 hours 1
Gel production 2 shifters × 8.5 hours × 2 days 4
Gel finalization 2 shifters × 8 hours 4
Plastic-base pre-coating 2 shifters × 6 hours 2
Coating 3 shifters × 8 hours × 2 days 6
Cutting 3 shifters × 7 hours 3
Sum shifts per week (=14 m2 ) 20 shifts / week
Table 3: Required shifters, from the experiences of the first weeks of mass production.
3.3 Emulsion facility at CERN
The CERN emulsion facility in B. 169 has historically been used by several experiments since
1980s, such as CHORUS, OPERA, AEgIS, medical applications and test beams, as well as
DsTau and SHiP. Demands for this facility are increasing due to three approved experiments,
namely NA65/DsTau, FASERν and SND. DsTau will run in 2021 and 2022. FASERν and
SND will run in 2022-2024. The time sharing among three experiments is a big challenge.
The three experiments made a common request to the LHCC and SPSC to refurbish
the emulsion facility, which was then supported by the LHCC. The main requests are an
additional space for emulsion processing, and infrastructures, such as access control, air
conditioning, chemical storage and disposal etc. The plan of actions is advanced thanks to the
CERN local staffs, Richard Jacobsson and Jamie Boyd. The modifications (implementation
of card key access and breaking a part of walls between rooms) will be performed mostly in
this year, avoiding the DsTau’s physics run period.
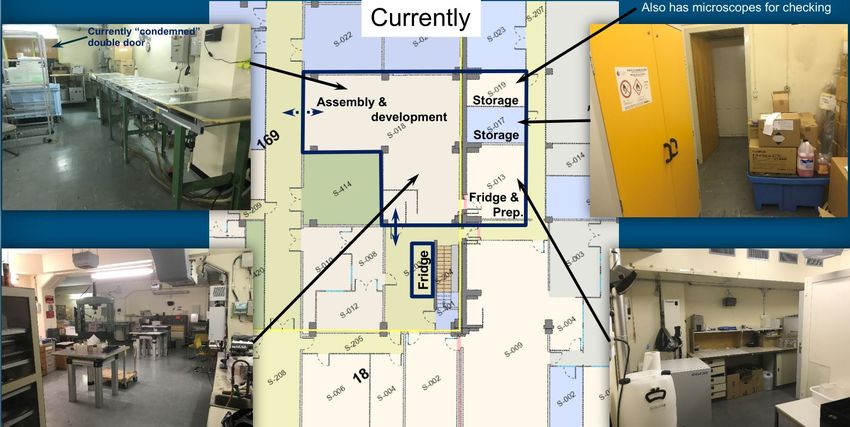
3.4 Detector assembling
The emulsion films, target plates and plastic films will be assembled in the dark room. The
number of components exceeds 250 pieces. In order to align them with a decent precision,
an assembling support was built with three alignment pins (Figure 13-left). The assembled
11Figure 12: Emulsion facility, current (left) and requested (right).
module will then be vacuum packed to fix the alignment by the atmospheric pressure, as
shown in Figure 13-right. (The final alignment will be done by using the 400 GeV proton
track data with a sub-micro-metric resolution.)
Figure 13: Assembling support with a dummy module (left) and a vacuum packed dummy
module.
3.5 Target mover
Due to the change of emulsion film size, the target mover used in the pilot run cannot be used
in the physics run. A target mover used in the J-PARC E07 experiment (Figure 14-left) was
provided by the E07 collaboration to the DsTau collaboration, which is being adapted for
DsTau. Basic operation tests of the mover were successfully done. The proton beam counter
and dedicated control for the DsTau’s data taking is being finalized. The target mover will
be shipped to CERN from Japan in mid June (50 days expected), well in advance to the
physics run starting from 22nd Sep.
3.6 Beam time estimation and operation plan
As shown in Figure 15, the beam time has been scheduled in Week 38 - 40, namely from Sep
22nd to Oct 6th , at the H2 beamline. A tentative schedule of the exposure campaign is given
in Table 4.
12Figure 14: Target mover (left) and control schematics (right)
Figure 15: Beam schedule
week dates people actions
W35 Aug 30 - Sep 5 3 Bern/Chiba group to setup the dark room facility
W36 Sep 6 - 12 3 Setup dark room facility, commissioning of target mover
W37 Sep 13 - 19 6 Arrival of DsTau shifters, start assembling detector
W38 Sep 20 - 26 8 Start of beam time, beam tuning, exposure
W39 Sep 27 - Oct 3 8 Exposure
W40 Oct 4 - 10 8 Exposure , start development
W41 Oct 11 - 17 3 Development
W42 Oct 18 - 24 3 Development
W43 Oct 25 - Nov 6 3 Development
Table 4: Tentative schedule
134 Collaboration
4.1 Management structure
Although DsTau is a small collaboration, it has all the attributes of a CERN experiment.
During the last year, the Memorandum of Understanding between CERN and participating
institutions has been prepared and signed by all the sides. Also all collaboration bodies:
Institutional Board, Executive Committee, Speakers and Publication Committee were estab-
lished and act as intended. The web site devoted to the DsTau experiment - na65.web.cern.ch
had been created. It provides the general information on the experiment, news, plans etc.
Also it has the internal part were useful technical documentation is being stored.
4.2 Conferences
The status and prospect of the experiment have been reported in conferences. Although the
most of 2020 conferences were cancelled or performed online due to the covid-19 pandemic,
the DsTau collaboration have been represented in five important conferences like ICHEP,
NEUTRINO and DIS.
References
[1] Shigeki Aoki et al. DsTau: Study of tau neutrino production with 400 GeV protons from
the CERN-SPS. JHEP, 01:033, 2020.
14You can also read