Dual aerial 1080 baiting operation removes predators at a large spatial scale
←
→
Page content transcription
If your browser does not render page correctly, please read the page content below
Nichols
New Zealand
        et al.: Journal
                Predatorofremoval
                           Ecologyat(2021)
                                     large scale
                                           45(1): 3428 © 2021 New Zealand Ecological Society.                                        1

                  RESEARCH

Dual aerial 1080 baiting operation removes predators at a large spatial scale

Margaret Nichols1*, Helen Nathan1                   and Nick Mulgan1
1
 Zero Invasive Predators Ltd, C/O Zealandia Sanctuary PO Box 9267 Marion Square. Wellington, NZ 6141.
*Author for correspondence (Email: maggie@zip.org.nz)

Published online: 1 December 2020

          Abstract: As New Zealand attempts to become predator free by 2050, transitioning aerial 1080 (sodium
          fluoroacetate) operations from predator control to complete predator removal has become an important research
          objective. Aerial 1080 operations may not remove every last target animal, but they may be able to remove a
          very high proportion (> 0.99). We trialled a modified [dual] aerial 1080 operation for the removal of brushtail
          possums (Trichosurus vulpecula), ship rats (Rattus rattus), and stoats (Mustela erminea) at large spatial scale.
          Our trial involved two toxin applications (TA#1 & TA#2), each preceded by two applications of non-toxic
          pre-feed bait. Different types of cereal baits and lures were used for each toxin application. Camera traps
          (n = 142; 200–1431 m asl) were used to detect the target species and to incidentally observe house mouse (Mus
          musculus), birds, and ungulates across the study area. The operation had no significant impact on the number
          of cameras detecting most birds and ungulate species; however, house mouse, blackbird (Turdus merula), and
          red deer (Cervus elaphus) were detected on significantly fewer cameras after TA#1 than before. Numbers of
          cameras that detected target species were significantly reduced for all three target species after TA#1, and
          significantly reduced again for possums after TA#2, when no stoats were detected on cameras and a small
          number of cameras detected rats. Mean relative abundance estimates based on camera trap indices (proportion
          of camera trap days that target species were detected) showed the operation appears to have removed over 99%
          of ship rats, stoats, and possums.
          Keywords: Wildlife management, sodium fluoroacetate (1080), camera traps, invasive species

Introduction                                                           operations for reasons such as plentiful natural food (Elliott
                                                                       & Kemp 2016), not encountering a toxic bait, or not eating
New Zealand is a hotspot for endemic biodiversity (Myers et al.        bait quickly enough to ingest a lethal dose before the onset of
2000), and many native vertebrate species are vulnerable to            sublethal toxicosis (Graham Nugent et al. 2019). As the focus
predation from invasive mammals (Byrom et al. 2016; Elliott &          shifts towards local elimination and eventual eradication of
Kemp 2016). In 2016, the New Zealand government announced              ship rats, possums, and stoats rather than ongoing suppression
a goal to be predator free by 2050. Since then, there has been an      (Russell et al. 2015), modified aerial baiting techniques
increased focus on the complete removal of brushtail possums           have been trialled. These have involved increased sowing
(Trichosurus vulpecula), ship rats, Norway rats, and pacific           rates, multiple pre-feeds, and multiple toxin applications of
rats / kiore (Rattus rattus, R. norvegicus, and R. exulans), and       differently-lured baits in a single season (Bell 2017; Nugent
mustelids (Mustela furo, M. nivalis, M. erminea) throughout            et al. 2019). Pre-feed applications significantly reduce the
New Zealand (Russell et al. 2015a).                                    incidence of bait shyness in possums (Ross et al. 2000). Dual
     Aerial baiting with sodium fluoroacetate (1080) is used           toxin applications implemented a few months apart have shown
over parts of New Zealand’s forested landscape for suppressing         potential for the local elimination of ship rats ( Nugent et al.
populations of possums and ship rats (Eason et al. 2011;               2019). Compound 1080 is an acute toxin, meaning the onset
Kemp et al. 2019; Nugent et al. 2019) for the benefit of               of toxic symptoms is rapid and any sub-lethal dose is likely
native biodiversity, and for reducing the incidence of bovine          to result in aversion (Ross et al. 2000; Morgan et al. 2002;
tuberculosis (TB) in possums that may infect cattle (Warburton         Nugent et al. 2019). There may always be survivors of predator
& Livingstone 2015). These operations also remove stoats               removal operations, despite multiple pre-feeds and high sowing
through secondary poisoning (Dilks et al. 2020; Murphy                 rates of toxic bait used in these modified operations (Graham
et al. 1999).                                                          Nugent et al. 2019). However, switching lures and cereal bait
     Modern large-scale aerial 1080 operations for predator            types can reduce bait shyness in captive possums (Moss et al.
suppression typically consist of one non-toxic pre-feed                1998; O’Connor & Matthews 1999).
application followed by one toxic application (Dilks et al.                 This study evaluates a highly modified aerial 1080
2020). However, some possums and rats survive aerial 1080              operation consisting of two toxin applications (with higher

DOI: https://dx.doi.org/10.20417/nzjecol.45.14
2 New Zealand Journal of Ecology, Vol. 45, No. 1, 2021
sowing rates than is now usual) in a single season, each with minimise interaction by birds (Moss et al. 1998; Weser & Ross
two non-toxic pre-feeds, for the removal of possums, ship 2013). Pre-feed baits were also dyed green as part of ongoing
rats, and stoats at large scale. This contrasts with the usual kea (Nestor notabilis) risk mitigation work (Nichols et al. 2020;
approach in modern aerial 1080 baiting in which a single Nichols & Bell 2019). Deer repellent was not included in baits
sowing of 1080 bait is preceded by a single prefeed. We used as the risk of attracting kea was assumed to be high, and any
camera traps primarily, as well as chew cards (Sweetapple & changes to the baits would interfere with bait aversion training
Nugent 2011) to estimate relative abundance of target species of kea (Nichols & Bell 2019). In toxin application 1 (TA#1),
before and after the operation. We recorded incidental camera the total area treated was 8659 ha and up to an elevation of
trap footage of non-target species (house mice Mus musculus, 1800 m asl, to ensure all vegetated areas (predator habitat) were
birds, and ungulates) across the site, and compared numbers treated. In toxin application 2 (TA#2), the total area treated
of cameras with detections for each species before and after was 6130 ha, and up to an elevation of 1200 m asl (above the
each toxin application. treeline to ensure rats were exposed, but below the high alpine
in accordance with the detection history of predators at the
site, Table 2). Permission was granted by the Medical Officer
Methods of Health (Community and Public Health, a division of the
Canterbury District Health Board), and DOC, to aerially sow
Study area bait to the river edge and around public huts, thus removing
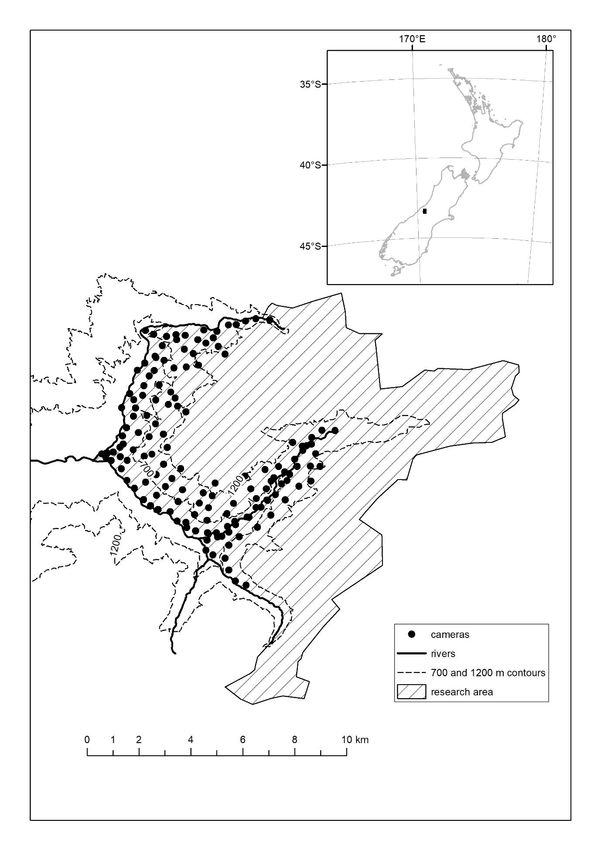
The Perth River Valley study area (43.2616° S, 170.3590° E) any exclusion zones from the treatment area. Hut rainwater
spans approximately 10 000 ha in the wider Whataroa valley collection was disconnected, and roofs cleared of bait before
in South Westland, New Zealand. The Whataroa and Perth reconnection, as part of the conditions of this permission.
valleys have been subject to cyclical aerial 1080 operations All bait was aerially distributed by underslung buckets
for possum control since 1997, with the most recent in 2015 flown by GPS-guided helicopters. All baits (pre-feed and toxic)
(Stephens & Grunner, unpubl. report). The Perth Valley has been in TA#1 were Wanganui #7 (W#7) double orange-lured 6 g
identified as a priority site in the Department of Conservation’s cereal pellets (Table 1). Pre-feed baits were sown with a 10%
(DOC) ecosystems prioritisation programme (Brown & Urlich sowing overlap for both pre-feed applications making 2 kg
2005). A primary reason we selected this study area was its ha−1 on the ground (all bait quantities that follow are ground
natural barriers to slow target species reinvasion. The study coverage). Toxic baits containing 0.15% 1080 were sown at 4
area lies between two substantial rivers: the Perth River and the kg ha−1, with a 50% sowing overlap (Table 1). All baits (pre-
Barlow River. These rivers join to form its western boundary, feed and toxic) in TA#2 were RS5 double cinnamon-lured 6
with the Bettison Stream at the southern boundary. The main g cereal pellets (Table 1). In TA#2, pre-feed baits were sown
divide of the Southern Alps forms the northern and eastern at 1 kg ha−1, with a 10% sowing overlap for both pre-feed
boundary, with the highest point at 2543 m above sea level. applications, and toxic baits containing 0.15% 1080 were
Vegetation in the study area consists mostly of indigenous sown at 2 kg ha−1, with a 50% sowing overlap (Table 1). The
forest, including southern rātā (Metrosideros umbellata), reduction in bait quantity for TA#2 and its pre-feeds was in
rimu (Dacrydium cupressinum), and kāmahi (Weinmannia recognition that, with many fewer predators present, home
racemosa) from 200 m to 1100 m asl. Below the treeline ranges may increase (Margetts et al. 2020). Caching of baits
are makomako (Aristotelia serrata), kōtukutuku (Fuchsia by predators during prefeed would be undesirable if it meant
excorticata), horoeka (Pseudopanax crassifolius), Hall’s that toxic baits were not consumed. One kg ha−1 was near the
tōtara (Podocarpus hallii), māhoe (Melicytus ramiflorus), lower limit of effective bucket operation.
patē (Schefflera digitata), and haumakaroa (Raukaua simplex) Several other changes were made from a standard
(Stephens & Grunner 2016). Above the treeline, vegetation is suppression operation to maximise the chances of exposing
primarily snow tussock (wī kura; Chionochloa spp.) grassland all animals to toxic bait, adapting methods used in offshore
and herb fields up to approximately 1800 m asl. Above this island eradication and previous experience (Bell et al. 2019).
elevation are glaciers and bare rock. Helicopter contractors were paid by time rather than area or
In 2019, forests and alpine grasslands experienced a heavy bait volume. A conservative view was taken of the nominal
mast, a periodic event defined by synchronous heavy seed bucket broadcasting swathe width, which resulted in a reduction
production (Norton & Kelly 1988). This ecological condition from 200 m to 180 m for several buckets. Swathe separation
was confirmed by reports of unusually high levels of fruit was thus 162 m for 10% overlap and 90 m for 50% overlap.
and seed fall throughout forests in New Zealand (Department Pilots were requested to keep speed as constant as possible
of Conservation 2019). In South Westland, rimu and snow and required to re-sow any lines with a speed greater than
tussock were expected to mast in autumn 2019, consistent 10% of average. Drift of bait in the air was a consideration in
with previous mast seeding events (Rees et al. 2002; Harper planning. The relative isolation of the study area meant that
2005). Sampling of rimu in the study area confirmed that it was no bait exclusion zones were required, allowing bait spread
masting in 2019. The aerial operation in the current study was outside the target boundary and guaranteeing spread up to the
intended for 2018 (a non-mast year), but heavy and prolonged edges of the block.
snow fall forced postponement to 2019. The area was divided into blocks of 500–2000 ha and the
swathe direction specified for each block to approximately
Treatment follow terrain contours, so that pilots would stay as close as
possible to the minimum effective distance above the terrain
Toxin applications were separated by 3.5 months. Each or canopy. A target windspeed of 5 km h−1 sustained (10 km
toxin application was preceded by two non-toxic pre-feed hr−1 gust) was used in planning, but in practice most days that
applications. All cereal bait was manufactured by Orillion had suitable forecasts, for 48 hours without rain following,
(Wanganui, New Zealand). Toxic baits were dyed green, had low wind on the day. The schedule of blocks and sow
in accordance with regulations to protect field workers and lines through the day was rearranged to take advantage of lowNichols et al.: Predator removal at large scale 3
Table 1. Timeline and overview of each toxin application and detection network deployment in the Perth River Valley, South
Westland, in 2019. All cereal bait was aerially deployed. Camera trap surveys were continuous throughout the operation.
Asterisks indicate the first date chew cards were deployed, as not all could be deployed on the same day.
__________________________________________________________________________________________________________________________________________________________________
Operation and detection Dates (2019) Deployment specifications Notes
__________________________________________________________________________________________________________________________________________________________________
Camera traps Pre operation; n = 142; Camera traps were serviced
22 February—12 April 700 m × 500 m spacing continuously throughout 2019.
__________________________________________________________________________________________________________________________________________________________________
Toxin application 1: Wanganui #7, double orange-lured
__________________________________________________________________________________________________________________________________________________________________
Pre-feed 1 19 March 6 g pellets
2 kg ha−1
Pre-feed 2 3 April 6 g pellets
2 kg ha−1
1080 baiting 13–14 April 6 g pellets
4 kg ha−1
Possum collared (n = 1) 23 May GPS collar Adult female within the treatment area.
Captured, collared, and released 39 days
after toxin application 1
__________________________________________________________________________________________________________________________________________________________________
Chew cards *7 June n = 3000; Deployed 7.5 weeks before toxin
700 × 20 m spacing application 2
__________________________________________________________________________________________________________________________________________________________________
Toxin application 2: RS5, double cinnamon-lured
__________________________________________________________________________________________________________________________________________________________________
Pre-feed 1 18 June 6 g pellets
1 kg ha−1
Pre-feed 2 24 June 6 g pellets
1 kg ha−1
1080 baiting 22–23 July 6 g pellets
2 kg ha−1
__________________________________________________________________________________________________________________________________________________________________
Post-toxin application 2 detection
__________________________________________________________________________________________________________________________________________________________________
Chew cards 24 July—9 September Both detection networks ran continuously
Camera traps through October 30. Analysis completed
through first 7 weeks after TA#2
__________________________________________________________________________________________________________________________________________________________________
Table 2. Percentage of camera traps that detected the target species at different altitudes in the study area pre-toxin application
#1. Perth River Valley, February–April 2019.
__________________________________________________________________________________________________________________________________________________________________
Camera Altitude (m asl) Number of Cameras Ship Rat (%) Possum (%) Stoat (%)
__________________________________________________________________________________________________________________________________________________________________
200–400 15 100 100 46
400–600 35 94 100 43
600–800 29 86 100 62
800–1000 30 53 96 50
1000–1200 25 36 96 32
1200–1431 8 0 100 13
__________________________________________________________________________________________________________________________________________________________________
Total camera network 142 69 99 45
__________________________________________________________________________________________________________________________________________________________________
wind speed where possible. Bait remaining at the end of each Camera traps
operation was sown (1) along any narrow valleys perpendicular Relative abundance calculated from camera trap detections is
to swathe direction, (2) on steep slopes with vegetation, and often used to assess the results of predator control operations
(3) on the low-altitude podocarp forest considered the most (Bengsen 2014; Dilks et al. 2020; Glen et al. 2014; Glen &
favourable habitat for target species. Animal ethics committee Peace 2020; Nugent et al. 2019). As such, cameras were not
approval (Lincoln University AEC-2016-28) was obtained to expected to record every individual of each target species.
live-capture (cage trap) and attach GPS collars (Sirtrack Ltd; However, we aimed to distribute cameras across all potential
model: LiteTrack 30) to any surviving possums detected at target species’ habitats. We used a network of 142 camera
any point post-aerial toxin deployment. traps (Browning Dark Ops 6HD-940, Prometheus Group,4 New Zealand Journal of Ecology, Vol. 45, No. 1, 2021
Birmingham, Alabama) with 500-m spacing between devices Camera surveys were conducted for seven weeks before
on cut tracks, at elevations ranging from 200−1431 m asl (Fig. 1; and after TA#1 and for 7 weeks before and after TA#2 (Table
Table 1). Cameras were deployed on all accessible main tracks 1). Importantly, the risk of confounded results from possible
(continuous along inside perimeter of study area) and interior reinvasion by dispersing animals (particularly stoats and
tracks (these intersect with main tracks and extend inwards possums), and breeding rats was expected to increase after the
towards the core of the study area) spaced approximately 500 m seven weeks of surveys following TA#2 (Byrom et al. 2015;
apart (Fig. 1). King & McMillan 1982).
All cameras were mounted on trees (or steel fence posts
as required above the treeline) with the base of each camera Chew cards
45 ± 10 cm from the ground. Cameras were set to take a For detection of rats and possums, we attempted to increase
series of three photos per trigger, with a delay of 5 seconds spatial coverage by adding chew cards (Sweetapple & Nugent
(the minimum possible time delay) between triggers. Cameras 2011) (n = 3000) at approximately 20-m spacing on all
were lured with Best Food’s™ egg mayonnaise dispensed accessible main tracks and interior lines. Chew cards, which
from automated lure dispensers, known as MotoLures (ZIP are rectangles of corrugated plastic (Corflute) (Waters et al.,
2019a), at a rate of 0.25 ml three times per day. MotoLures 2017), were lured with Pic’s™ peanut butter and deployed
were mounted on trees (or steel fence posts as required above in addition to the camera traps. Chew cards were deployed
the treeline) 1.5 m directly in front of the camera’s field of before and after TA#2 only (Table 1), and were replaced every
view to increase the chance of small mammals being detected 21 days on average.
(Glen et al. 2013).
Figure 1. The Perth River Valley camera
trap network in 2019. Cameras were
spaced approximately 500 m apart, at
200–1431 m asl.Nichols et al.: Predator removal at large scale 5
Analysis for this study as sample sizes of detections were very small
We used camera traps to estimate an index of relative abundance after each toxin application.
for each of the three target species (Rovero & Marshall 2009).
Detections for each target and non-target species monitored
were recorded as ‘1’ or ‘0’ per 24-hr period, taken from noon Results
to noon for nocturnal species such as rats and possums, and
midnight to midnight for stoats, birds, and ungulates. Camera traps
The proportion of camera-trap days with a detection p All three target species were seen on camera traps pre-operation
was amalgamated by week for the seven weeks before and (Table 2). Possums and stoats were detected on cameras up
after each toxin application. to 1431 m asl, while no rats were detected on cameras above
The proportion p was further averaged across each seven- 1160 m asl. Of the total camera network available during
week period before and after each toxin application to produce pre-operation surveys, rats were seen on 69% of cameras,
a single value before p0, and a single value after each toxin possums on 99% of cameras, and stoats on 45% of cameras.
application p1. We calculated a linear index of animal density The non-target species recorded on cameras were house
λ, by a Poisson transformation (Hone 1988): mice, birds, and ungulates. Bird species included song thrush
(Turdus philomelos), blackbird, South Island tomtit (ngirungiru,
λ =-ln(1-p) (1) Petroica macrocephala), New Zealand fantail (pīwakawaka,
Rhipidura fuliginosa), bellbird (korimako, Anthornis
Two-tailed Fisher’s exact tests of the odds ratio (Sokal & melanura), silvereye (tauhou, Zosterops lateralis), and South
Rohlf 1981): Island robin (kakaruwai, Petroica australis). Ungulates
recorded on cameras included Himalayan tahr (Hemitragus
θ = p1(1-p0)/(p0 (1-p1)) (2) jemlahicus), chamois (Rupicapra rupicapra), and red deer.
were used to test whether there was a difference in the number Target species
of cameras detecting a species before and after each toxin The proportion of camera trap days that detected species before
application. Results with P < 0.05 were deemed statistically and after each toxin application can be found in Figs 2a, b, and
significant. We used this test for both target and non-target c. Mean relative abundance, shown as the proportion p further
species. Occupancy modelling was not deemed appropriate averaged across seven-week periods to produce a single value
1.00 1.00
0.90 0.90
Proportion of camera trap days
Proportion of camera trap days
0.80 0.80
0.70 0.70
0.60 0.60
0.50 0.50
0.40 Possum 0.40 Rat
0.30 0.30
0.20 0.20
0.10 0.10
0.00 0.00
-21-19-17-15-13-11 -9 -7 -5 -3 -1 1 3 5 7 -21 -19 -17 -15 -13 -11 -9 -7 -5 -3 -1 1 3 5 7
Weeks Weeks
a) b)
1.00
0.90
Proportion of camera trap days
0.80
0.70
0.60 Figure 2. Proportion of camera trap days with target species
0.50 detections by week for a) possums, b) rats and c) stoats, pre-toxin
0.40 Stoat application #1 (22 February–13 April), post-toxin application #1
0.30 (15 April–22 July), pre-toxin application #2 (15 April–2 June),
and post-toxin application #2 (24 July–11 September). Weeks
0.20
are shown relative to the date of toxin application #2. Red dotted
0.10 lines denote toxin application #1 (week 14) and toxin application
0.00 #2 (week 0) in the Perth River Valley in 2019.
-21 -19 -17 -15 -13 -11 -9 -7 -5 -3 -1 1 3 5 7
Weeks
c)6 New Zealand Journal of Ecology, Vol. 45, No. 1, 2021
before each toxin application, p0, and a single value after each cameras regularly for the next three weeks. Its GPS-collar was
toxin application, p1, and the linear index of animal density detected in mortality mode seven days after TA#2.
λ (± SE) can be found in Table 3. TA#1 reduced detections
(based on the linear index λ) of possums and rats each by 99%, Chew cards
and 98% for stoats. TA#2 reduced detections of possums by a Prior to TA#2, possums were detected on four chew cards,
further 93%, and rats by 99%. No stoats were detected after and rats on 18. After TA#2, neither possums nor rats were
the first week post-TA#1. detected on chew cards. Chew cards were not lured for stoat
Possums, rats, and stoats all showed a significant reduction detection, and no stoat chew-marks were found.
in the number of cameras with detections after TA#1 (Fisher’s
exact test, P < 0.01, Table 4). Cameras detecting possums were Non-target species
significantly reduced again after TA#2 (P < 0.01), and again, Camera detections of mice decreased to zero in the first week
no stoats were detected before or after TA#2. The number of following TA#1, and remained so for the following seven weeks
cameras detecting rats did not differ significantly before and (Table 4). Mice were detected again pre-TA#2, and although
after TA#2 (P = 0.06); however, sample sizes for this test camera detections of mice decreased to zero in the first week
were small (n = 9 cameras before TA#2, and n = 2 cameras following TA#2, they were detected again two weeks later.
after TA#2). Blackbirds were detected on significantly fewer cameras post
One possum that presumably survived TA#1, an adult TA#1, while the number of cameras that detected silvereye
female, was live-captured and fitted with a GPS collar 39 increased dramatically after TA#1 (Table 4). Silvereye showed
days after the TA#1 (Table 1). This individual was recorded interest in the chew cards and the egg mayonnaise lure at camera
on two camera traps on the same line (500 m apart), nine days trap sites. The ungulate species tahr and chamois showed little
after capture. It then visited each of these cameras on at least change in camera detections throughout the operation, but red
two of the next three days. This individual was then not seen deer were detected on significantly fewer cameras following
again for nearly a month, before appearing on the same two TA#1 than before (Table 4).
Table 3. Proportion p of camera trap days with target species detections, and corresponding linear index of animal density
(λ ± SE, based on a Poisson transformation of p), averaged for the seven weeks before and after each toxin application in
the Perth River Valley in 2019.
__________________________________________________________________________________________________________________________________________________________________
Proportion of camera trap days Animal density index
__________________________________________________________________________________________________________________________________________________________________
Species Before TA#1 After TA#1 Before TA#2 After TA#2 Before TA#1 After TA#1 Before toxin After toxin
(p0) (p1) (p0) (p1) (λ0) (λ1) 2 (λ0) 2 (λ1)
__________________________________________________________________________________________________________________________________________________________________
Possum 0.64 0.004 0.008 0.001 1.03 ± 0.07 0.004 ± 0.001 0.008 ± 0.002 0.001 ± 0.001
Rat 0.34 0.004 0.009 0.000 0.42 ± 0.02 0.004 ± 0.001 0.009 ± 0.002 0.000 ± 0.00
Stoat 0.064 0.001 0.000 0.000 0.07 ± 0.005 0.001 ± 0.00 0 0
____________________________________________________________________________________________________________________
Table 4. Number of cameras that detected each species (target and non-target), pre- toxin application #1, post-toxin application
#1, pre-toxin application #2, and post-toxin application #2 in the Perth River Valley in 2019. Two-tailed Fisher’s exact test
P-values show the results of statistical comparison of detections of each species before and after each toxin application.
Asterisks denote significant values.
__________________________________________________________________________________________________________________________________________________________________
Species Pre TA#1 Post TA#1 Fisher exact Pre TA#2 Post TA#2 Fisher exact
test P-value test P-value
__________________________________________________________________________________________________________________________________________________________________
Possum 140 8 < 0.01* 17 4 < 0.01*
Rat 98 4 < 0.01* 9 2 0.06
Stoat 64 9 < 0.01* 0 0 NA
Mouse 22 0 < 0.01* 3 3 1
Song thrush 17 9 0.2 10 10 1
Blackbird 49 15 < 0.01* 16 16 1
South Island tomtit (Ngirungiru) 38 26 0.1 27 21 0.4
Fantail (Pīwakawaka) 7 5 0.7 4 6 0.8
Bellbird (Korimako) 4 5 1 2 6 0.3
Silvereye (Tauhou) 2 4 0.7 81 90 0.3
South Island robin (Kakaruwai) 14 9 0.4 7 3 0.3
Tahr 16 25 0.2 12 17 0.4
Chamois 40 47 0.4 23 19 0.6
Red deer 24 5 < 0.01* 0 1 1
__________________________________________________________________________________________________________________________________________________________________Nichols et al.: Predator removal at large scale 7
Discussion was that having chew cards available to survivors a few weeks
before TA#2 would overcome any potential neophobia (Burge
This study provides the first large-scale demonstration that et al. 2017; Nugent et al. 2019). Surviving animals would have
dual application of 1080 bait during a 3.5-month period been much more familiar with the MotoLures, however, most
can reduce possum and rat numbers to near zero levels. The of which were available continuously for nine months prior
operation reduced our index of relative abundance by over to the operation (ZIP 2018).
99% for possums, rats and stoats. The number of cameras Field staff members reported unusually high levels of fruit
that detected possums was significantly reduced further after and seed fall throughout the forest, with rimu in particular
the second toxin application (TA#2) compared with the first (Norton & Kelly 1988), and snow tussock at higher elevations
(TA#1), and stoats were no longer detected. These reductions in autumn 2019, consistent with a mast seeding event (Harper
from very low levels after TA#1 to even lower levels after TA#2 2005; Rees et al. 2002). Where abundant natural food resources
are consistent with the prediction by Nugent et al. (2019) that are available, the relative attractiveness of cereal bait pellets
rats surviving a first 1080 baiting could be killed by a second may be reduced (Elliott & Kemp 2016; Keitt et al. 2015).
baiting (following a second pre-feeding). Importantly, the For this reason, the length of time between TA#1 and TA#2
further reduction in possum abundance indicates that repeat was extended to 14 weeks (from an initially planned 4–6
application of a second cereal bait type (RS5 vs W#7) can be weeks), in an attempt to avoid the period of highest natural
effective for that species, which was not observed by Nugent food availability. Despite the delay, there seeds and fruit were
et al. (2019). abundant throughout the study area, which may have reduced
It is likely that most, if not all, of the animals detected after the efficacy of the operation, particularly for rats. However, the
TA#2 were resident survivors. Small-scale field trials suggest additional time between toxin applications allowed changes
that rivers may be an obstacle at least to immediate reinvasion to be made to the size of the treatment area in TA#2, based
by most possums and rats, particularly in non-dispersal periods on camera detections. With few camera detections of target
(Cook et al. 2021; ZIP 2019b). In contrast, rats detected on species after TA#1, and no detections above 1200 m, the
cameras after the dual 1080 field trial in Nugent et al. (2019) treatment area was reduced.
were found at the edges of the treatment blocks (no natural The toxin applications reduced incidental camera
barriers), on a similar timeline (4–6 weeks), and assumed to detections of some non-target species. Mouse detections were
be re-invaders. Distinguishing survivors and re-invaders after significantly reduced after TA#1, but not after TA#2. There was
a removal operation is not possible with un-marked individuals no significant reduction in numbers of cameras that detected
and without genetic material for comparison (King et al. 2011; most bird and ungulate species after either toxin application.
Russell et al. 2010). Throughout this study, we assumed few However, the number of cameras that detected blackbirds
animals resided above the tussock-line (> 1600 m asl at the and red deer was significantly reduced after TA#1, but not
Perth Valley site). We are most certain of this limit for ship TA#2 (with very small sample sizes for statistical tests after
rats (Christie et al. 2009; Christie et al. 2017; O’Donnell et al. TA#2). Blackbirds are be affected by aerial 1080 operations
2017); however, possums and stoats may be present at high (Morriss et al. 2016; Van Vianen et al. 2018), as are red deer
elevations (Cowan 2005; King & Murphy 2005). with variable results (Malham et al. 2019; Nugent & Fraser
The degree to which rivers, mountain passes, and other 2005; Graham Nugent et al. 2019). We could not use deer
natural features are barriers to movement of all three species repellent in conjunction with kea risk mitigation strategies,
requires further research. Stoats can swim across fast- and although historical impacts of 1080 operations on deer
flowing rivers (Murphy & Dowding 1994), but we detected have been highly variable, impacts can increase with higher
no reinvasion by stoats during the post-operation survey rates of sowing (Morriss et al. 2020).
period. Future research around the use of natural barriers may Although non-target species were seen on fewer cameras
become increasingly important as projects aiming to achieve than target species, occupancy (site-use) does not equal
predator-free sites seek to maintain them following complete abundance (Russell et al. 2015b). Low numbers of camera
predator removal. detections during the surveys and a lack of non-treatment sites
Chew cards in this study consistently detected fewer rats for comparison, make it difficult to draw conclusions about
and possums than camera traps. As chew cards were deployed the abundance of non-target species (Veltman & Westbrooke
on the same tracks as cameras, there was always a chew card 2011). In future operations, calibrating camera trap detections
within a camera’s field of view. Both possums and rats were to monitoring methods such as faecal counts for ungulates
occasionally seen to ignore these chew cards in favour of the (Forsyth et al. 2007) and five-minute bird counts (Greene
MotoLures dispensing egg mayonnaise. One hypothesis is that et al. 2013), would be useful to better interpret results from
the egg mayonnaise was simply more attractive than the peanut incidental camera data.
butter. Another hypothesis, based on the findings of Nugent Overall, the modified 1080 operation appears to have
et al. (2019), suggests MotoLures dispensing egg mayonnaise removed a high proportion of possums and rats (and possibly
were simply more familiar to the surviving individuals than the all stoats) from the Perth River Valley study area. Modern
chew cards with peanut butter. Although Nugent et al. (2019) aerial 1080 operations often have high kill rates (Dilks et al.
also reported relatively low detections of rats by peanut butter 2020; Elliott & Kemp 2016). However, as operations move
chew cards, they were surprised by the upsurge in detections from focussing on suppression to local elimination and
of possums when chew cards were refreshed. The deployment eradication, modifications for complete removal such as using
of chew cards differed in Nugent et al. (2019) as they were two toxin applications may become more common (Bell 2017;
available to animals pre-operation. In contrast, chew cards in Nugent et al. 2019). The full operation (including research and
the current study were not deployed until prior to TA#2, because development costs and goods-and-services tax) was $155 ha−1.
the number of chew cards required for 20-m spacing on all We expect this cost to drop to $133 ha−1 once the research
tracks across the site (n = 3000) made this device too labour- and development costs are removed. Although the operation
intensive for use in pre-operational monitoring. Our assumption did not remove every resident individual possum and rat, the8 New Zealand Journal of Ecology, Vol. 45, No. 1, 2021
reduction in camera trap detections was very high, suggesting Conservation. 36 p.
that few animals remained and hence their removal using Burge OR, Kelly D, Wilmshurst JM 2017. Interspecies
other methods might be feasible. Within each toxin operation interference and monitoring duration affect detection rates
and associated pre-feeds it is not possible to assess which of in chew cards. Austral Ecology 42(5): 522–532.
the modifications to a typical suppression operation (i.e. 2 kg Byrom AE, Anderson DP, Coleman M, Thomson C, Cross ML,
ha−1 rather than 1 kg ha−1 for TA#1, 50% block overlaps, care Pech RP 2015. Assessing movements of brushtail possums
taken over constant speed, minimisation of altitude), had the (Trichosurus vulpecula) in relation to depopulated buffer
most success, without performing manipulative experiments. zones for the management of wildlife tuberculosis in New
However, our results suggest that transitioning from predator Zealand. PloS One 10(12): 1–14.
control operations to complete removal using modified baiting Byrom AE, Innes J, Binny RN 2016. A review of biodiversity
techniques coupled with targeted mop-up of survivors, is a outcomes from possum-focused pest control in New
feasible initial step towards elimination and then eradication Zealand. Wildlife Research 43(3): 228–253.
of predators in forested locations on mainland New Zealand Christie JE, Brown DJ, Westbrooke I, Murphy EC 2009.
(Bell et al. 2019; Murphy et al. 2019). Environmental predictors of stoat (Mustela erminea) and
Large-scale, mainland eradication of multiple predators ship rat (Rattus rattus) capture success. DOC Research
requires a suite of tools and techniques, including both & Development Series 305. Wellington, Department of
ground-based and aerial methods. Refinements to aerial 1080 Conservation. 28 p.
operations, as well as optimal deployment methods for detection Christie JE, Wilson PR, Taylor RH, Elliott G 2017. How
devices, are necessary. In addition, further research into elevation affects ship rat (Rattus rattus) capture patterns,
technologies and strategies for effective mop up of survivors, Mt Misery, New Zealand. New Zealand Journal of Ecology
particularly those that may be averse to cereal baits (Nugent 41(1): 113–119.
et al. 2020), is ongoing and necessary for the overall goal of Department of Conservation 2019. Mega mast confirmed
New Zealand becoming predator free by 2050. for New Zealand forests. Wellington, Department of
Conservation, 8 April 2019, Media release.
Cook B, Nathan H, Mulgan N 2021. Rivers as obstacles to
Author contributions home range expansion in the brushtail possum. New
Zealand Journal of Ecology 45(1).
MN, HN, and NM designed the study. MN and NM analysed Cowan PE 2005. Brushtail possum. In: King CM ed. The
the results. MN, HN, and NM wrote the manuscript. handbook of New Zealand mammals. 2nd edn. Melbourne,
Oxford University Press Pp. 56–80.
Dilks P, Sjoberg T, Murphy EC 2020. Effectiveness of aerial
Acknowledgements 1080 for control of mammal pests in the Blue Mountains,
New Zealand. New Zealand Journal of Ecology 44(13):
We thank the field team members (Courtney Hamblin, Chad 1–7.
Cottle, Matt Chisnall, Piper Douglas, Nate StHill, Chelsea Eason C, Miller A, Ogilvie S, Fairweather A 2011. An updated
Price, Alex Edwards, and Michael Tunnicliff) for deploying review of the toxicology and ecotoxicology of sodium
and maintaining all devices. We also thank the helicopter fluoroacetate (1080) in relation to its use as a pest control
pilots of Fox Franz HeliServices, in particular Ken Hutchins, tool in New Zealand. New Zealand Journal of Ecology
for safely transporting the field team around site, and all the 35(1): 1–20.
pilots and crew from Anderson Helicopters, Heliservices and Elliott G, Kemp J 2016. Large‐scale pest control in New Zealand
Amuri Helicopters for their expertise. Thanks to Nicholas beech forests. Ecological Management & Restoration
Braaksma and Gary Eason for GIS support, and Terry Farrell, 17(3): 200–209.
Veronica Frank and Ann de Schuter for discussions about GIS Forsyth DM, Barker RJ, Morriss G, Scroggie MP 2007.
and helicopter monitoring. Thank you to Elaine Murphy, Al Modeling the relationship between fecal pellet indices
Bramley, James Russell, Phil Bell, Deb Wilson, Al Glen and and deer density. The Journal of Wildlife Management
Graham Nugent for technical advice and comments on previous 71(3): 964–970.
drafts of this manuscript. Glen AS, Peace J 2020. Predator free Taranaki: Changes in
predator abundance after stage 1 of trapping on the Ring
Plain. Contract Report: LC3733. Manaaki Whenua-
Landcare Research. 14 p.
References Glen AS, Cockburn S, Nichols M, Ekanayake J, Warburton
B 2013. Optimising camera traps for monitoring small
Bell P 2017. 1080 to Zero: Jackson-Arawhata. Technical report
mammals. PloS One 8(6): e67940.
#1. Wellington, Zero Invasive Predators. 11 p.
Glen AS, Warburton B, Cruz J, Coleman M 2014. Comparison
Bell P, Nathan H, Mulgan N 2019. Island eradication within
of camera traps and kill traps for detecting mammalian
large landscapes: the remove and protect model. In:
predators: a field trial. New Zealand Journal of Zoology
Veitch CR, Clout MN, Martin AR, Russell JC, West CJ
41(3): 155–160.
eds. Island Invasives: Scaling up to Meet the Challenge.
Greene TC, Dilks PJ, Westbrooke IM, Pryde MA 2013.
Gland, Switzerland. Pp. 604– 610.
Monitoring selected forest bird species through aerial
Bengsen A 2014. Effects of coordinated poison-baiting
application of 1080 baits, Waitutu, New Zealand. New
programs on survival and abundance in two red fox
Zealand Journal of Ecology 37(1): 41–50.
populations. Wildlife Research 41(3): 194–202.
Harper GA 2005. Heavy rimu (Dacrydium cupressinum) mast
Brown K, Urlich SC 2005. Aerial 1080 operations to maximise
seeding and rat (Rattus spp.) population eruptions on
biodiversity protection. Wellington, Department of
Stewart Island/Rakiura. New Zealand Journal of ZoologyNichols et al.: Predator removal at large scale 9
32(3): 155–162. Wellington. 21 p.
Hone JM 1988. Feral pig rooting in a mountain forest and Nichols M, Bell P, Mulgan N, Taylor A 2020. Conditioned
woodland: distribution, abundance and relationships aversion in kea to cereal bait: A captive study using
with environmental variables. Australian Journal of anthraquinone. Applied Animal Behaviour Science 230:
Ecology13(4): 393–400. 105077.
Keitt B, Griffiths R, Boudjelas S, Broome K, Cranwell S, Norton DA, Kelly D 1988. Mast seeding over 33 years by
Millett J, Pitt W, Samaniego-Herrera A 2015. Best practice Dacrydium cupressinum Lamb.(rimu)(Podocarpaceae)
guidelines for rat eradication on tropical islands. Biological in New Zealand: the importance of economies of scale.
Conservation 185:17–26. Functional Ecology 2(3): 399–408.
Kemp JR, Mosen CC, Elliott GP, Hunter CM, van Klink P 2019. Nugent G, Fraser KW 2005. Red deer. In: King CM ed. The
Kea survival during aerial poisoning for rat and possum handbook of New Zealand mammals. 2nd edn. Melbourne,
control. New Zealand Journal of Ecology 43(1): 1–11. Oxford University Press. Pp. 401–420.
King CM, McMillan CD 1982. Population structure and Nugent G, Morriss GA, Warburton B 2019. Attempting local
dispersal of peak-year cohorts of stoats (Mustela erminea) elimination of possums (and rats) using dual aerial 1080
in two New Zealand forests, with especial reference to baiting. New Zealand Journal of Ecology 43(2): 3373.
control. New Zealand Journal of Ecology 5: 59–66. Nugent G, Clayton R, Warburton B, Day T 2020. Dual 1080
King CM, Murphy EC 2005. Stoat. In: King CM ed. The bait switching for killing cereal-bait-shy possums. New
handbook of New Zealand mammals. 2nd edn. Melbourne, Zealand Journal of Ecology 44(1): 1–6.
Oxford University Press. Pp. 261–287. O’Connor CE, Matthews LR 1999. 1080-induced bait aversions
King CM, Innes JG, Gleeson D, Fitzgerald N, Winstanley T, in wild possums: influence of bait characteristics and
O’Brien B, Bridgman L, Cox N 2011. Reinvasion by ship prevalence. Wildlife Research 26(3): 375–381.
rats (Rattus rattus) of forest fragments after eradication. O’Donnell CFJ, Weston KA, Monks JM 2017. Impacts of
Biological Invasions 13(10): 2391. introduced mammalian predators on New Zealand’s alpine
Malham J, Elliott GP, Walker S 2019. No evidence of negative fauna. New Zealand Journal of Ecology 41(1): 1–22.
effects of aerial 1080 operations on red deer (Cervus Rees M, Kelly D, Bjørnstad ON 2002. Snow tussocks, chaos,
elaphus) encounters and sightings in South Westland and the evolution of mast seeding. The American Naturalist
forests. New Zealand Journal of Ecology 43(2): 1–2. 160(1): 44–59.
Margetts BI, Ross JG, Buckley HL 2020. Measuring home‐ Ross JG, Hickling GJ, Morgan DR, Eason CT 2000. The role
range changes following density reduction of Australian of non-toxic prefeed and postfeed in the development and
brushtail possum. The Journal of Wildlife Management maintenance of 1080 shyness in captive brushtail possums.
84(1): 185–192. Wildlife Research 27: 69–74.
Morgan DR, Milne L, O’Connor C 2002. Learned bait- Rovero F, Marshall AR 2009. Camera trapping photographic
shyness by possums (Trichosurus vulpecula) towards baits rate as an index of density in forest ungulates. Journal of
containing cyanide, 1080, cholecalciferol, or brodifacoum. Applied Ecology 46(5): 1011–1017.
Proceedings of the Vertebrate Pest Conference 20(20): Russell JC, McMorland AJC, MacKay JWB 2010. Exploratory
282–289. behaviour of colonizing rats in novel environments. Animal
Morriss GA, Nugent G, Whitford J 2016. Dead birds found Behaviour 79(1):159–164.
after aerial poisoning operations targeting small mammal Russell JC, Innes JG, Brown PH, Byrom AE 2015a. Predator-
pests in New Zealand 2003–14. New Zealand Journal of free New Zealand: conservation country. BioScience
Ecology 40(3): 361–370. 65(5): 520–525.
Morriss GA, Parkes JP, Nugent G 2020. Effects of aerial 1080 Russell JC, Stjernman M, Lindström Å, Smith HG 2015b.
operations on deer populations in New Zealand. New Community occupancy before‐after‐control‐impact (CO‐
Zealand Journal of Ecology 44(2): 3417. BACI) analysis of Hurricane Gudrun on Swedish forest
Moss ZN, O’Connor CE, Hickling GJ 1998. Implications birds. Ecological Applications 25(3): 685–694.
of prefeeding for the development of bait aversions in Sokal R, Rohlf F 1981. Biometry. New York, WH Freeman
brushtail possums (Trichosurus vulpecula). Wildlife and Company. 859 p.
Research 25(2): 133–138. Sweetapple P, Nugent G 2011. Chew-track-cards: a multiple-
Murphy EC, Dowding JE 1994. Range and diet of stoats species small mammal detection device. New Zealand
(Mustela erminea) in a New Zealand beech forest. New Journal of Ecology 35(2): 153.
Zealand Journal of Ecology 18(1): 11–18. Van Vianen J, Burge OR, MacFarlane AT, Kelly D 2018. The
Murphy EC, Robbins L, Young JB, Dowding JE 1999. effects of single aerial 1080 possum-control operations on
Secondary poisoning of stoats after an aerial 1080 poison common forest birds in the South Island, New Zealand.
operation in Pureora Forest, New Zealand. New Zealand New Zealand Journal of Ecology 42(2):169–178.
Journal of Ecology 23(2): 175–182. Veltman CJ, Westbrooke, IM 2011. Forest bird mortality and
Murphy EC, Russell JC, Broome KG, Ryan GJ, Dowding JE baiting practices in New Zealand aerial 1080 operations
2019. Conserving New Zealand’s native fauna: a review from 1986 to 2009. New Zealand Journal of Ecology
of tools being developed for the Predator Free 2050 35(1): 21–29.
programme. Journal of Ornithology 160: 1–10. Warburton B, Livingstone P 2015. Managing and eradicating
Myers N, Mittermeier RA, Mittermeier CG, Da Fonseca wildlife tuberculosis in New Zealand. New Zealand
GAB, Kent J 2000. Biodiversity hotspots for conservation Veterinary Journal 63: 77–88.
priorities. Nature 403(6772): 853–858. Waters J, Fraser D, Adams NJ, Blackie H, MacKay J 2017.
Nichols M, Bell P 2019. Tahr carcasses as a preferred food Increasing possum interaction rates with chew cards using
source over cereal bait for kea (Nestor notabilis). Technical new formulation lures. New Zealand Journal of Zoology
report #9. Wellington, Zero Invasive Predators Ltd. 44(2): 91–98.10 New Zealand Journal of Ecology, Vol. 45, No. 1, 2021
Weser C, Ross JG 2013. The effect of colour on bait
consumption of kea (Nestor notabilis): implications for
deterring birds from toxic baits. New Zealand Journal of
Zoology 40(2): 137–144.
ZIP 2018. Using trail cameras paired with automated lure
dispensers to detect stoats when they are at low density.
Short report. Wellington, Zero Invasive Predators Ltd.
Wellington. https://zip.org.nz/findings/2020/8/using-
lured-trail-cameras-to-detect-predators-at-low-density.
ZIP 2019a. The many applications of the ZIP MotoLure. Short
report. Zero Invasive Predators Ltd. Wellington. http://
zip.org.nz/findings/2019/12/the-many-applications-of-
the-zip-motolure.
ZIP 2019b. Assessing the Perth River (and Scone Creek) as a
barrier to rats. Short report. Zero Invasive Predators Ltd.
Wellington. http://zip.org.nz/findings/2019/2/assessing-
the-perth-river-and-scone-creek-as-a-barrier-to-rats.
Received: 19 June 2020; accepted: 15 October 2020
Editorial board member: Deb WilsonYou can also read