EARTH RESOURCES SECTOR INDICATORS 2019-2020
←
→
Page content transcription
If your browser does not render page correctly, please read the page content below
EARTH
RESOURCES
SECTOR
INDICATORS
2019–2020
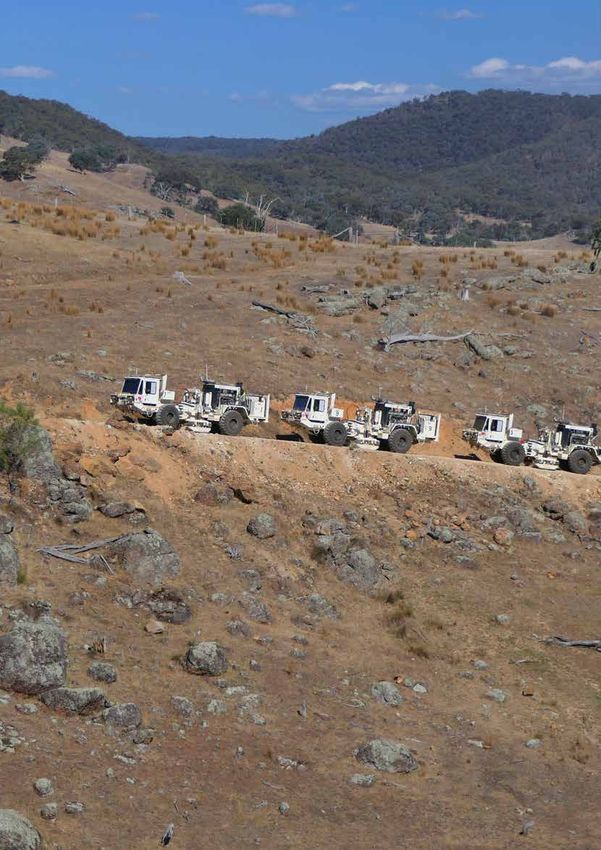
EARTH RESOURCES SECTOR INDICATORS 2019–2020   2

Published by
Department of Jobs, Precincts and Regions
1 Spring Street Melbourne, Victoria 3000
Telephone +61 (03) 9651 9999
June 2021
© Copyright State Government of Victoria 2019
This publication is copyright. No part may be
reproduced by any process except in accordance
with provisions of the Copyright Act 1968.
Authorised by the Victorian Government, Melbourne.
Designed by DJPR Design Studio
ISSN 2652-1490 – Online (pdf/MS word)
Disclaimer
The information contained in this report is provided
for general guidance and assistance only and is not
intended as advice. You should make your own
inquiries as to the appropriateness and suitability
of the information provided. While every effort has
been made to ensure the currency, accuracy
or completeness of the content we endeavour to keep
the content relevant and up to date and reserve the
right to make changes as required. The Victorian
Government, authors and presenters do not accept
any liability to any person for the information(or the
use of the information) which is provided or referred
to in the report.
Except for any logos, emblems, trademarks, artwork
and photography this document is made available
under the terms of the Creative Commons
Attribution3.0 Australia licence.

Accessibility
This document is available in PDF
at earthresources.vic.gov.au
Page 6 image courtesy of Kirkland Lake Gold’s
Fosterville Gold Mine
EARTH RESOURCES SECTOR INDICATORS 2019–2020 3
EARTH RESOURCES SECTOR INDICATORS 2019–2020 4
EARTH RESOURCES SECTOR INDICATORS 2019–2020           5

MINISTER’S FOREWORD

In the midst of a global pandemic, Victoria           The sector remains resilient and my government
has record quarry production and minerals             will continue to support the resources sector for
exploration expenditure growth. In the                the benefit of all Victorians.
financial year 2019-20, Victoria also had the         Year-on-year, gold production is up almost
highest gold production in over 100 years.            40 per cent. Minerals exploration expenditure, a
                                                      measure of industry confidence and a precursor
Our resources sector remains strong and the
                                                      to future mining investment, remains at a record
outlook is overwhelmingly positive.
                                                      high, increasing 33 per cent from 2018-19.
This government’s policies and programs are
                                                      In response to the number of minerals licence
delivering results, with record-high infrastructure
                                                      applications received, the government has
investment stimulating demand for raw materials
                                                      provided additional funds to ensure approvals
from our quarrying sector.
                                                      processing can continue at pace, while ensuring
An expanding resources sector is a crucial part       adequate safeguards are in place. This will
of the government’s approach to delivering            help keep the momentum going and ensure
investment opportunities and well-paid local          works can be ramped up to assist the state’s
jobs in regional Victoria.                            economic recovery.

To be able to tell the story of the important role    I’m proud that the Victorian Government continues
the sector plays it is vital that we have access      to invest in programs across the resources
to the latest, most reliable data.                    portfolio and would like to thank everyone across
                                                      the resources sector for a year of hard work during
The 2019-20 Earth Resources Sector Indicators         a difficult period.
report, produced by the Department of Jobs,
Precincts and Regions, highlights several             I look forward to highlighting the important
positive trends.                                      work that is being delivered in future editions
                                                      of this report.
Quarry production has grown by 25 per cent
over the last six years, and provided over
63 million tonnes of sand, rock and gravel last
financial year to help deliver new housing and
infrastructure development.

The impact of the coronavirus pandemic can            Jaclyn Symes MP
be seen towards the end of the 2019-20 financial      Minister for Resources
year and recovery will remain a challenge.
EARTH RESOURCES SECTOR INDICATORS 2019–2020 6
EARTH RESOURCES SECTOR INDICATORS 2019–2020   7

INTRODUCTION
Each year, the Earth Resources Sector Indicators
report is produced to promote a shared
understanding of the sector and enable effective
earth resource decision-making.

This report includes mineral and extractive resources
information for the 2019-20 financial year and builds
on foundations laid by previous Earth Resources
Sector Indicators reports.

Earth Resources Sector Indicators is intended to:
•   establish a framework for collection and analysis
    of key information for the sector;

•   provide a common and easily accessible set
    of metrics for stakeholder reference;

•   complement existing earth resources reporting
    requirements; and

•   highlight opportunities to develop additional
    sector indicators for future reports.
EARTH RESOURCES SECTOR INDICATORS 2019–2020                8

VICTORIAN GOVERNMENT POLICY
Gas
The government is committed to ensuring                           •   To encourage further offshore gas exploration
long-term, affordable gas supplies are                                and development, government released five
available to Victorian homes and businesses.                          offshore acreage areas in the Otway Basin
                                                                      for tender in 2018, and released data from an
•   In 2020, the Victorian Gas Program’s three-year
                                                                      airborne gravity survey of a large portion of the
    suite of scientific studies concluded in relation
                                                                      basin. In July 2020, the Minister for Resources
    to the potential for new discoveries of onshore
                                                                      announced that two exploration permits from this
    conventional gas and the risks, benefits and
                                                                      tender process were granted to Beach Energy
    impacts of developing the resource. The studies
                                                                      and Bridgeport Energy. Should initial exploration
    found that an onshore conventional gas industry
                                                                      be successful, up to $85 million could flow into the
    would not compromise the state’s environmental
                                                                      economy, contributing to further investment in
    and agriculture credentials. The VGP’s modelling
                                                                      South-West Victoria and new jobs.
    estimated that there could be 128-830 petajoules
    of onshore conventional gas in the Otway and                  •   All new gas from offshore waters under
    Gippsland basins.                                                 Victorian jurisdiction and onshore conventional
                                                                      gas development will be prioritised for domestic
•   In June 2020, the Parliament passed the
                                                                      use, further strengthening Victoria’s energy
    Petroleum Legislation Amendment Act 2020
                                                                      security and supporting local industry and
    to allow for an orderly restart of onshore
                                                                      consumers. Natural gas will continue to play
    conventional gas exploration and production
                                                                      an important role in supporting Victoria’s
    from 1 July 2021 with new requirements to
                                                                      transition to a cleaner energy future, in line
    enhance community confidence in the industry.
                                                                      with the government’s commitment to
    The amendment ends a series of moratoriums
                                                                      net-zero emissions by 2050.
    on onshore conventional gas that have been in
    place since 2012. The restart of the industry has             •   In March 2021, the Victorian Government
    the potential to generate about $300 million                      enshrined in the Victorian Constitution a
    annually for regional economies and create up                     permanent ban on hydraulic fracturing (fracking)
    to 6,400 jobs over the lifespan of these projects.                and exploration for mining of coal seam gas.
    Developing the gas would supplement Victoria’s                •   The Victorian Budget 2020/21 provided
    domestic supplies and support approximately                       $5 million over two years to develop, implement
    two million domestic and industrial users.1 In June               and enforce a new regulatory regime to facilitate
    2020, EnergyQuest reported that the onshore                       the orderly restart of the onshore conventional
    conventional gas identified by the Victorian Gas                  gas industry. The government will work with
    Program, while modest, could be beneficial for                    industry and communities to develop rigorous
    industrial gas users. 2                                           engagement and transparency obligations and
•   The department has been engaging with industry                    improve the regulatory framework to guarantee
    and peak bodies to develop new regulations                        a world’s best practice approach.
    to support the Petroleum Act 1998 and the
    reforms arising from the Petroleum Legislation
    Amendment Act 2020. The public will have
    an opportunity to comment on the proposed
    regulations that will define new standards
    in industry transparency and community
    engagement as part of the restart
    of the industry.

1   Victorian Gas Program, Progress Report No 5, December 2020.
2   EnergyQuest, EnergyQuarterly, June 2020
EARTH RESOURCES SECTOR INDICATORS 2019–2020                9

Minerals
The Victorian Government is progressing                                 •     The Prospects Partnership between DJPR
actions outlined in the State of Discovery:                                   and the Australasian Institute of Mining and
Mineral Resources Strategy 2018-23 (2018) to                                  Metallurgy (AusIMM) is a commitment under
help grow investment and jobs in Victoria’s                                   State of Discovery, Victoria’s Minerals Resources
                                                                              Strategy. This partnership seeks to attract
minerals sector.
                                                                              skilled workers to the resources sector and
•   In October 2019, the Victorian Government                                 increase diversity. In February 2020, Minister for
    announced a competitive tender for mineral                                Resources Jaclyn Symes congratulated three
    exploration rights in the North Central Victorian                         recipients on being accepted in the second
    Goldfields area, which is prospective for                                 round of the Women on Boards scholarship
    gold. The North Central Victorian Goldfields                              program under the partnership. The Women on
    area neighbours the Fosterville Gold Mine                                 Boards program aims to increase the number of
    near Bendigo, an internationally-renowned                                 women with Science, Technology, Engineering
    success story with some of the highest gold                               and Mathematics (STEM) knowledge sitting
    grades and lowest cost of production reported                             on resources boards. Research shows diverse
    globally in recent years. This tender raises                              boards result in better outcomes and greater
    the bar significantly for engagement of                                   innovation. While the number of women on
    Traditional Owners in mineral exploration, as                             boards within the resources sector is increasing,
    well as engagement with landholders and local                             women with technical industry skills remain
    communities.                                                              under-represented.
    – Stakeholder engagement around the North                           •     Earth Resources Regulation has undertaken
      Central Goldfields ground release is ongoing.                           significant reforms, implementing
      The department has held initial briefings                               recommendations from the Commissioner for
      with local councils, agencies, water authorities                        Better Regulation’s Getting the Groundwork Right:
      and Traditional Owner groups. Three online                              Implementation Plan (2017).
      community information sessions took place
      in February and March 2020 to provide                             •     On 1 January 2020, the Victorian Government
      information about the tender and the                                    removed the exemption on gold from the
      region’s prospectivity.                                                 Victorian royalty regime. The gold royalty rate
                                                                              is set at 2.75 per cent of the net market value
•   In support of the broader Mining Equipment,                               of production, consistent with the royalty rate
    Technology and Services (METS) sector the                                 for other minerals. The royalty includes a low-
    Department of Jobs, Precincts and Regions                                 production threshold and does not apply to the
    (DJPR) launched the METS Regional Innovation                              first 2,500 ounces of gold produced per annum.
    Accelerator Program in October 2019. The                                  In 2019-20 there were 22 mining licences and only
    program is designed to help regionally based                              five were liable for royalty payments. The gold
    businesses to engage with local mining                                    royalty revenue will assist in delivering a variety of
    companies, fast-track product innovation                                  government priorities and will fund government
    and promote their services.                                               initiatives that support economic recovery.
    – In 2021, the METS Export Hub was launched                         •     The Stavely Ground Release 2018 and the North
      with Austmine and Commonwealth funding.                                 Central Victorian Goldfields Ground Release 2020
      The Victoria METS Export Hub will form                                  will contribute to the growth of Victoria’s mineral
      networks of METS companies and through                                  exploration over the next few years. The release
      providing linkages, connections, training and                           of new areas for exploration is likely to provide
      global market identification, will capitalise                           investors with new exploration and discovery
      on existing strengths to build export                                   opportunities that may one day become new
      opportunities for Victorian METS.                                       operations.

3   Earth Resources Regulation, 2019-20 Annual Statistical Report, p. 22.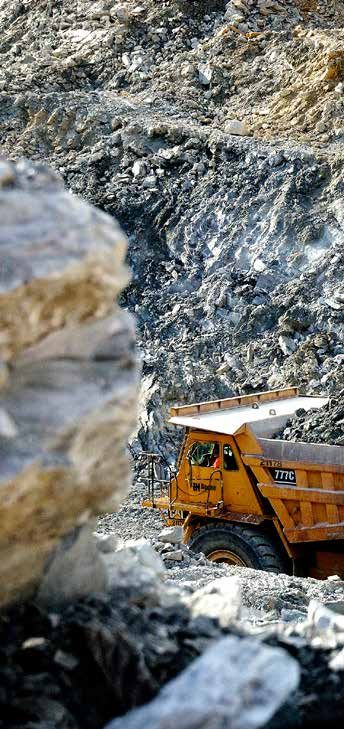
EARTH RESOURCES SECTOR INDICATORS 2019–2020              10

Extractives                                                   developing rehabilitation plans that meet
                                                              new regulatory requirements that commence
Victoria’s Helping Victoria Grow: Extractive                  on 1 July 2021. Completion of the guideline
Resources Strategy (2018) sets out the                        was also an action responding to the VAGO
government’s proactive plan to ensure that                    recommendations on Rehabilitating Mines.
a reliable and affordable supply of extractive
                                                        •   The Strategic Extractive Resource Areas (SERA)
resources continues to be available to support
                                                            Pilot Project is scheduled to be delivered in 2021
Victoria’s growth.
                                                            The SERA Pilot Project will trial the application
The Extractives Strategy Taskforce, which                   of new provisions in the planning scheme to
includes representatives from industry and across           better identify potential extractive resources
government, continues to monitor the extractive             and protect them from encroachment by
resources demand and supply situation closely.              incompatible land uses. The pilots are being
                                                            conducted within the Wyndham and South
Extractive resources and the quarrying sector are           Gippsland local government areas. DJPR is
the foundation of our built environment and linear          partnering with the Department of Environment,
infrastructure, contributing to Victoria’s economic         Land, Water and Planning to deliver this project,
development, liveability and community wellbeing:           in collaboration with the two councils.
•   Many of Victoria’s quarries are in regional and     •   In 2018, the Resources and Planning Ministers
    peri-urban areas and can generate significant           released a joint Ministerial Statement (the
    benefits for host communities and the broader           Statement) to deliver a better approach for land
    region when planned for and operated                    use planning and regulation that will secure the
    responsibly. They are the backbone of many              quarries we need for the growth of the state.
    regional towns, providing employment and                The Statement included a ‘hot list’ of 11 existing
    downstream economic benefits to                         quarries earmarked for new, streamlined
    those communities.                                      approval processes and land use planning
•   The Victorian Government has implemented                reforms for extractives. The hot list was renamed
    regulatory improvements to ensure that                  the Extractive Industry Priority Project List in
    decisions about new and expanded quarries are           July 2020. As at June 2021, 12 listed applications
    accelerated, including providing guidance to            have been approved, and there are 10 eligible
    help industry navigate approval processes.              applications in the updated list. The updated
                                                            list is now published on the DJPR earth
•   The Mineral Resources (Sustainable
                                                            esources website.
    Development) (Extractive Industries) Regulations
    2019 were remade and the updated regulations        •   The Victorian Government is investing
    came into effect in January 2020. The remade            $19.6 billion per year between 2020/21 and
    regulations support the regulator and industry          2023/24, or around $80 billion in total capital
    to better manage the risks associated with              spend over that period. Continued supply
    quarrying (including site rehabilitation) and           of extractive materials is vital to support
    introduced requirements to better capture data          the government’s infrastructure investment
    on reserve levels of sand and stone throughout          as we recover from the coronavirus
    Victoria. Government, community and industry            (COVID-19) pandemic.
    all benefit from access to data to inform           •   Longer term infrastructure projects include
    decision-making on infrastructure, transport,           $70 billion of work already underway on road
    logistics, and construction.                            and rail projects such as the Metro Tunnel, level
    – In March 2021, the Preparation of                     crossing removals, the North-East Link and
      Rehabilitation Plans – Guideline for Extractive       $2.7 billion on the Building Works package
      Industry Projects was released. It provides           towards shovel-ready projects in response to
      industry with information to assist in                the coronavirus (COVID-19) pandemic.
11
• The 2020-2021 Budget allocated funds to capital
projects with a total estimated investment of
up to $19.8 billion, creating the largest capital
program in our state’s history, requiring
extractives material. This includes:
– $5.3 billion for the Big Housing Build to
construct more than 12,000 new social
housing dwellings and create 10,000 jobs
per year for the next four years.
º $532 million has been allocated to six
fast-start projects across greater
Melbourne which will build more than
1,000 new homes.
º On top of the fast-start projects, the
government will also invest $948 million
to spot-purchase properties and buy
new homes in construction projects
that are either in progress or ready to
build. This investment will secure 1,600
social housing properties and 200
affordable homes – bolstering the
construction industry.
– $3.8 billion to maintain and support
our regional rail network;
– $2 billion to build new hospitals and
upgrading existing ones;
– $1.9 billion to upgrade 162 schools,
build one new school and four additional
stages at recently built schools;
– $450 million for a statewide road
maintenance blitz to improve safety
for all road users and help maximise
the productivity of the Victorian road
network; and
– $120 million top up for the Regional
Health Infrastructure Fund.EARTH RESOURCES SECTOR INDICATORS 2019–2020 12
Carbon Capture and Storage Mine Rehabilitation
Following the release of the Statement on The Latrobe Valley Regional Rehabilitation
Future Uses of Brown Coal (2017), the Victorian Strategy (LVRRS) was released in June 2020
Government is continuing to investigate and provides a blueprint to progress Latrobe
carbon abatement strategies including Valley coal mine rehabilitation planning and
activities to achieve safe, stable and sustainable
Carbon Capture and Storage (CCS):
landforms that support the next land use. The
• CarbonNet is advancing its work to test the LVRRS builds on legislative reforms introduced
viability of establishing a commercial-scale in 2019 to strengthen rehabilitation planning
CCS network hub in Gippsland, using world requirements. The implementation of the LVRRS
class offshore storage sites in Bass Strait. will provide mine licensees with further clarity
on the options available for mine rehabilitation.
• CarbonNet is a critical enabler for the
This will include exploring the feasibility of
commercial stage of the Japanese led Hydrogen
alternative water sources and guidance on
Energy Supply Chain (HESC) Project. The HESC
how to assess the future water availability
Pilot Project is a world first looking to prove and
from the Latrobe River system.
commercialise a supply chain between Australia
in the Latrobe Valley and Japan for hydrogen The Mine Land Rehabilitation Authority was
produced from brown coal. established from 30 June 2020 to monitor
• The HESC Pilot Project commenced operations the implementation of the LVRRS and provide
for one year in 2020, with a view to a commercial assurance that government and industry are
project operating in the 2030s, based on the progressing mine rehabilitation planning.
availability of a viable CCS solution. The department is preparing to amend
• The HESC Pilot Project will see $230 million regulations to give effect to the legislative
expended in Victoria and will create reforms introduced in 2019. The Declared Mine
approximately 400 jobs directly and in the Regulations are due to be released for public
supply chain. consultation in 2021.
• If proved viable, HESC and CarbonNet could Community
present Victoria with an option to secure jobs,
boost skills and attract investment in new • The Minister for Resources launched A Guide
industries, while strengthening Victoria’s to Recreational Prospecting in Victoria in
energy security, climate change leadership March 2021. The new guide produced by
and energy export options. Earth Resources Regulation explains where
prospecting can take place, what equipment
• CarbonNet has safely and successfully can be used and the importance of respecting
completed its field activities at the Pelican site Aboriginal and other cultural heritage.
in Bass Strait, a marine seismic survey in 2018
and an offshore appraisal well in 2019/20. • The department opened the second round
of its pilot community advisor grants program
– The data obtained validated that Pelican in March. The program seeks to enable local
is a safe and secure site for permanent community groups to access legal expertise to
CO2 storage. help them understand and contribute to relevant
– All field activities involved stakeholder Environment Effects Statement (EES) processes.
engagement and strict regulatory and
environmental approvals through state
and federal regulators. .EARTH RESOURCES SECTOR INDICATORS 2019–2020 13
• The first round was opened in 2019 for the The earth resources sector is an important source
Fingerboards Mineral Sands proposal EES and is of jobs and economic activity – particularly for
now closed. Mine-free Glenaladale was awarded regional communities – and the government is
$40,000 to engage legal services to assist in committed to supporting the sector during and
making a submission to the EES process. The after the coronavirus (COVID-19) pandemic to aid
second round of grant funding is for the Bunyip in Victoria’s economic recovery:
North Granite Quarry proposal. Two grants of up • Earth Resources Regulation deferred the
to $40,000 each are available. collection of rent and annual fees this year to
• The land access consent tool (launched in 2019) aid the immediate cash flow of mines, quarries
provides new support for landholders. The and exploration companies. The collection of
department has developed a simple, voluntary around $3.5 million of revenue was delayed
land access consent and compensation by 6 months to January 2021.
agreement template, the Commercial Consent • Mineral tenement holders were allowed to
Agreement for Access to Private Land in Victoria defer their annual technical reporting (required
(the Agreement) which can be tailored to the under legislation) as part of the coronavirus
needs of individual parties. (COVID-19) support.
– The Agreement includes special conditions • The government will streamline planning
for an explorer to follow when carrying out to help grow strategically important quarries
exploration work on private property. These and develop new sites, to aid the flow of raw
conditions align with the Mineral Resources materials over the coming years.
(Sustainable Development) Act 1990, the Earth Resources Regulation already has a
Code of Practice for Mineral Exploration and streamlined approval pathway for minor
industry best practice. changes to existing quarries. It will now
– This was originally a pilot project for fast-track the approval process for works
exploration at the Stavely Ground Release in to supply critical material for infrastructure
Western Victoria, but has been extended to projects at a time when businesses are facing
include the North Central Goldfields Ground additional pressure. Continued supply of
Release. The Agreement can also be used for extractive materials is vital to support the
exploration activities outside of these areas. Victorian Government’s construction-led
economic recovery from the coronavirus
Coronavirus (COVID-19) Victorian (COVID-19) pandemic including the $2.7 billion
Government Response Building Works package and other major
The information in this report on coronavirus infrastructure programs.
(COVID-19) is up to date as of 30 June 2021, however • The government is working with industry to
the impacts and responses to the coronavirus position operators and employees to rebound
(COVID-19) pandemic are ongoing post-pandemic, including by progressing the
and dynamic. North Central Victorian Goldfields Ground
Release tender and Victoria’s petroleum
Mining is currently classed as an ‘essential service’
acreage release.
by the federal and state governments. While most
operations were able to continue throughout 2020, • The department will continue to consult with key
the coronavirus (COVID-19) pandemic created stakeholders to understand the ongoing impacts
several unprecedented challenges to the sectors of coronavirus (COVID-19) and how government
such as logistical disruptions, restrictions on can continue to support the resources sector in
equipment and labour availability due to border this context.
closures and challenges to sourcing new capital.EARTH RESOURCES SECTOR INDICATORS 2019–2020 14
• The government worked closely with state • The Victorian Budget 2021/22 allocated funding
and federal counterparts to manage cross- to secure resources to assist with Victoria’s
border issues, which ensured a well-informed economic recovery. The resources portfolio
and coordinated approach to the coronavirus received funding of $35.7 million over four
(COVID-19) response. years to:
– The resources sector was given the green – ensure new quarries can be developed where
light in 2020 and all mining operations across resources are needed and adequate space
regional Victoria and metropolitan Melbourne around them is not compromised;
continued under COVIDSafe Plans. Presently,
– support the Geological Survey of Victoria to
the Victorian resources sector has few
continue its work to attract new investment;
restrictions in place.
and
– On 11 January 2021, a permit system was
– enable further legislative and regulatory
established for all domestic travel into
improvements across the resources sector
Victoria to combat the spread of coronavirus
to reinforce rehabilitation and environmental
(COVID-19). To ensure that the resources
safeguards, support greater community
sector continues to have access to highly
engagement and continue efficient
skilled labour, resources sector specialist
processing of industry applications.
workers whose skills cannot be readily
sourced in Victoria are eligible to apply for • In 2020, the Victorian Government announced
a Specified Worker Permit to enter Victoria. three rounds of the Business Support Fund
totalling $6 billion. This fund has supported
• $1.1 million in funding for Earth Resources
a variety of resources businesses through
Regulation to deal with the surge in mineral
grants, payroll tax refunds and waivers to
and exploration licence applications.
enable businesses cashflow support. This
• The Victorian Government delivered the funding also provides additional, tools and
Victorian Budget 2021/22 on 20 May 2021. resources to help businesses adapt and prepare
The Budget continues vital support for Victorian for reopening under COVID normal settings.
families, businesses and jobs, and kickstarts an
• As at 3 March 2021, 263,042 businesses accessed
unprecedented investment in infrastructure and
the fund, totalling $2.46 billion including:
services that our state will need for decades
to come. This builds on the billions of dollars – 106 mining sector businesses totalling
in support and stimulus that the government $915,000; and
has already announced – delivering jobs for
– 31,100 construction sector businesses
Victorians and helping to repair the damage
totalling $282 million.
that this once-in-a-generation pandemic
has wrought.EARTH RESOURCES SECTOR INDICATORS 2019–2020 15
MINERAL EXPLORATION ACTIVITY
Metres drilled: 388,662 Nearly all metres drilled were on exploration and
Exploration expenditure: $135.8 million mining licences (Table 1), with less metres drilled
on retention licences, which reflects exploration
Mineral exploration activity in Victoria continued
investment in both existing operations and early
to build on last year’s growth in 2019-20:
stage targeting.
• Metres drilled increased by 11.6 per cent from
348,192 metres drilled in 2018-19 up to 388,662 For the past five years Victoria’s annual average
in 2019-20.4 growth rate has outpaced the national average
growth rate in mineral exploration expenditure by
• Mineral exploration expenditure increased
a factor of three. The five-yearly average growth
by 33 per cent – $102.1 million in 2018-195
for Victoria is 44 per cent whilst the national growth
up to $135.8 million in 2019-20.6
is 12.6 per cent.8 This is consistent with Victoria’s
Metres drilled for 2019-20 was at an all-time high for increasing share of Australia’s total mineral
Victoria, which is consistent with 2019-20 being the exploration expenditure which over the same
highest recorded annual mineral exploration spend period has more than doubled from 2.04 per cent
in Victoria’s history.7 in 2015-16 to 4.90 per cent in 2019-20.9
The discrete reporting of mineral exploration Gold remained the primary contributor to mineral
drilling on mining licences over five hectares was exploration investment in Victoria. In 2019-20 there
introduced in 2019-20. was $81.4 million in exploration expenditure for gold;
a 42 per cent increase from the financial year
before (Figure 2).
Table 1: Metres drilled per minerals tenement10
Tenement Type Metres
Exploration Licences 128,778
Retention Licences 35,493
Mining Licences 224,391
Total 388,662
4 Geological Survey of Victoria. – Unpublished data.
5 Note: ABS 8412.0 June release (01/06/2021) contained a revision of historical mineral exploration expenditure data, reference data in
this section has been revised accordingly.
6 ABS, 8412.0, Mineral and Petroleum Exploration, released 01/06/2021.
7 The Australian Bureau of Statistics has been recording mineral exploration expenditure in Victorian since 1988-89.
8 ABS, 8412.0, Mineral and Petroleum Exploration, released 01/06/2021.
9 ABS, 8412.0, Mineral and Petroleum Exploration, released 01/06/2021.
10 Geological Science Victoria, Unpublished Data.EARTH RESOURCES SECTOR INDICATORS 2019–2020 16
EARTH RESOURCES SECTOR INDICATORS 2019–2020                                                     17

Figure 1: Mineral exploration expenditure ($ million, seasonally adjusted)11

                       40                                                                                                                                   1200

                       35
                                                                                                                                                            1000

                                                                                                                                                                   Australia ($ million)
                       30
Victoria ($ million)

                                                                                                                                                            800
                       25

                       20
                                                                                                                                                            600

                       15
                                                                                                                                                            400
                       10

                        5                                                                                                                                   200

                        0                                                                                                                                   0
                             Sep-2009
                             Dec-2009
                             Mar-2010
                             Jun-2010
                             Sep-2010
                             Dec-2010
                              Mar-2011
                              Jun-2011
                              Sep-2011
                              Dec-2011
                              Mar-2012
                              Jun-2012
                              Sep-2012
                              Dec-2012
                             Mar-2013
                              Jun-2013
                              Sep-2013
                             Dec-2013
                             Mar-2014
                              Jun-2014
                             Sep-2014
                             Dec-2014
                              Mar-2015
                              Jun-2015
                              Sep-2015
                              Dec-2015
                             Mar-2016
                              Jun-2016
                              Sep-2016
                             Dec-2016
                              Mar-2017
                              Jun-2017
                              Sep-2017
                              Dec-2017
                             Mar-2018
                              Jun-2018
                              Sep-2018
                             Dec-2018
                             Mar-2019
                              Jun-2019
                              Sep-2019
                             Dec-2019
                             Mar-2020
                             Jun-2020
                                                                                                                                  Victoria          Australia
Note: Earth Resources Sector Indicators only includes information on mineral exploration expenditure.
Petroleum exploration data for Victoria is not reported for confidentiality reasons.

Figure 2: Mineral exploration expenditure by commodity and financial year ($ million)12

                       $140.00

                       $120.00

                       $100.00
$ million

                       $80.00

                       $60.00

                       $40.00

                       $20.00

                        $0.00
                                      2015-16                 2016-17                 2017-18                2018-19                     2019-20

                                                                                                           Gold        Mineral Sands         Coal      Other*

* “Other” includes cases where there is more than one primary mineral.

11                     ABS, 8412.0, Mineral and Petroleum Exploration, released 01/06/2021.
12                     Earth Resources Regulation 2019-20 Annual Statistical Report, p.10.
                       The ABS reports quarterly on private mineral exploration expenditure for all Australian states and the Northern Territory (NT).
                       Victorian mineral exploration and mining expenditure is also reported in accordance with the requirements of the MRSDA. The ABS
                       exploration expenditure statistics can vary significantly from expenditure reported under the MRSDA. The difference between these
                       two exploration expenditure data sets is mainly due to the difference in methodologies for data collection and the inclusion of the
                       exploration expenditure on mining licences in the MRSDA figure. The ABS statistics are a valid basis for comparison of Victorian
                       expenditure with other states and territories. However, the MRSDA figures provide greater detail.
EARTH RESOURCES SECTOR INDICATORS 2019–2020 18
LICENCES
New mineral licences granted: 47 In 2019-20, the total number of licences granted
Renewed mineral licences: 21 or renewed decreased compared to the previous
(Mineral licences refers to the four mineral financial year. However, the number of total active
licence types: exploration, retention, mining licences was at a five-year high reaching 445
and prospecting) total active licences (Table 2). This was supported
by active exploration licences reaching a new high
Overall, mineral licences granted and renewed
since 2015-16, and active licences for prospecting
decreased in 2019-20:
and retention recording a decade high (Table 2).
• New mineral licences granted decreased by This indicates that future mining activity is likely
10 per cent – 52 new licences in 2018-19 down to remain relatively steady.
to 47 in 2019-20.
Over the same reporting period, there was a surge
• Renewed mineral licences decreased by
in mineral exploration and production interest for
49 per cent – 41 renewed licences in 2018-19
Victoria. Earth Resources Regulation received a
down to 21 in 2019-20.
total 154 applications across all licence types,
a 75 per cent increase year-on-year.13
Figure 3: Licences granted or renewed for 2019-2014
80
70
60
50
40
30
20
10
0
2011-12 2012-13 2013-14 2014-15 2015-16 2016-17 2017-18 2018-19 2019-20
Exploration licence granted Exploration licence renewed
Mining licence granted Mining licence renewed
Prospecting licence granted Retention licence renewed
Retention licence granted
13 Earth Resources Regulation, 2019-20 Annual Statistical Report, p. 15.
14 Earth Resources Regulation, 2019-20 Annual Statistical Report, p. 16.EARTH RESOURCES SECTOR INDICATORS 2019–2020 19
Table 2: Current mineral tenements as at 30 June 202015
Tenement Type 2013–14 2014–15 2015–16 2016–17 2017–18 2018-19 2019-20
Exploration 271 247 211 180 200 212 217
Licences
Mining 191 171 170 162 156 145 141
Licences
Prospecting 31 41 51 54 59 55 60
Licences
Retention 1 8 11 15 20 21 27
Licences
Totals 494 467 443 411 435 433 445
Change -8.0 -5.5 -5.1 -7.2 +5.8 -0.5 +2.8
year-on-year
(%)
15 Earth Resources Regulation, 2019-20 Annual Statistical Report, p. 15.
14 Earth Resources Regulation, 2019-20 Annual Statistical Report, p. 15EARTH RESOURCES SECTOR INDICATORS 2019–2020 20
MINER’S RIGHTS
Number of miner’s rights: 8,487
The number of new miner’s rights in Victoria Recreational prospecting is often conducted on
decreased marginally year-on-year in 2019-20. public land and has health and wellbeing benefits
• New miner’s rights granted decreased by for participants. According to the Victorian
0.29 per cent – 8,512 in 2018-19 down to 8,487 Environmental Assessment Council, recreational
in 2019-20 (Figure 4). prospectors contribute to local economies in terms
of spending on consumables and accommodation,
Miner’s rights enable recreational prospectors in prospecting supply shops and through
to search, remove and keep gold, gemstones participation on prospecting tours.16
and other minerals on Crown land or private
land where the activity is allowed.
Figure 4: Number of miner’s rights sold17
9,000
8,600
8,200
7,800
7,400
7,000
2014-15 2015-16 2016-17 2017-18 2018-19 2019-2020
NB: These figures that are published in each Earth Resources Sector Indicators edition may differ from year to year. On average
80 per cent of miner’s rights are sold “online” and the remainder 20 per cent are sold through “agent sales”. Agent Sales are not entered in
the database until Earth Resources Regulation receives payment from the agent. This lag results in some discrepancy in the number
of miner’s right sold for a financial year, In some instances a miner’s right may have been sold by an agent in one year but credited
in the following year.
16 Victorian Environmental Assessment Council, Investigation into additional prospecting areas in parks, June 2013.
17 Earth Resources Regulation, unpublished data.EARTH RESOURCES SECTOR INDICATORS 2019–2020 21
CAPITAL EXPENDITURE
New capital expenditure: $624 million
Earth resources sector capital expenditure in Between July 2019 and December 2019, Victoria
Victoria decreased slightly year-on-year in 2019-20: recorded $335 million of capital expenditure for
• Private new capital expenditure in the the sector (tracking higher than the same period
Victorian earth resources sector decreased in 2018 which recorded $326 million) compared to
by 4.3 per cent – from $652 million in 2018-19 $289 million of capital expenditure between
to $624 million in 2019-20. January 2020 to June 2020. This represents a
reduction of nearly 14 per cent from the first half
While national capital expenditure increased by of the 2019-20 period to the second half.
5.4 per cent in 2019-20 (Figure 5), overall both
national and Victorian capital expenditure has Upcoming projects can be a reliable lead indicator
been on a downward trend for a number of years. of future capital expenditure. Victoria has a total
Victoria’s 2019-20 capital expenditure decline may of 16 major projects in the pipeline with a value
be linked to the onset of the coronavirus (COVID-19) range of $3.1 – 6.6+ billion (Table 3) this is an
pandemic; key concerns raised by industry during increase from 14 major projects with a value range
this time included cash flow pressures, delayed of $3.4 – 5.6+ billion from the year before.18 Over the
investment decisions and logistical complexities. long-term, when these projects move through to the
final investment stage, they are likely to inject
further capital expenditure into the sector.
Table 3: Victorian Major Projects at 31 Oct 202019
Stage Projects (No.) Value($billion)
Publicly Announced 3 0.4-0.9
Feasibility 11 2-5+
Committed 2 0.7
Completed 0 0
Total 16 3.1-6.6+
18 Office of the Chief Economist, Resources and Energy Quarterly, December 2020 – includes Resources and Energy Major Projects: 2019
(NB: These projects span several resource sector commodities).
19 Office of the Chief Economist, Resources and Energy Major Projects: 2020 (NB: These projects span several resource sector
commodities).EARTH RESOURCES SECTOR INDICATORS 2019–2020 22
Figure 5: Private new capital expenditure ($ million)20
2500 100,000
90,000
2000 80,000
Australia ($ million)
70,000
Victoria ($ million)
1500 60,000
50,000
1000 40,000
30,000
500 20,000
10,000
0 0
2009-10 2010-11 2011-12 2012-13 2013-14 2014-15 2015-16 2016-17 2017-18 2018-19 2019-20
Victoria Australia
20 ABS, 5625.0, Private New Capital Expenditure and Expected Expenditure, released 25/02/2021.
Note: Private New Capital Expenditure and Expected Expenditure (5625.0) reports on mining in its entirety, therefore the data is
inclusive of exploration expenditure.EARTH RESOURCES SECTOR INDICATORS 2019–2020 23
PRODUCTION
Quantity: Minerals (Due to different units of measurement per commodity,
no total is included here) – (Table 4), Extractives – 63.11 million tonnes (Table 7)
Sales Value: Total – $2,941.7 million21
Minerals – $1,880.4 million (Table 5)
Extractives – $1,061.3 million (Table 6)
Victoria has a less diverse resource endowment and production
of minerals compared to other Australian jurisdictions.
Table 4: Mineral production22
Commodity Unit 2018–19 2019-20 Change (%)
Brown coal Tonnes 42,256 40,372 -4.5
(thousand)
Gold Ounce 567,501 792,267 +39.6
Antimony Tonnes 2,016 3,141 +55.8
Zircon* Tonnes 0 0 0
Rutile* Tonnes 0 0 0
Ilmenite Tonnes 0 61,197 +100.0
Gypsum† Cubic metres 295,934 282,874 -4.4
Kaolin & fine clay Tonnes 114,050 154,812 +35.7
*
For 2019-20, no production occurred for these minerals.
† The 2018-19 production value for Gypsum has been revised up from 291,842 cubic metres. This is due to late returns submitted by the
industry after the previous report is published.
21 Total excludes the value of gas production due to commercial sensitivity.
22 Earth Resources Regulation, 2019-20 Annual Statistical Report, p. 13.EARTH RESOURCES SECTOR INDICATORS 2019–2020 24 Table 5: Mineral production sales values ($ million)23 Commodity 2018–19 2019-20 Change (%) Gold 1,015.5 1,836.9 +80.9 Antimony 21.2 24.8 +17 Heavy mineral sands 0.0 9.5 N/A (incl. zircon, rutile, ilmenite)sands (incl. zircon, rutile, ilmenite) Industrial minerals 10.3 8.9 -13.6 (incl. feldspar, gypsum, kaolin and fine clay) Other minerals 0.04 0.3 +650 (incl. silver, peat and quartz) Total 1,047.0 1,880.4 +79.6 (excl. brown coal) 23 Earth Resources Regulation, 2019-20 Annual Statistical Report, p. 13. NB: No unit value is assigned to brown coal for the purposes of determining its production value. Brown coal is almost entirely used for electricity production and is largely an internal transfer within mining/generation entities. As such, there is no available market price for brown coal.
EARTH RESOURCES SECTOR INDICATORS 2019–2020                                                 25

GOLD
Gold production in Victoria significantly                                                  The growth in the sales value of gold produced
increased year-on-year in 2019-20:                                                         outpaced the growth of production in 2019-20
•                          Gold production increased by 40 per cent –                      due to record-breaking prices for gold. The onset
                           from 567,501 ounces in 2018-19 to 792,267                       of the coronavirus (COVID-19) created economic
                           ounces in 2019-20.                                              shocks around the world, leading to volatility and
                                                                                           uncertainty in global markets. This led investors
•                          Sales value of gold produced increased                          to seek safe-haven assets such as gold which
                           by 81 per cent – from $1.02 billion in 2018-19                  propelled gold prices in 2020 to an all-time high
                           to $1.84 billion in 2019-20.                                    of A$2,861 an ounce on 7 August 202028 with a yearly
Gold production for the 2019-20 financial year                                             average of A$2,581 an ounce29 this propelled the
was at levels not seen since 1906. 24 Continuing                                           growth in the sales value of gold. The development
on from the success of the previous financial year,                                        and rollout of highly effective coronavirus
in 2019-20, 85 per cent of total gold produced in                                          (COVID-19) vaccines and the global economic
Victoria was produced at the Fosterville gold mine. 25                                     recovery, is expected to undermine some of gold’s
Fosterville is a world class, high-grade, low cost                                         appeal to institutional and retail investors. Investors
underground gold mine26 and remains as Victoria’s                                          are expected to move out of safe haven assets like
largest gold mine by production and the third                                              gold which will contribute to a forecasted easing
largest gold producer in Australia. In 2020 Fosterville                                    of gold prices in 2021 to 2022.30
produced 640,467 ounces of gold, beating the
mine’s 2020 guidance of 590,000–610,000
ounces, mainly due to higher than planned
tonnes processed and average grades during
the second half of 2020. 27

Figure 6: Gold production and sales values31

                           900000                                                                                                                      2,000
Gold production (ounces)

                           900,000                                                                                                                     1,800
                                                                                                                                                               Sales value ($ million

                           800,000                                                                                                                     1,600
                           700,000                                                                                                                     1,400
                           600,000                                                                                                                     1,200
                           500,000                                                                                                                     1,000
                           400,000                                                                                                                     800
                           300,000                                                                                                                     600
                           200,000                                                                                                                     400
                           100,000                                                                                                                     200
                                 0                                                                                                                     0
                                     2009-10   2010-11   2011-12   2012-13   2013-14   2014-15   2015-16   2016-17   2017-18   2018-19   2019-20

                                                                                                                        Production       Sales Value

24 Data updated from Mudd (2007) (courtesy G M Mudd).
25 Earth Resources Regulation – unpublished data.
26 Kirkland Lake Gold, Fosterville Mine Information – https://www.kl.gold/our-business/australia/fosterville-mine/default.aspx
27 Kirkland Lake Gold, January 12, 2021 – Media Release – pr-Q42020productionJan112021FINALREV1clean.pdf (q4cdn.com)
   NB: Kirkland Lake Gold is a Canadian company that reports on a Calendar Year.
28 Office of the Chief Economist, Resources and Energy Quarterly, December 2020 p.98.
29 Office of the Chief Economist, Resources and Energy Quarterly December 2020 p.98.
30 Office of the Chief Economist, Resources and Energy Quarterly December 2020 p.98.
31 Earth Resources Regulation, Annual Statistical Reports, 2009-2020.
EARTH RESOURCES SECTOR INDICATORS 2019–2020 26
GAS
Gas production: 9.83 petajoules The impacts of coronavirus (COVID-19) and
changes to rig contracts has meant that expected
Gas produced in Victorian coastal waters
drilling for Beach Energy’s Enterprise and Artisan
decreased year-on-year in 2019-20:
exploration prospects are to occur in the 2021
• Gas production decreased by 36.2 per cent – financial year.37
from 15.4 petajoules in 2018-19 to 9.83 petajoules
in 2019-20.32 In November 2020, Beach Energy announced a new
gas discovery in the Victorian Otway Basin at its
• Victorian demand for gas increased by
exploration well Enterprise 1. In February 2021
5.9 per cent – from 220 petajoules in 2018 to
Beach Energy confirmed that the 2P (proved and
233 petajoules in 2019.33
probable) reserves include 97 PJ of sales gas
There was a significant increase in gas used for (161 PJ gross) which is more than double Beach
gas-powered generation of electricity (GPG) in Energy’s pre-drill expectation, significantly
2019 to support demand during a high number increasing the value of the discovery. Beach Energy
of unplanned coal-fired generation outages also discovered gas in its Artisan 1 exploration
in Victoria.34 Increased GPG consumption was well, located about 30 kilometres offshore in the
the main driver for the increase in Victorian gas Victorian Otway Basin.
demand in 2019 compared to 2018.
Global oil and gas prices fell sharply in the first half
Most of Victoria’s gas demand is met from of 2020, largely due to impacts on global transport,
offshore gas reserves in Commonwealth waters commercial and industrial sectors as a result of the
in the Bass Strait. Gas produced in these offshore onset of the coronavirus (COVID-19) pandemic.
Commonwealth and Victorian waters is processed
in Gippsland and South-West Victoria. Annual Victoria’s demand and supply balance for gas
supply from offshore Victoria (Commonwealth and is tightening, with producers estimating a large
state waters) in 2020 was 307 petajoules.35 reduction in the amount of available production due
to several fields in the Gippsland and Otway basins
Production in Victorian waters occurs at the being forecast to cease production.38 Overall in the
Halladale and Speculant projects in the south- East Coast, there is projected to be sufficient supply
west of the state (Otway Basin). Beach energy to address demand until 2026, provided committed
indicated in its 2020 annual report that Victorian projects proceed as planned. In Victoria, supply
gas production in the Otway Basin fell due to from outside Commonwealth and Victorian waters
a reduction in working interest investment and will need to be relied upon in the coming decade,
natural field decline.36 unless new local supplies or LNG import terminals
are developed.39
32 Earth Resources Regulation, 2019-20 Annual Statistical Report, p. 19.
33 Australian Energy Market Operator, Victorian Gas Planning Report Update, March 2020, p.4.
34 Australian Energy Market Operator, Victorian Gas Planning Report Update, March 2020, p.4.
35 Australian Energy Market Operator, Victorian Gas Planning Report Update, March 2021 p.16.
36 Beach Energy Annual Report 2020, p.21.
37 Beach Energy Annual Report 2020, p.16.
38 Australian Energy Market Operator, Victorian Gas Planning Report Update, March 2020 p.24.
39 Australian Energy Market Operator, Gas Statement of Opportunities, March 2021 p.5.EARTH RESOURCES SECTOR INDICATORS 2019–2020 27
Table 6: Gas production40
Commodity Unit 2018-19 2019-20 Change (%)
Gas Petajoules (PJe) 15.4 9.83 -36.2
Figure 7: Gas production (petajoules)41
25
20
15
10
5
0
2016-17 2017-18 2018-19 2019-20
40 Earth Resources Regulation, 2019-20 Annual Statistical Report, p. 19.
Note: Gas production data only includes gas sourced from Victorian jurisdiction coastal waters.
Around 95 per cent of gas processed in Victoria is produced in Commonwealth jurisdiction waters.
41 Earth Resources Regulation, 2016-17 to 2019-20 Annual Statistical Reports.EARTH RESOURCES SECTOR INDICATORS 2019–2020 28
EXTRACTIVES
Production sales volume: 63.11 million tonnes with more than 63 million tonnes of extractives
Production value: $1.06 billion being produced. This represents the highest level
of extractive production recorded in Victoria over
Extractive resource production volume and value
the past decade.45
both increased year-on-year in 2019‑20:
• Extractives production volume increased by Future extractive resource production is anticipated
0.4 per cent – from 62.86 million tonnes in 2018- to be supported by Earth Resource Regulation’s
19 to 63.11 million tonnes in 2019-20.42 granting of four new work authorities during 2019-
20. Work authorities granted as well as approvals
• Extractives sales value increased by 3.7 per
for expanding existing quarries may vary each
cent – from $1.02 billion in 2018-19 to $1.06 billion
year due to the robust regulatory approvals
in 2019-20.43
process. Variations per year may also occur due
• 4 new extractive industry work authorities were to the Extractive Industry Priority Project List
granted in 2019-20, in addition to the 11 new which identifies quarry projects to be given priority
extractive industry work authorities that were planning consideration.
granted in 2018-19.44
In 2019-20, the top five extractive resource
Since the 2013‑14 financial year, extractive producing Local Government Areas (by volume)
resource production in Victoria (both volume were Wyndham, Cardinia, Greater Geelong,
and value) has been consistently increasing each Moorabool, and Whittlesea, respectively (Figure 8).
year. The upward trend continued in 2019-20,
Figure 8: Annual Production
Annual extractives production volume (tonnes), by Local Government Area.46
Production of Extractive Resources
2019-2020 (tonnes)
0 - 5,000
5,000 - 250,000
250,000 - 500,000
500,000 - 1,000,000
1,000,000 - 2,000,000
2,000,000 - 4,000,000
> 4,000,000
WHITTLESEA
MOORABOOL
WYNDHAM
GREATER CARDINIA
GEELONG
42 Earth Resources Regulation, 2019-20 Annual Statistical Report, p.5 (2018-19 value revised up from 62.7 million tonnes).
43 Earth Resources Regulation, 2019-20 Annual Statistical Report, p.5 (2018-19 value revised up from $1021.63 million).
44 Earth Resources Regulation, 2019-20 Annual Statistical Report, p.8.
45 DJPR analysis of Earth Resources Regulation Annual Statistical Reports 2010-11 – 2019-20.
46 Department of Jobs, Precincts and Regions. Note: Top five extractive resource producing Local Government Areas labelled.
47 Earth Resources Regulation, 2019-20 Annual Statistical Report, p. 7.EARTH RESOURCES SECTOR INDICATORS 2019–2020 29
Table 7: Extractives volume and value of production47
Product Product 2018–19 2019-20 Change 2018-19 2019-20 Change
Group Type Sales Sales (%) Sales Sales (%)
Volume Volume Value Value
(thousand (thousand ($ million) ($ million)
tonnes) tonnes)
Hard Rock Basalt 25,460 25,910 1.8 435.2 444.6 2.1
Dolerite 1 0 -100 0 - -
Gneiss 10 80 700 0 1.9 -
Granite 5,350 7,060 32 117.7 138.8 18
Hornfels 5,220 5,270 1 86.9 89.6 3.1
Quartzite 30 10 -66.7 0.8 0.6 -20
Rhyodacite 1,510 1,540 2 33.5 35.5 6
Schist 480 430 -10.4 9.3 8.3 -10.6
Slate 40 40 0 1.2 1.4 16.2
Trachyte 30 30 0 0.7 0.5 -27.1
Sub-total 38,131 40,370 5.9 685.2 721.2 5.3
Clay & clay
Soft rock 1,200 1,310 9.2 3.5 4.8 38.4
shale
Limestone 1,980 1,930 -2.5 28.9 30.9 6.8
Sand &
16,670 14,700 -11.8 248.9 246.2 -1.1
gravel
Scoria 760 920 21.1 13 15.1 16.3
Sedimentary 3,760 3,410 -9.3 39.8 39.1 -1.6
Soil 50 60 20 0.6 0.1 -83.9
Tuff 320 410 28.1 3.5 3.8 10.3
Sub-total 24,740 22,740 -8.1 338.1 340.1 0.6
Grand
62,871 63,110 0.4 1,023.3 1,061.3 3.7
total
Note: Because of rounding, numbers may not add.EARTH RESOURCES SECTOR INDICATORS 2019–2020 30
EXTRACTIVES: DEMAND AND SUPPLY
Demand (Value of building work done): Coronavirus (COVID-19) Impacts
$40.4 billion
The tendency of the construction sector to lag
Supply (Total resource produced): the economy has seen short-term demand for
63.1 million tonnes extractives remain strong throughout 2019-20,
despite local and global uncertainty resulting
In 2019-20, the value of building work undertaken from the coronavirus (COVID-19) pandemic.
in Victoria was $40.4 billion,48 reflecting a
1.3 per cent year-on-year increase (Figure 9). Construction sector performance reported by
This metric captures residential and non-residential the ABS suggests demand for extractives will
construction projects. The value of work done continue to remain strong over the short-term.
for residential construction projects fell by around Coronavirus (COVID-19) related macroeconomic
2 per cent49, whereas non-residential construction shocks, particularly in population growth, may have
projects rose by around 9 per cent.50 a negative effect on the construction sector, 52
and by extension extractive resource demand,
This level of construction activity resulted in over the medium and long-term. This effect is
demand for extractive materials exceeding expected to be offset to some degree by
63 million tonnes in 2019‑20—the highest economic stimulus measures and construction
volume of extractives produced in Victoria sector investment from both Commonwealth
over the past decade. and Victorian governments.53
Role of Construction Sector in DJPR Demand and Supply Update
Extractives Demand
The government’s Helping Victoria Grow:
Demand for extractive resources is driven primarily Extractive Resources Strategy (2018) acknowledges
by the activity of the construction sector. the need for high quality data on the extractives
Quarry-based construction materials are vital sector and commits to comprehensively update
inputs to the building of residences, commercial extractive resource demand and supply forecasts
buildings, roads and railways, and utilities, e.g. every five years. Throughout 2021, DJPR, under
wind, solar and fossil fuel electricity generators, the oversight of the Extractive Strategy Taskforce,
and water treatment facilities. will be working with industry on this important
analysis. The process will be strengthened by recent
Construction projects are typically characterised
regulatory changes which require work authority
as having long—sometimes multi-year—lead times
holders to report estimates of resources yet to be
from design and planning through to completion.
extracted at their quarry sites. These new reporting
Accordingly, construction project delivery is
requirements are expected to enhance the
generally governed by long-term contracts.
predictive accuracy of forward-looking projections
As such, the output of the construction industry
of extractive resource supply in Victoria.
typically lags the performance of the broader
economy by around 12-18 months.51 The comprehensive supply and demand update
report is expected to be released publicly in 2022,
with information included as part of the next edition
of the Earth Resources Sector Indicators report.
48 ABS, 8755.0, Construction Work Done, released 25/11/2020.
49 ABS, 8752.0, Building Activity, released 20/01/2021.
50 ABS, 8752.0, Building Activity, released 20/01/2021.
51 Reserve Bank of Australia, Housing Construction Cycles and Interest Rates, 2004.
52 National Housing Finance and Investment Corporation, State of the Nation’s Housing, 2020.
53 Victorian government initiatives are listed in this report in “Victorian Government Policy–Extractives”.You can also read