SUPPORT TO WATER RESOURCES MANAGEMENT IN THE DRINA RIVER BASIN
←
→
Page content transcription
If your browser does not render page correctly, please read the page content below
Public Disclosure Authorized

                               Consulting Services for

                               SUPPORT TO WATER RESOURCES
                               MANAGEMENT IN THE
Public Disclosure Authorized

                               DRINA RIVER BASIN
                               PROJECT ID NO. 1099991

                               DRINA WATER MANAGEMENT MODEL IN WEAP
Public Disclosure Authorized
Public Disclosure Authorized

                               August 2017
Consulting Services for

SUPPORT TO WATER RESOURCES
MANAGEMENT IN THE
DRINA RIVER BASIN
PROJECT ID NO. 1099991

DRINA WATER MANAGEMENT MODEL IN WEAP

August 2017

PROJECT NO.     A038803
DOCUMENT NO.    1
VERSION         D
DATE OF ISSUE   August 2017
PREPARED        Jasna Plavšić and Tina Dašić, University of Belgrade – Faculty of Civil Engineering
CHECKED         Nadja Zeleznik, REC
APPROVED        Roar Selmer Solland, COWI
Consulting Services for

SUPPORT TO WATER RESOURCES MANAGEMENT
IN THE DRINA RIVER BASIN
PROJECT ID NO. 1099991

This document has been produced with the financial assistance of the European Western
Balkans Joint Fund under the Western Balkans Investment Framework. The views expressed
herein are those of authors and can therefore in no way be taken to reflect the official opinion
of the Contributors to the European Western Balkans Joint Fund or the EBRD and the EIB, as
co‐managers of the European Western Balkans Joint Fund.
World Bank                                                                                                                    Drina Water Management Model in WEAP
Support to Water Resources Management in the Drina River Basin                                                                                                    i

                                                                    Table of Contents

1       Introduction ................................................................................................................................... 1
        1.1 Brief description of the Drina River Basin .......................................................................................... 1
        1.2 Selection of the modelling tool .......................................................................................................... 2
2       Brief overview of WEAP .................................................................................................................. 4
        2.1 WEAP software .................................................................................................................................. 4
        2.2 Modelling water resources systems in WEAP .................................................................................... 4
               2.2.1       System description – study area .................................................................................................. 4
               2.2.2       Creating scenarios........................................................................................................................ 6
               2.2.3       Simulations and results ................................................................................................................ 7
3       Drina water resources management model ..................................................................................... 8
        3.1 General modelling approach.............................................................................................................. 8
        3.2 Stages in model development ........................................................................................................... 9
        3.3 Time horizons and model versions .................................................................................................... 9
        3.4 System configuration and input data ............................................................................................... 11
               3.4.1       Demand sites ............................................................................................................................. 13
               3.4.2       Rivers ......................................................................................................................................... 14
               3.4.3       Reservoirs .................................................................................................................................. 14
               3.4.4       Run-of-river hydropower plants ................................................................................................ 16
               3.4.5       Diversions .................................................................................................................................. 17
               3.4.6       Pumped-storage hydropower plants ......................................................................................... 17
               3.4.7       Flow requirements ..................................................................................................................... 18
               3.4.8       River reaches.............................................................................................................................. 19
               3.4.9       Groundwater sources ................................................................................................................ 22
               3.4.10      Transmission links and return flows .......................................................................................... 23
               3.4.11      Key Assumptions ........................................................................................................................ 23
               3.4.12      Input from hydrologic model ..................................................................................................... 24
        3.5 Scenarios in WEAP ........................................................................................................................... 25
               3.5.1       System configuration scenarios ................................................................................................. 25
               3.5.2       Socio-economic scenarios .......................................................................................................... 26
               3.5.3       Climate scenarios and hydrologic projections ........................................................................... 27
4       Simulation results ........................................................................................................................ 28
        4.1 Water supply .................................................................................................................................... 28
        4.2 Hydropower generation................................................................................................................... 29
        4.3 Flow requirements ........................................................................................................................... 33
5       Concluding remarks ...................................................................................................................... 38
        5.1 Summary of the model development .............................................................................................. 38
        5.2 Recommendations for further model development........................................................................ 39
6       References ................................................................................................................................... 41
Drina Water Management Model in WEAP World Bank
ii Support to Water Resources Management in the Drina River Basin
7 Abbreviations .............................................................................................................................. 43
Appendix A: Key Assumptions ............................................................................................................... 45
Appendix B: Demand sites data ............................................................................................................. 46
Appendix C: Rivers – Headflow .............................................................................................................. 49
Appendix D: Reservoirs ......................................................................................................................... 50
Appendix E: Run-of-river hydropower plants and diversions ................................................................... 52
Appendix F: Flow requirements ............................................................................................................. 54
Appendix G: River reaches ..................................................................................................................... 57
Appendix H: Groundwater ..................................................................................................................... 63
Appendix I: Transmission links and return flows ..................................................................................... 64
Appendix J: Input from hydrologic model ............................................................................................... 65
Appendix K: Simulation results .............................................................................................................. 68
K.1 Hydropower generation .................................................................................................................... 68
K.2 Flow requirements ............................................................................................................................ 76World Bank Drina Water Management Model in WEAP
Support to Water Resources Management in the Drina River Basin iii
List of Figures
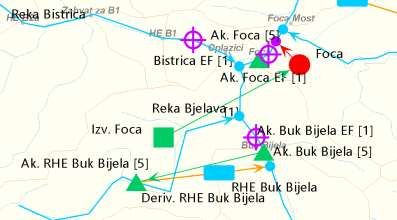
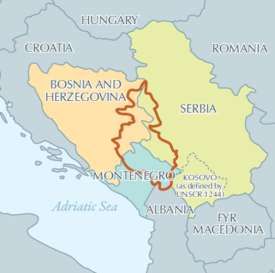
Figure 1-1: Extent of the Drina River Basin. Source [1]......................................................................................... 1
Figure 2-1: WEAP schematic representation of the water resources system with main components. ............... 5
Figure 3-1: Modelling framework for developing the water management model for DRB. ................................ 8
Figure 3-2: Schematic of the Drina River Basin water resources system in WEAP. ............................................ 11
Figure 3-3: Detail of the schematic of the Drina River Basin water resources system in WEAP (Piva and
Tara Rivers) .................................................................................................................................... 12
Figure 3-4: Detail of the schematic of the Drina River Basin water resources system in WEAP (Uvac
River). ............................................................................................................................................ 12
Figure 3-5: Agriculture demand sites in the Drina WRM model. ........................................................................ 14
Figure 3-6: Representation of the pumped-storage HPP Buk Bijela in the Drina WRM model. ......................... 18
Figure 3-7: Natural water balance components for river reach and corresponding sub-basin.......................... 20
Figure 4-1: Coverage of water supply to Pljevlja industry with greater flow requirement of 1.27 m3/s
below the Otilovići reservoir: ensemble medians with ranges of results from different
climate models for RCP 4.5 (left) and RCP 8.5 (right).................................................................... 29
Figure 4-2: Annual hydropower generation in DRB for different development options; ensemble
medians for RCP 4.5 (top) and RCP 8.5 (bottom) climate scenarios. ............................................ 30
Figure 4-3: Average annual hydropower generation in DRB for different development options;
ensemble medians with ranges of results from different climate models for RCP 4.5 (left)
and RCP 8.5 (right) climate scenarios. ........................................................................................... 30
Figure 4-4: Climate change impact: change in average annual hydropower generation in DRB relative to
1961-1990 under Green Growth option (existing HPPs only); ensemble medians with
ranges of results from different climate models for RCP 4.5 (left) and RCP 8.5 (right). ............... 32
Figure 4-5: Development options effect: change in average annual hydropower generation in DRB
relative to Green Growth option; ensemble medians with ranges of results from different
climate models for RCP 4.5 (left) and RCP 8.5 (right) climate scenarios. ...................................... 32
Figure 4-6: Combined climate change and development options effects: change in average annual
hydropower generation in DRB relative to 1961-1990; ensemble medians with ranges of
results from different climate models for RCP 4.5 (left) and RCP 8.5 (right). ............................... 32
Figure 4-7: Coverage of environmental flow requirements at head parts of the basin; ensemble
medians with ranges of results from different climate models for RCP 4.5 (top) and RCP
8.5 (bottom) climate scenarios. .................................................................................................... 33
Figure 4-8: Temporal reliability of environmental flow requirements at head parts of the basin;
ensemble medians with ranges of results from different climate models for RCP 4.5 (top)
and RCP 8.5 (bottom) climate scenarios. ...................................................................................... 34
Figure 4-9: Coverage of flow requirements below the planned Brodarevo 1 run-of-river HPP; ensemble
medians with ranges of results from different climate models for RCP 4.5 (left) and RCP
8.5 (right) climate scenarios. ......................................................................................................... 35
Figure 4-10: Coverage of flow requirements for the Lim River to Prijepolje under “Full HPP” scenario;
ensemble medians with ranges of results from different climate models for RCP 4.5 (left)
and RCP 8.5 (right) climate scenarios. ........................................................................................... 35Drina Water Management Model in WEAP World Bank
iv Support to Water Resources Management in the Drina River Basin
Figure 4-11: Temporal reliability of flow requirements for the Lim River to Prijepolje under “Full HPP”
scenario; ensemble medians with ranges of results from different climate models for RCP
4.5 (left) and RCP 8.5 (right) climate scenarios. ............................................................................ 35
Figure 4-12: Time series of storage volume in the planned reservoirs in the Lim River to Prijepolje
under the “Full HPP” scenario (Andrijevica, Lukin Vir and Brodarevo 2); simulation with
the RCP 4.5 climate scenario, model 4. ......................................................................................... 36
Figure 4-13: Time series of storage volume in the reservoirs in the Lim River below Prijepolje under the
“Full HPP” scenario (existing Potpeć reservoir and planned Mrsovo reservoir); simulation
with the RCP 4.5 climate scenario, model 4. ................................................................................. 36
Figure 4-14: Coverage of greater flow requirement (1.27 m3/s) below the existing Otilovići reservoir;
ensemble medians with ranges of results from different climate models for RCP 4.5 (left)
and RCP 8.5 (right) climate scenarios. ........................................................................................... 37World Bank Drina Water Management Model in WEAP
Support to Water Resources Management in the Drina River Basin v
List of Tables
Table 1-1: Subdivision of the Drina River Basin. ................................................................................................... 2
Table 2-1: Main variables reflecting crucial information for water balance assessment in WEAP. ..................... 6
Table 3-1: Development options for DRB (based on Chapter 4 of the IPF country reports [4])........................... 9
Table 3-2: Time horizons and management scenarios in two versions of the Drina WRM model in
WEAP. ............................................................................................................................................ 10
Table 3-3: Main variables in WEAP related to demand sites. ............................................................................. 13
Table 3-4: Main variables in WEAP related to reservoirs. .................................................................................. 15
Table 3-5: Main variables in WEAP related to run-of-river power plants. ......................................................... 17
Table 3-6: Main variables in WEAP related to river reaches. ............................................................................. 20
Table 3-7: Natural water balance components in WEAP with corresponding components from the JCI
hydrologic model. .......................................................................................................................... 21
Table 3-8: Main variables in WEAP related to groundwater sources. ................................................................ 22
Table 3-9: Water balance components from the JCI hydrologic model. ............................................................ 24
Table 3-10: Scenarios in WEAP related to development options for DRB as defined in the IWRM
country reports.............................................................................................................................. 25
Table 3-11: List of HPPs included in the specific scenarios in WEAP. ................................................................. 26
Table 3-12: Socio-economic scenarios: growth rates for population, industrial production and
agricultural production.................................................................................................................. 26
Table 3-13: List of climate modelling (RCM/GCM) chains used in the study...................................................... 27
Table 3-14: Hydrologic simulations with climate projections............................................................................. 27
Table 4-1: Average annual hydropower generation for different development options and for different
periods under two climate scenarios (ensemble median values). ................................................ 31World Bank Drina Water Management Model in WEAP Support to Water Resources Management in the Drina River Basin 1 1 Introduction This report provides a description of the development of a water management model for the Drina River Basin (DRB) that is one of the main deliverables of the “Support to Water Resources Management in the Drina River Basin” project. The overarching objective of the project is to support more effective water resources management in DRB taking into consideration sustainable water use, flood mitigation and environmental management, while involving stakeholder consultations to ensure adequate public participation. This approach is meant to support water management authorities in preparation of investment plans and the river basin management plans. Meeting the objective of integrated river basin management and strategic planning involves applying modern technology and scenario simulation tools. Development of a water management model is one of the key steps in reaching the above objectives for DRB. The model serves in considering different water management options over a range of development and climate scenarios in DRB. It also enables stakehold- ers to make adequate plans and be better prepared for future decisions. This report describes work done on data collection and water management model development, and also presents the results of simulations with different development scenarios and future climate scenarios. It builds on other reports within the project: Inception Report, Integrated Water Resources Management (IWRM) Study and Plan – Background Paper, and Investment Prioritisation Framework (IPF) Report. 1.1 Brief description of the Drina River Basin The Drina River Basin (DRB) has an area of 19,680 km2, the largest part of which spreads over territory within three riparian states: Bosnia and Herzegovina (BiH), Montenegro (MNE) and Serbia (SRB); see Figure 1-1 and Table 1-1. In addition, Albania accounts for a very small part of the DRB (
Drina Water Management Model in WEAP World Bank
2 Support to Water Resources Management in the Drina River Basin
Table 1-1: Subdivision of the Drina River Basin.
Riparian state Area Portion of DRB Portion of state Basin population
2
(km ) territory
Bosnia and Herzegovina 7,301 37.1% 14.3% 520,000
Republika Srpska (6,242) (31.7%) (25.7%) (450,000)
Federation of Bosnia and Herzegovina (840) (4.2%) (3.2%) (70,000)
Montenegro 6,219 31.6% 45.0% 150,000
Serbia 6,002 30.5% 7.7% 300,000
Albania 158 0.8% 0.5% NA
TOTAL 19,680 100% 970,000
The Drina River originates in Montenegro where it drains a substantial karst mountainous plateau that
receives the highest annual rainfall in Europe (about 3000 mm/year), resulting also in the highest specific
runoff in Europe (up to 50 L/s/km²). Two source-rivers of the Drina River, the Tara River and the Piva River,
merge at Šćepan Polje along the BiH/Montenegrin border with a combined mean annual discharge of 154
m³/s. Another source-river is the Lim River, which joins the Drina River at Višegrad with a mean annual
discharge of 113 m³/s. The Drina River reaches the confluence with the Sava River after a length of 346 km
and a height difference of 350 m (equivalent to a 1% average slope), with mean annual discharge of about
400 m³/s.
Almost one million people live within the basin. In Montenegro, an estimated population of 150,000 people
are living within the basin arranged into 10 municipalities. In BiH, some 520,000 people are living in 31
municipalities, with 450,000 (86.5%) in 19 municipalities of the RS and 70,000 (13.5%) in 12 municipalities
of the FBiH. In Serbia, about 300,000 people live in 15 townships/municipalities situated in the DRB.
The DRB is rich in endowments of natural resources and in development potential. It has significant hydro-
power generation potential; at present it hosts eight medium to large hydropower plants (HPPs), but an
estimated 60% of the potential for hydropower generation remains untapped. The DRB also has a rich
biodiversity. The river water is of generally good quality due to its high flow rates and low pollution and
abundant in fish. A number of natural parks and protected areas are spread throughout the basin and the
landscape is dotted with unique glacial lakes and canyons, among which is the Tara Canyon, a UNESCO
World Heritage site.
The main water uses are municipal and industrial water supply, irrigation and hydropower generation.
Water abundancy has not created significant water conflicts in the basin in the past. However, the present
increasing development desires diverging across the countries and across the economy sectors as well as
the increasing pollution and climate change threats call for pursuing an integrated water resources man-
agement approach to DRB planning and management.
1.2 Selection of the modelling tool
The Terms of Reference (Appendix 2, Task 4) require development of a simulation model as a tool in as-
sessing impacts of large-scale developments and climate variability on water availability in DRB. The model
should enable:
review of each sector,
checking the robustness of the system and within each sector,
simulating future developments (climate variability or other changes in the basin),
consideration of modifications to planning and infrastructure,
simulations to support cost analysis and environmental evaluations for major infrastructure consid-
erations.World Bank Drina Water Management Model in WEAP Support to Water Resources Management in the Drina River Basin 3 In the Inception Report, the Consultant has proposed to meet the project objectives by employing the WEAP modelling software by SEI (Water Evaluation and Planning System by Stockholm Environment Insti- tute) to develop the water management model for DRB. The decision to use the WEAP model as the model- ling platform has been made for two reasons. First, the WEAP software is free for use by governmental institutions in developing countries, a category to which the Drina riparian countries belong.1 Second, the WEAP software allows building water management models of different complexity, depending primarily on the available information. In case of general poor data availability in the Drina basin, WEAP has an ad- vantage of offering a possibility to build a water management model with low data requirements. Within this project, the WEAP software is used to develop only the water management part of the model. The hydrologic response from the basin can also be modelled in WEAP, but it requires a considerable amount of input data. Therefore, in this project the hydrologic response is provided as an input to WEAP and is simulated by a separate hydrologic model developed by JCI (the model is described in the IWRM country reports [3]; herein: the JCI hydrologic model). Such a coupling of models was indicated in the Incep- tion Report and was motivated by the existence of a readily available hydrologic model for DRB. 1 SEI defines developing countires as those countries that are not on the World Bank’s list of high-income countries (https://en.wikipedia.org/wiki/World_Bank_high-income_economy).
Drina Water Management Model in WEAP World Bank
4 Support to Water Resources Management in the Drina River Basin
2 Brief overview of WEAP
2.1 WEAP software
The WEAP model operates on the basic principle of water balance accounting [2]. It is applicable to both
single sub-basin and complex river systems. It uses an integrated approach to simulate water systems by
taking into account both the water supply and the demand side of the water balance equation, and it
enables examining alternative water development and management strategies. On the demand side, WEAP
considers water use patterns, hydropower energy demand, equipment efficiency, allocation priorities, etc.
On the supply side it considers streamflow, groundwater, reservoirs and water transfer. WEAP can also
address water conservation, water rights, reservoir operation, ecosystem requirements, and the project
cost-benefit analysis [2].
The water management model for DRB is developed in WEAP 2016.01 software version. WEAP software
documentation includes a detailed User Guide and Tutorial. The software installation and documentation
can be downloaded from the WEAP web site.2
2.2 Modelling water resources systems in WEAP
A water resources system in WEAP is called a study area. The study area represents the water resources
system configuration and its components, and contains data and assumptions about the system. The sys-
tem consists of linked demands and supplies (rivers, reservoirs, groundwater aquifers, demand nodes, etc.).
The same geographic area or watershed under alternative configurations or different sets of demand data
or operating assumptions can be represented by several different study areas. The study areas can be
thought of as databases where different sets of water supply and demand data are stored, managed and
analysed.
The Current Accounts represent the definition of the water system as it currently exists and include supply
and demand data for the first year of the study. The Current Accounts are also assumed to be the starting
year for all scenarios.
Scenarios in WEAP include assumptions on future policies, development and other factors that affect
demand and supply. Scenarios can be built and then compared to assess their water requirements and
impacts. All scenarios start from a common year for which the Current Accounts data are established.
Scenarios in WEAP may include any factor that can change over time, such as factors reflecting different
socio-economic assumptions.
Once the system (the study area) is described for Current Accounts and the scenarios are defined over
specified time horizons, water balance and allocation is calculated for each system component (river reach,
reservoir, aquifer, demand sites etc.). The results enable evaluation of the scenarios with regard to water
sufficiency, compatibility with environmental targets, costs and benefits, and sensitivity to uncertainty in
key variables.
2.2.1 System description – study area
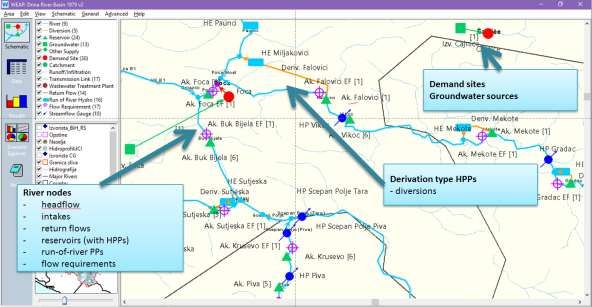
The water resources system is represented in the WEAP schematic view (Figure 2-1) as a set of the system
components. The components consist of the nodes and links between the nodes. They include:
Rivers
Diversions
2
www.weap21.orgWorld Bank Drina Water Management Model in WEAP
Support to Water Resources Management in the Drina River Basin 5
Reservoirs
Run-of-river HPPs
Groundwater sources
Other supply sources
Demand sites
Transmission links (intakes)
Return flows (discharges)
Waste water treatment plants
Flow requirements
Catchment (hydrologic simulation; not used if flow in rivers is provided)
Gauging stations (for comparison, where relevant)
The main component of the water resources system is the river and its reaches. A river reach is defined as
the section of a river or diversion between two nodes. WEAP refers to a reach by the node above it. The
nodes on the river represent reservoirs, run-of-river hydropower plants, starting points of diversions,
starting points of transmission links as intake locations, ending points of return flows as the discharge
locations, nodes with specified flow requirements etc.
Other nodes of the system that are not located on the river are demand sites (municipal, industrial, agricul-
tural or other water supply) or groundwater aquifer nodes. Demand nodes are connected to the supply
sources by transmission links, while the return flow links are used for discharges from the demand sites.
Diversions divert water from one river node to another node on the same or on another river. Diversions
are also used for derivation-type HPPs to convey water from the river or reservoir to the power plant.
The reservoirs may include dam-type hydropower plants. A run-of-river power plant can be located either
on a river or on a diversion. Pumped-storage power plants could be modelled with a transmission link
between the reservoirs provided that rules are defined about how much water is transferred and under
what conditions.
WEAP allows importing GIS layers in ESRI formats (SHP vector files and ADF raster files) to support visual
representation of the water resources system.
Figure 2-1: WEAP schematic representation of the water resources system with main components.Drina Water Management Model in WEAP World Bank
6 Support to Water Resources Management in the Drina River Basin
Table 2-1: Main variables reflecting crucial information for water balance assessment in WEAP.
WEAP components Variables
Demand Municipal water supply Number of inhabitants, specific water demand, losses within the
demand site
Industrial water supply Water use rate
Agricultural water supply Irrigated area, specific water demand
Reservoir type HPPs Energy demand, max. turbine flow, tailwater elevation, generating
efficiency
Derivation type HPPs Energy demand, max. diverted flow
Flow requirements Minimum monthly instream flow required for social or environmental
purposes
Supply River reaches Water balance for sub-basins between two nodes (surface water and
groundwater inflows from sub-basin)
Reservoirs Storage capacity, volume-elevation curves
Groundwater Natural recharge, storage capacity, maximum withdrawal
Water balance is assessed by taking into account numerous variables related to the demand and supply
nodes. Data needed to describe the system are specific to particular components. The most important
information and data for calculating water balance and solving water allocation equations is given in Table
2-1.
When calculating water balance, WEAP determines the water allocation order based on two priority sys-
tems: demand priorities and supply preferences.
Demand priority is related to the competing demand sites, reservoirs (priority for filling or hydro-
power) and flow requirements. Priorities can range from 1 to 99, with 1 being the highest priority
and 99 the lowest. Demand sites can share the same priority. Default value for the reservoir filling
priorities is 99, meaning that they will fill only if water remains after satisfying all other higher pri-
ority demands.
Supply preferences are related to a demand site connected to more than one supply source to de-
fine the preferred source for the given site. The supply preferences are assigned to corresponding
transmission links.
Additionally, there are two methods for specifying hydropower energy demands to prioritize reservoir
releases to generate hydropower: as individual energy demands for each reservoir, or as an aggregate
energy demand at the system level.
2.2.2 Creating scenarios
The scenarios in WEAP are conceived as story-lines of how a system might evolve over time under particu-
lar assumptions about future socio-economic, policy and technology conditions [2]. All scenarios start from
a common year, for which the current system configuration and data are established (i.e. the Current
Accounts year). Scenarios in WEAP may include any factor that can change over time. In addition, different
system elements may have different start-up years in different scenarios.
The scenarios include certain assumptions about the changes in the water resources system (change in
water use, population growth, hydrology etc.). These assumptions are formalized in WEAP as Key Assump-
tions, where the particular assumed values are assigned to Key Assumption variables. Different scenarios
are generally based on different Key Assumptions.World Bank Drina Water Management Model in WEAP Support to Water Resources Management in the Drina River Basin 7 By default, the specified time horizon is assigned to the Reference Scenario. Reference scenario is the one to which other scenarios are compared. The user can create one or more alternative scenarios. A scenario can be can be nested under another scenario to inherit data and assumptions from the prede- cessor, meaning that only the parameters that change with the scenarios should be entered for the succes- sor. By default, the Reference scenario is nested under the Current Accounts and inherits all data from the Current Accounts. Alternative user-defined scenarios can be nested directly under Current Accounts or under any other scenario. 2.2.3 Simulations and results Once the simulation is performed, WEAP offers many ways to explore the results of water resources simu- lations. The values of all computed variables such as the reservoir storage or elevation, groundwater stor- age, water supply demand, supply delivered, supply coverage, hydropower generation etc. can be present- ed as time series or as aggregated values over the chosen time horizon.
Drina Water Management Model in WEAP World Bank
8 Support to Water Resources Management in the Drina River Basin
3 Drina water resources management model
3.1 General modelling approach
The Drina River Basin water resources management model (hereinafter: Drina WRM model) is a part of the
modelling framework that supports consideration of different development options and water manage-
ment strategies in DRB. The modelling framework consists of the following elements (Figure 3-1):
Water resources management model
Basin development scenarios
Socio-economic scenarios
Climate scenarios
Hydrologic model (“HIS Drina”)
Water resources management model is a simulation tool in WEAP software that performs water balance
calculations and supports checking and evaluating the robustness of the water resources system. On the
supply side, this model uses the results of hydrologic simulations with climate scenarios from the JCI hydro-
logic model as the information on the natural hydrologic regime. On the demand side, the model uses
information on the requirements for municipal, industrial and agricultural water use, environmental flow
requirements and energy demand for hydropower facilities. The water resources management model
enables simulation of water allocation under various infrastructure configurations and under different
future developments (climate variability or other changes in the basin), thus supporting considerations of
modifications to planning and management of the system. The model development and implementation
for DRB is the subject of this report.
Basin development scenarios represent different sets of system configurations and management options
to reflect a range of possible developments in DRB. The scenarios are mainly related to the trade-off be-
tween environmental issues and hydropower development. Two opposite scenarios are Green Growth and
Hydropower Maximisation. The first one reflects absence of new hydropower facilities and more green
energy options (solar, wind). The latter reflects implementation of all planned hydropower facilities in the
basin. Several “mid-way” scenarios are also defined between the two opposite scenarios, depending on the
country (Table 3-1). The development scenarios are described in Chapter 4 of the IPF country reports [4].
Section 3.5.1 of this report discusses how the development scenarios are implemented in WEAP.
Basin development Socio-economic Climate
scenarios scenarios scenarios
Hydrologic model
Water management model – WEAP
Evaluation of options and scenarios
Figure 3-1: Modelling framework for developing the water management model for DRB.World Bank Drina Water Management Model in WEAP
Support to Water Resources Management in the Drina River Basin 9
Table 3-1: Development options for DRB (based on Chapter 4 of the IPF country reports [4]).
Montenegro BiH Serbia
Green Growth Green Growth Green Growth
Reduced Hydropower per Sava RBMP
Follows Energy Development Strategy Reduced Hydropower over longer time Reduced/Optimized Hydropower
frame
Hydropower Maximisation Hydropower Maximisation Hydropower Maximisation
Socio-economic scenarios are referred to population growth rate and the growth rates for industrial and
agricultural production, which would affect municipal, industrial and agricultural water use in the riparian
countries of DRB (see section 3.5.2 for assumed rates).
Climate scenarios are developed within this project with a goal to create plausible climate change tenden-
cies for precipitation and temperature in DRB. The scenarios consist of temperature and precipitation time
series simulated with an ensemble of global and regional climate models (GCM/RCM) under two IPCC
scenarios, RCP 4.5 and RCP 8.5 (see section 3.5.3). The methodology and the results of climate modelling
are described in detail in IWRM country reports [3] and in IPF country reports [4].
The simulated precipitation and temperature series under both climate scenarios are used as the input for
hydrologic simulations with the JCI hydrologic model in order to create hydrologic projections for the
basin. Knowledge on the tendencies in future climate and hydrology and uncertainties in these tendencies
enables examining and evaluating the robustness of the Drina water resources system under climatic and
hydrologic variability, thus supporting the sustainable water resources management. The hydrologic model
is described in IWRM country reports [3] and the results of hydrologic simulations with future climate are
described in Section 5.2 of the IPF country reports [4]. Hydrologic simulations with simulated climate re-
sulted in 12 different hydrologic data sets that supported simulations with the Drina WRM model (see
Table 3-2 and section 3.5.3).
3.2 Stages in model development
Main stages in developing the Drina WRM model in WEAP were:
1. Study area definition – setting time horizons
2. Definition of the system configuration and input data entry
3. Scenario development
4. Evaluation of results
These steps are explained in the subsequent subsections.
3.3 Time horizons and model versions
In a typical WEAP application, a water resources system model is built for a specific starting year (“Current
Accounts”) for which the system state is known. The starting year is also the first year of the reference
scenario and all other scenarios. In case of the DRB, choice of the starting year and the known system state
was driven by the constraints related to available data for climate and hydrologic simulations.
The climate change is assessed in this project for two future 30-year time frames, 2011-2040 and 2041-
2070, with 1961-1990 as the baseline (reference) period. The selected future time frames are typical in the
climate change impact studies because the climate change impacts can only be evaluated along time spans
of reasonable length for reliable statistical analysis. These time frames also cover the planning horizons
2020 and 2050 indicated in the Terms of Reference. On the other hand, the baseline period is chosenDrina Water Management Model in WEAP World Bank
10 Support to Water Resources Management in the Drina River Basin
having in mind availability of climatological data in the region (huge data gaps in 1990’s do not permit
selection of a longer baseline period, such as e.g. 1961-2010). Hydrologic simulations were also performed
for 1961-1990 and 2010-2070 time frames, but years 1961 and 2010 are not included due to the hydrologic
model warm-up.
To include the climate change scenarios and corresponding hydrologic simulations, two Drina WRM models
are developed: baseline model (1962-1990) and future model (2011-2070). The baseline WRM model con-
sists of the Current Accounts (with 1962 as starting year) and the Reference Scenario. The future WRM
model comprises the Current Accounts (starting from 2011) and five development scenarios (see Table 3-10
in section 3.5.1). It covers two 30-year periods (2011-2040 and 2041-2070) chosen to assess the climate
change impact on the hydrology and water allocation. The results of the baseline model serve to assess the
relative change in the future compared to the baseline period.
The time horizons and scenarios in WEAP are summarized in Table 3-2. The models that use hydrologic
simulations with climate input from the climate modelling have four versions, each pertaining to a different
climate modelling chain (see Table 3-13). The climate model outputs for the baseline period are the same
for two climate scenarios RCP 4.5 and RCP 8.5, but are different for the future period. Therefore, there are
four versions of the baseline WRM model and 8 versions of the future WRM model.
Monthly time step is selected for water balance computation as the seasonal variations in runoff and de-
mand are important for the system performance.
Table 3-2: Time horizons and management scenarios in two versions of the Drina WRM model in WEAP.
WEAP model version WEAP scenario Time Hydrologic input No. of model
horizons versions
Baseline Current Accounts 1962 Simulated hydrology 4
Drina WRM model Reference Scenario (Green Growth) 1963-1990 with simulated climate
Future Current Accounts 2011 4 for RCP 4.5
Drina WRM model Green Growth 2012-2070 4 for RCP 8.5
Middle 1, Middle 2, Middle 3 2012-2070
Full HPP 2012-2070World Bank Drina Water Management Model in WEAP Support to Water Resources Management in the Drina River Basin 11 3.4 System configuration and input data Configuration of the Drina WRM system is too complex to be presented graphically as a whole, but it is nevertheless shown in Figure 3-2. Figure 3-3 and Figure 3-4 present two details of the system (the Piva and Tara Rivers, and the Uvac River, respectively). Main components of the Drina WRM and data used to define these components are explained in the sub- sequent subsections. Necessary input data varies from one component to another. The model has been built with the available data gathered within this project and from various documents. Figure 3-2: Schematic of the Drina River Basin water resources system in WEAP.
Drina Water Management Model in WEAP                                                                                       World Bank
12                                                                       Support to Water Resources Management in the Drina River Basin

Figure 3-3: Detail of the schematic of the Drina River Basin water resources system in WEAP (Piva and Tara Rivers)

Figure 3-4: Detail of the schematic of the Drina River Basin water resources system in WEAP (Uvac River).
World Bank                                                                                       Drina Water Management Model in WEAP
Support to Water Resources Management in the Drina River Basin                                                                     13

3.4.1 Demand sites
Municipal, industrial and agricultural demand sites are included in the model. General approach was to
define one demand site of each type per municipality since information on water use can generally be
obtained for the municipalities. In some cases, demand sites are aggregated if they share same source or if
they are located within the same sub-basin (as defined in the hydrologic model). The model includes a total
of 35 domestic demand sites, 11 industrial demand sites, and 15 agriculture demand sites.

Table 3-3 lists main variables in WEAP related to demand sites, while tables in Appendix B show all input
data related to demand sites.

Table 3-3: Main variables in WEAP related to demand sites.

 Demand type          WEAP variables                 Description and comments
 Municipal water      Annual Activity Level          Number of inhabitants: population in portion of municipality within DRB or
 supply                                              number of people connected to public water supply systems.
                      Annual Water Use Rate          Specific water demand (per capita).
                      Monthly Variation              Intra-annual distribution of specific demand. Assumed.
                      Consumption                    % of inflow consumed (lost from the system); it defines return flow as
                                                     Inflow * (1 – Consumption). Estimated as percentage of population connected
                                                     to water supply system and using on-site sanitation.
                      Loss Rate                      Losses within the demand site.
 Industrial water     Annual Water Use Rate          Industrial water demand for each site.
 supply               Monthly Variation              Not considered (demand throughout a year considered uniform).
                      Consumption                    Percentage of inflow consumed (lost from the system). Assumed.
 Agricultural         Annual Activity Level          Size of the irrigated area. Estimated from Google Earth.
 water supply         Annual Water Use Rate          Specific irrigation water demand (volume per unit area).
                      Consumption                    Assumed to be 100% (no groundwater recharge from irrigated areas).

Domestic water demand for municipalities (listed in Table B-1 in Appendix B) is defined with population
connected to water supply systems and specific water demand. Only the population within the DRB is taken
into consideration, as presented in sections 7 of the IWRM country reports. Values of the specific demand
for each country (and both entities in BiH) are adopted in the IWRM country reports, and are declared as
Key Assumption variables (see section 3.4.11). Monthly variation has been assumed and also declared as
Key Assumption variable to be applied for all demand sites in all countries. The Consumption variable,
which is used to define water lost from the system, is assumed to be 15% according to the values common-
ly reported in literature and is defined in WEAP as a key assumption. Data on loss rates within the distribu-
tion system of a demand site is generally available for municipalities (based on data from public water
companies), except for Montenegro where a unique loss rate value was adopted based on information
about the general loss rate for the whole country.

Major industrial water demand in the basin comes from the thermal power plants, mine excavating and
ore processing, cement and alumina factories, as well as wood and food processing factories (Table B-2 in
Appendix B). Annual water use rates were estimated from various reports. Industrial demand is considered
constant throughout the year (no monthly variation) and the consumption percentage is assumed. The only
exception is the industry in the Pljevlja municipality, where detailed specification of water demand was
available, including monthly variation (Table B-3 in Appendix B). The parameters of the industrial water
demand in Serbia are estimated from information obtained from “JVP Srbijavode” and are given in Table
B-4 in Appendix B.

Agriculture water demand is assumed to be the greatest in the lower Drina basin. The agricultural areas in
this part of the basin are assigned to the sub-basins downstream of Kozluk in BiH and Serbia (Figure 3-5).
Drina Water Management Model in WEAP World Bank 14 Support to Water Resources Management in the Drina River Basin Additionally, two agricultural demand nodes in FBiH near Ustikolina and Goražde are included. Data on agricultural demand nodes are shown in Table B-5 in Appendix B. The extent of the agricultural areas in the lower Drina region is estimated from the satellite imagery (using Google Earth), while the areas of two sites in FBiH is taken from [23]. Irrigation water demand (i.e. annual water use rate) is adopted from strategic documents [5] [6]. Water used for irrigation is assumed to be lost from the system due to high evapotran- spiration losses. An alternative approach would be to link the agricultural areas with groundwater aquifers in WEAP and to employ an external groundwater modelling in order to provide proper groundwater bal- ance. However, due to lack of knowledge on groundwater within each sub-basin, this approach would be beyond the available time and resources in this project. Figure 3-5: Agriculture demand sites in the Drina WRM model. 3.4.2 Rivers Rivers included in the model are those where the important nodes (reservoirs, links to and from demand sites) are located. Beside the Drina main course, the following rivers are represented in the model: Tara, Komarnica, Piva, Ćehotina, Sutjeska, Bistrica (BiH), Lim, Uvac, Prača, Rakitnica, Rzav, Crni Rzav, Drinjača, Jadar and Janja. In addition, for the purpose of including the Buk Bijela pumped-storage HPP in the model, the Bjelava River is also included. There are no available hydrologic data for this river and it can also be considered inactive component. Each river is defined in WEAP starting from a specific node corresponding to a hydroprofile (sub-basin outlet) in the hydrologic model. The flow rate at that hydroprofile, simulated by the hydrologic model, is assigned as headflow for each river. See Appendix C for specification of river headflows. 3.4.3 Reservoirs A total of 24 reservoirs – 12 existing and 12planned – are included in the Drina WRM model (Table D-1 in Appendix D). Three existing reservoirs do not have associated HPPs (Radoinja, Ribnica and Snježnica). Two reservoirs represent upper reservoirs of the pumped-storage HPPs (existing reservoir Zaovine and planned
World Bank                                                                                          Drina Water Management Model in WEAP
Support to Water Resources Management in the Drina River Basin                                                                        15

reservoir of the PS-HPP Buk Bijela). The planned reservoirs and the corresponding HPPs are set not to be
active in Current Accounts. They are assigned different start-up years in the scenarios in which they are
included. Specific setup is made for the Otilovići reservoir on the Ćehotina River, which is the existing
reservoir, but its planned HPP is introduced into the system under “Middle 1” scenario later in the future.
This reservoir is therefore included in Current Accounts, but its hydropower variables are activated in the
starting year by using the Step function in WEAP (see first row in Table D-1 in Appendix D).

The model also includes three inactive reservoirs. These are three reservoirs on the Ćehotina River with
derivation-type HPPs (Gradac, Mekote and Falovići). These reservoirs and corresponding HPPs are not a
part of any development scenario, but are included in the model to be eventually used later by stakehold-
ers.

Table 3-4 presents WEAP variables related to reservoirs. They are categorized in four groups. Main physical
variables that describe the reservoirs are storage capacity and volume-elevation curves. The storage capac-
ity of the reservoirs in the Drina WRM model is set as the active reservoir volume. The volume-elevation
curves in the Drina WRM model are defined as the relationship between active reservoir volumes and
elevations (i.e. dead or inactive storage is not included). Data on the volume-elevation curves were availa-
ble for a number of existing reservoirs and a smaller number of planned reservoirs. For the reservoirs with
no available volume-elevation curves, a linear relationship was assumed between the minimum and maxi-
mum operating levels and corresponding volumes. The volume-elevation curves as given in WEAP are
shown in table D-2 in Appendix D.

Operation of the reservoirs can be controlled in WEAP with a number of variables defining characteristic
elevations and volumes (see second group of variables in Table 3-4). As the reservoir capacities In the Drina
WRM model are set as the active volumes, this group of variables is used with default values in the model.

Table 3-4: Main variables in WEAP related to reservoirs.

 WEAP variables                                    Description/Comment
 Reservoirs –      Storage capacity                Reservoir total volume. Specified as active volume.
 Physical          Initial Storage                 Full reservoirs assumed.
                   Volume-elevation curve          See explanations in the text
                   Net evaporation                 Evaporation minus precipitation (negative values indicate increase in water).
                                                   Not considered.
                   Maximum Hydraulic               Hydraulic constraints. No constraint assumed.
                   Outflow
                   Loss to Groundwater             Positive for seepage, negative for net gain from groundwater. Not considered.
 Reservoirs –      Top of Conservation             Maximum volume in reservoir. Default = Storage Capacity.
 Operation         Top of Buffer                   Volume in reservoir below which releases are constrained by the Buffer
                                                   Coefficient. Default = Top of Inactive.
                   Top of Inactive                 Volume in reservoir not available for allocation. If Storage Capacity is only the
                                                   active volume capacity, then Top of Inactive = 0.
                   Buffer Coefficient              Fraction of volume in buffer zone (below Top of Buffer) available for release.
                                                   Default = 1.
 Reservoirs –      Max. Turbine Flow               Installed turbine capacity.
 Hydropower        Tailwater Elevation             Needed to calculate working water head.
                   Generating Efficiency           KKD Coefficient of plant efficiency. Default = 100%.
                   Hydropower Priority             Priority with which Energy Demand will be satisfied (no priority = 0, highest
                                                   priority = 99).
                   Energy demand                   Hydropower production requirements.
 Reservoirs –      Priority                        Reservoir-filling priority (highest priority = 1, lowest priority = 99).
 Priority
Drina Water Management Model in WEAP World Bank
16 Support to Water Resources Management in the Drina River Basin
For all reservoirs with associated HPPs, data is needed for the Hydropower group of variables. Data on
installed turbine capacity, tailwater elevation and generating efficiency are essential for operation of HPPs
in WEAP. Tailwater elevation is specified as a fixed value for all dam-type HPPs except the Piva and Sutjeska
reservoirs, where it is set that tailwater elevation depends on the elevation in the reservoir. For example,
the following formula is used for the Piva reservoir:
If(PrevTSValue(Storage Elevation[m])-492.61>=162, PrevTSValue(Storage Elevation[m])-162, 492.61)
where 492.61 represents calculated/design tailwater elevation and 162 is the rated head (in meters). Gen-
erating efficiency is calculated based on installed power, installed discharge and net head. Calculated
generated efficiency for several planned HPPs did not make sense (e.g. it was > 1) and it was set to value of
0.85.
The model is built having in mind that most existing reservoirs operate without considerable storage ef-
fects, except for the Piva reservoir that can have significant storage effects. One of the main obstacles in
modelling is lack of information on the energy demand, which, in combination with hydrologic input, drives
the seasonal or even longer-term storage effects. Without energy demand specified in WEAP, reservoir-
type HPPs operate as run-of-river HPPs. The energy demand is therefore specified in the model for the Piva
HPP, Buk Bijela PS-HPP, Sutjeska HPP, Višegrad HPP, Bajina Bašta PS-HPP, Uvac HPP and the system com-
prised of Kokin Brod and Bistrica HPPs. In this last case, so called Hydropower System Demand is specified
(Table E-4 in Appendix E) in order to provide joint demand for operation of these two HPPs.
Operation of the reservoirs and their associated HPPs is also governed by the priorities in the system. Two
types of priorities are related to the reservoirs (Table 3-4): reservoir-filling priority (which also related to
priorities of satisfying downstream flow requirements) and hydropower priority to satisfy energy demand.
In Drina WRM model, these priorities are set for several reservoirs and HPPs in order to get realistic results
(see Table D-1 in Appendix D).
3.4.4 Run-of-river hydropower plants
The criterion for defining a HPP as run-of-river (ROR) type was that its storage could be emptied with the
installed turbine capacity flow within less than 2 hours. In addition to the conventional ROR HPPs located
on the rivers, the derivation-type HPPs are also represented in WEAP by the ROR HPP located on the diver-
sion components.
As a result, a total of 15 ROR HPPs (2 existing and 13 planned) are included in the Drina WRM model.
Among them, Bistrica (existing) and Sutjeska (planned) HPPs are the derivation-type HPPs. Three deriva-
tion-type HPPs (Gradac, Mekote and Falovići) on the Ćehotina River are also included in the model as inac-
tive components to be eventually used later. Two ROR HPPs are defined on the diversion link from the
upper to lower reservoirs of the Bajina Bašta and Buk Bijela pumped-storage HPPs.
The planned HPPs are generally set not to be active in Current Accounts and they are assigned different
start-up years in the scenarios in which they are included.
Main variables related to ROR HPPs are shown in Table 3-5. Most are the same as for dam-type HPPs,
except that Fixed Head is used instead of variable one (see Appendix E for data on ROR HPPs). The net fixed
head is specified for ordinary ROR HPPs, while it is estimated for the derivation-type HPPs as the difference
between the reservoir elevation in the previous time step and calculated tailwater elevation:
Net Head = Current Storage Elevation – Tailwater Elevation
where the tailwater elevation is calculated from:You can also read