ECONOMIC OUTLOOK 2018-2022
←
→
Page content transcription
If your browser does not render page correctly, please read the page content below

WEST VIRGINIA

ECONOMIC
 OUTLOOK 2018-2022

SPECIAL THANKS TO THE 2017 ECONOMIC OUTLOOK CONFERENCE SPONSORS:

CHAMBERS ENDOWED
   PROGRAM FOR
ELECTRONIC BUSINESS

                                                  WEST VIRGINIA
                                                 DEPARTMENT OF
                                                    REVENUE
2018-2022

    WEST VIRGINIA
ECONOMIC
 OUTLOOK
            West Virginia Economic Outlook 2018-2022 is published by:
                     Bureau of Business & Economic Research
            West Virginia University College of Business and Economics
                      Javier Reyes, Ph.D., Milan Puskar Dean

                         P.O. Box 6527, Morgantown, WV 26506-6527
                           (304) 293-7831 | bebureau@mail.wvu.edu

WRITTEN BY THE BUREAU OF BUSINESS AND ECONOMIC RESEARCH

       John Deskins, Ph.D. | Director and Associate Professor of Economics

                     Eric Bowen, Ph.D. | Research Assistant Professor

                  Christiadi, Ph.D. | Research Associate, Demographer

                          Brian Lego | Research Assistant Professor

                            Melissa McKenzie | Research Assistant

                        Justin Parker | Graduate Research Assistant

                       Ananya Sarker | Graduate Research Assistant

                              Fani Agelaraki | Research Assistant

                             EXPERT OPINION PROVIDED BY

Mark Muchow | Deputy Cabinet Secretary, West Virginia Department of Revenue

  Publication Design by Erica Lindsay | Cover Photo by Alex Wilson | Copyright ©2017 by WVU Research Corporation
ii | WEST VIRGINIA ECONOMIC OUTLOOK 2018-2022

                                                                  Greetings!
                                                                  I am happy to present the 2018-2022 West
                                                                  Virginia Economic Outlook to you. My intent is
                                                                  for this document to serve as a thorough and
                                                                  rigorous reference for where our state’s economy
                                                                  is today and where it is likely heading in coming
                                                                  years. And my sincere hope is that you will find
                                                                  this document useful as you lead your business,
                                                                  government agency, or community organization
                                                                  through the economic opportunities and
                                                                  challenges we face in West Virginia.

                             Since the 1940s, our mission here at the Bureau of Business & Economic Research,
                             a unit within WVU’s College of Business & Economics, has been to serve the people
                             of West Virginia by providing you, the state’s business, policymaking, and advocacy
                             communities, with reliable and timely data as well as rigorous applied economic
                             analysis. We hope that the data and analysis we provide ultimately enables you to
                             design and implement better business practices and public policies.

                             Our research is sponsored by public- and private-sector clients throughout West
                             Virginia and nationally. For instance, our recent public-sector clients include the
                             West Virginia Legislature, the West Virginia Department of Revenue, the West
                             Virginia Higher Education Policy Commission, the American Cancer Society, and the
                             Appalachian Regional Commission. We have also been engaged by several private-
                             sector companies in the state.

                             Please feel free to call on me personally anytime concerning your economic
                             research needs. We are always interested in pursuing new opportunities to provide
                             research and data in areas such as public policy analysis, health economics,
                             energy economics, economic development, economic impact analysis, economic
                             forecasting, tourism and leisure economics, and education policy, among others.

                             To learn more about our research, to find contact information for myself or any of
                             our staff, or to find an electronic version of this document, please visit our website at
                             business.wvu.edu/bber.

                             Sincerely,

                             John Deskins
                             Assistant Dean for Outreach and Engagement
                             Director, Bureau of Business & Economic Research
                             Associate Professor of Economics
                             WVU College of Business and Economics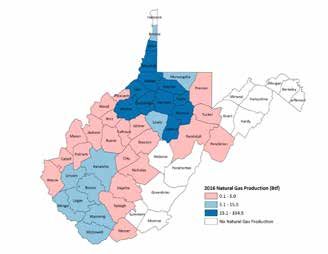
Table of Contents and List of Figures | iii

Table of Contents
EXECUTIVE SUMMARY                                               1
CHAPTER 1: THE UNITED STATES ECONOMY                            3
Overview                                                        3
Recent Trends and Short-Term Economic Outlook                   3
Challenges Facing the US Economy                                7
CHAPTER 2: THE WEST VIRGINIA ECONOMY                           12
Recent Economic Performance                                    12
Recent Demographic Trends                                      17
West Virginia Outlook                                          18
West Virginia’s Exports                                        22
CHAPTER 3: WEST VIRGINIA’S ECONOMY, INDUSTRY FOCUS             25
Energy                                                         25
Manufacturing                                                  30
Construction                                                   32
Health and Health Care in West Virginia                        35
CHAPTER 4: GOVERNMENT IN WEST VIRGINIA                         38
West Virginia Government                                       38
Public Assistance in West Virginia                             39
Guest Insight: West Virginia Fiscal Forecast                   42
CHAPTER 5: WEST VIRGINIA’S COUNTIES                            44
CHAPTER 6: SMALL BUSINESS ACTIVITY IN WEST VIRGINIA            46
Small Business Births and Deaths                               46
Small Business Employment                                      47
Small Business Income                                          48
APPENDIX – WORKS CITED                                         50
iv | WEST VIRGINIA ECONOMIC OUTLOOK 2018-2022

    List of Figures
    EXECUTIVE SUMMARY                                           Figure 2.10: Real GDP Growth (2)                 17
     Figure ES.1: WV and US Forecast Summary               1    Figure 2.11: Total Population                    17
    CHAPTER 1: THE UNITED STATES ECONOMY                        Figure 2.12: Summary Population Profiles         17
     Figure 1.1: US Real GDP Growth                        3    Figure 2.13: All-Cause Mortality Rates           18
     Figure 1.2: Growth in Output per                           Figure 2.14: Employment Growth Forecast          18
     Hour in Nonfarm Business                              4
                                                                Figure 2.15: WV Employment
     Figure 1.3: Growth in US Government Spending          4    Growth Forecast by Sector                        18
     Figure 1.4: US Total Employment                       5    Figure 2.16: Unemployment Rate Forecast          20
     Figure 1.5: US Unemployment Statistics (1)            5    Figure 2.17: Forecast Growth by Major Source
     Figure 1.6: US Unemployment Statistics (2)            6    of Real Personal Income, 2017-2022               21

     Figure 1.7: US Labor Force Participation Rate         6    Figure 2.18: Share of Personal
                                                                Income by Component                              21
     Figure 1.8: US Housing Starts                         7
                                                                Figure 2.19: WV Per Capita Personal Income
     Figure 1.9: Consumer Confidence                       7    Relative to US Average                           21
     Figure 1.10: Real GDP Growth - Select Economies       7    Figure 2.20: GDP Forecast by Sector              22
     Figure 1.11: World GDP by Country                     8    Figure 2.21: WV Population Growth by Age Group   22
     Figure 1.12: US Federal Debt Held by the                   Figure 2.22: WV Exports                          22
     Public as a Share of GDP                              8
                                                                Figure 2.23: WV Top Five Exporting Industries    23
     Figure 1.13: Federal Deficit Share of GDP             8
                                                                Figure 2.24: Top Ten Export Commodities, 2016    23
     Figure 1.14: US Transfer Payments
     as a Share of Personal Income                         9    Figure 2.25: Top Destination Countries
                                                                for West Virginia Exports                        24
     Figure 1.15: Components of US
     Federal Government Spending                           9   CHAPTER 3: WEST VIRGINIA’S ECONOMY,
                                                               INDUSTRY FOCUS
     Figure 1.16: US Personal Savings
     as Share of Disposable Income                         9    Figure 3.1: WV Energy Sector Employment          25

     Figure 1.17: US Inflation Rates                      10    Figure 3.2: WV Coal and Natural Gas Output       25

     Figure 1.18: Select US Interest Rates                10    Figure 3.3: WV Regional Coal Production          26

     Figure 1.19: Share of Aggregate Income by Quintile   10    Figure 3.4: Average Coal Mining Productivity     26

     Figure 1.20: Income Gap                              11    Figure 3.5: Energy Commodity Exports from WV     27

    CHAPTER 2: THE WEST VIRGINIA ECONOMY                        Figure 3.6: Natural Gas Production
                                                                in Marcellus/Utica States                        27
     Figure 2.1: Total Employment                         12
                                                                Figure 3.7: Natural Gas Production by County     27
     Figure 2.2: Economic Growth in WV and
     Adjacent States, 2012Q1-2017Q2                       12    Figure 3.8: Marcellus and Henry Hub
                                                                Natural Gas Spot Price Spread                    28
     Figure 2.3: WV Employment Distribution
     by Sector (2016)                                     13    Figure 3.9: Share of US Electric Power
                                                                Generation by Fuel Type                          28
     Figure 2.4: Unemployment Rate                        15
                                                                Figure 3.10: Coal and Natural Gas Fuel
     Figure 2.5: Labor Force Participation Rate (2015)    15    Price Ratio Paid by Utilities                    28
     Figure 2.6: Per Capita Personal Income Growth        15    Figure 3.11: Share of Total
     Figure 2.7: Per Capita Personal Income (2016)        16    Manufacturing Employment (2016)                  30

     Figure 2.8: Average Annual Salary by Sector (2016)   16    Figure 3.12: WV Manufacturing
                                                                Employment by Industry                           30
     Figure 2.9: Real GDP Growth (1)                      16
| v
Figure 3.13: WV Manufacturing Industry CHAPTER 5: WEST VIRGINIA’S COUNTIES
Employment Growth Forecast 31
Figure 5.1: Annual Population Growth, 2006-2016 44
Figure 3.14: WV Manufacturing Sector Productivity 32
Figure 5.2: Forecast Annual
Figure 3.15: WV Construction Employment by Type 33 Population Growth, 2017-2022 44
Figure 3.16: WV Single-Family Housing Starts 33 Figure 5.3: Annual Employment Growth, 2006-2016 44
Figure 3.17: Single-Family House Figure 5.4: Forecast Annual
Price Growth by Metro Area 34 Employment Growth, 2017-2022 44
Figure 3.18: WV Single-Family House Prices 34 Figure 5.5: Annual Real Personal
Income Growth, 2006-2016 45
Figure 3.19: Healthcare Sector Employment 35
Figure 5.6: Forecast Real Personal
Figure 3.20: WV Healthcare Sector Employment
Income Growth, 2017-2022 45
and Wages (2016) 36
Figure 5.7: WV County Real per Capita Income 45
Figure 3.21: Health Behavior Statistics, 2016 36
CHAPTER 6: SMALL BUSINESS ACTIVITY
Figure 3.22: Health Statistics Measures, 2016 36
IN WEST VIRGINIA
CHAPTER 4: GOVERNMENT IN WEST VIRGINIA
Figure 6.1: WV Small Business Births and Deaths 46
Figure 4.1: State and Local Government
Figure 6.2: Small Business Net Growth 46
Expenditure per Capita, 2014 38
Figure 6.3: Small Businesses per
Figure 4.2: State and Local Government Expenditure
100,000 Residents, 2014 46
as Share of Personal Income, 2014 38
Figure 6.4: Growth in Small
Figure 4.3: WV State and Local Government
Business Counts, 2003-2014 47
Expenditure Composition, 2014 38
Figure 6.5: Employment in WV by
Figure 4.4: Real State and Local Government
Employer Type, 2014 47
Expenditures per Capita 39
Figure 6.6: Small Business Employment Share, 2014 47
Figure 4.5: State and Local Government Own
Source Revenue per Capita, 2014 39 Figure 6.7: WV Employment by
Small Business Size, 2014 48
Figure 4.6: WV State and Local Government
Revenue Composition, 2014 39 Figure 6.8: Employment Change Between
2003 and 2014 by Business Size 48
Figure 4.7: State Government Spending as a Share
of Total State and Local Expenditures, 2015 40 Figure 6.9: Wage and Salaries in WV
by Employer Type, 2014 48
Figure 4.8: Transfer Payments as
a Share of Personal Income 40 Figure 6.10: Share of Total Wages and Salaries
by Small Businesses, 2014 49
Figure 4.9: Distribution of Transfer of
Payments by Program, WV 40 Figure 6.11: Patents Issued per 100,000
Residents, 2012-2015 49
Figure 4.10: Distribution of Transfer of
Payments by Program, US 40 Figure 6.12: Loans Under $100,000
Issued for Small Business 49
Figure 4.11: Participation in Transfer
Programs in WV, 2015 41
Figure 4.12: Participation in Transfer Programs, 2015 41
Figure 4.13: Average Weekly Duration
Collecting Unemployment Insurance 41
Figure 4.14: Average Weekly
Unemployment Insurance Benefits 41vi | WEST VIRGINIA ECONOMIC OUTLOOK 2018-2022
Executive Summary | 1
Executive Summary
After several years of economic hardship, West Vir- FIGURE ES.1: West Virginia and US Forecast Summary
ginia’s economy hit bottom in 2016 and has grown over
the past few quarters. The state’s employment declines
West Virginia United States
were primarily driven by losses in both major segments
of the energy sector, but the turnaround has also been 2006-2016 2017-2022 2006-2016 2017-2022
driven by expanding coal production and renewed Population
0.0 0.0 0.8 0.8
growth in natural gas production. However, the pace of (average annual growth, %)
employment growth that is expected in coming years Employment
-0.2 0.7 0.6 0.9
will mean that West Virginia will not likely return to its (average annual growth, %)
2012 level of employment for four more years. Real GDP
1.3 1.0 1.3 2.3
(average annual growth, %)
In this report we present a detailed discussion of the Unemployment Rate
current state of the West Virginia economy along with (annual average at end 6.0 4.5 4.9 4.3
our forecast for the likely path of economic activity of time period, %)
over the next five years. Overall, this report provides a Real Per Capita Personal
broad and detailed foundation to aid in understanding Income (average annual 1.1 1.8 1.0 2.1
the long-run economic challenges and opportunities growth, %)
facing West Virginia. Sources: US Census Bureau; US Bureau of Labor Statistics; US Bureau of Economic Analysis;
WVU BBER Econometric Model; IHS Markit
Highlights related to West Virginia’s recent
economic performance are as follows:
The state experienced a large loss in jobs growth has lagged the national average in recent
between early-2012 and late-2016, with a cumu- years, leaving the per capita income level in West
lative decline of roughly 26,000 jobs over that Virginia at roughly 75 percent of the national figure.
period. On a positive note, total employment has
increased during the first two quarters of 2017, hint- West Virginia’s real gross domestic product
ing at broader signs of stability and improvement for declined in 2015 and 2016, but has increased at
most of the state’s economic regions. a rapid pace over the past few quarters. Changes
in the state’s total economic output have been vola-
A significant portion of economic turmoil experi- tile since 2012, reflecting the turbulence within the
enced in West Virginia over the past few years can state’s coal and natural gas industries.
be traced to both major segments of the state’s
energy sector. Job gains have been recorded in a Export activity from West Virginia has also experi-
few service-providing sectors, such as education enced significant volatility during the past decade.
and health services, but many other industries in the Promoting the state’s export potential is of vital
state struggled in 2015 and 2016. importance to economic development in West
Virginia in the long run.
After falling within a range of 6.5 and 7.0 percent
between late-2013 and late-2015, the state’s The energy sector is an important driver of
unemployment rate has fallen sharply in recent economic activity in the state:
quarters. West Virginia’s jobless rate fell to its low-
Coal output fell by nearly one-half between 2008
est level in nearly a decade during the second quar-
and 2016, with most of those losses occurring in
ter of 2017, reaching just over 4.6 percent.
the state’s southern coalfields.
Only 53 percent of West Virginia’s adult popula-
After increasing rapidly in the first half of the
tion is either working or looking for work. This is
decade, natural gas output increased by just 4
the lowest rate of labor force participation among
percent during 2016.
all 50 states. This problem represents a significant
hurdle for long-run economic prosperity. Total GDP from the state’s natural gas industry is
expected to equal that of coal within the next few
Per capita personal income in West Virginia grew
years. GDP from natural gas was equivalent to
at rate of 1.5 percent in 2016, climbing to approxi-
roughly one-tenth of coal’s real output less than
mately $37,400. The state’s per capita income
a decade ago.2 | WEST VIRGINIA ECONOMIC OUTLOOK 2018-2022
Highlights related to West Virginia’s economic revisions. Changes in the labor force participation
outlook are as follows: rate will provide a better picture of labor market con-
ditions going forward.
Employment in West Virginia is estimated to
increase nearly 0.7 percent per year on aver- Per capita personal income is expected to grow
age through 2022, trailing the 0.9 percent average at an annual average rate of 1.8 percent over
annual growth expected for the nation as a whole. the next five years, below the national rate of 2.3
Total employment is not expected to return to its percent. Growth will be driven largely by non-wage
2012 peak until 2021. income, such as Social Security benefits.
Our baseline forecast calls for the recent upturn A key concern for The Mountain State
in coal production and jobs to come to an end as moving forward relates to its underlying
the industry enters a period of relative stability; demographics. Consider the following:
however, the industry’s outlook still remains sub-
ject to considerable downside risk due to linger- West Virginia’s population has declined by more
ing uncertainty related to coal use by domestic than 25,000 people since 2012, and although we
power plants and future global demand for ther- expect the state’s population to stabilize, more
mal and met coal. losses are likely over the longer term due to large
share of elderly residents and the effects of poor
Rising domestic demand, increased LNG health outcomes and behaviors for many seg-
exports and enhancements in regional pipeline ments of the overall population.
networks bode well for West Virginia’s natural
gas industry during the outlook period. Overall, A positive shock to encourage in-migration is
production and employment are expected to gain essential to lessen the severity of natural popula-
momentum over the next few years. Longer term, tion decline.
the emergence of downstream processing facilities
Economic development strategies should focus
in Pennsylvania, and perhaps Ohio, raise prospects
on ways to improve health and education out-
for continued growth.
comes in the state to make West Virginia’s work-
Construction is expected to rebound from its force more attractive to potential businesses.
malaise of the past few years, thanks in large part
Economic performance is expected to remain
to residential and commercial building activity in the
extremely variable across West Virginia’s
state’s economic growth centers. A range of energy-
counties. Consider the following:
and transportation-related infrastructure projects is
also expected to lift the sector’s prospects. While the state overall is expected to lose popula-
tion in coming years, a limited number of counties
Manufacturing payrolls are expected to register
will add residents during the outlook period.
gains of 0.9 percent annually over the next five
Population gains will tend to be most heavily con-
years, though most of this growth will likely come
centrated in North-Central West Virginia and the
from the opening of two major facilities in the East-
Eastern Panhandle.
ern Panhandle.
Many of the counties in southern West Virginia
Service-providing sectors will grow more slowly
that were plagued with deep losses over the past
as a whole going forward, although professional
several years will enjoy some measurable job
and business services should see stronger gains
growth during the outlook period. At the same
related to the increased hiring of contract labor by
time, most of these areas will likely struggle to see
the coal and natural gas industries.
the level of economic activity return to what was
The state’s unemployment rate is expected to observed in years as recent as 2014 or 2015.
hover in the mid-4 percent range for the next sev-
Just as with population, most of West Virginia’s job
eral quarters, but slowly begin to decline through
and output growth will tend to come from coun-
the early 2020s.
ties located in the northern half of the state.
However, West Virginia’s unemployment rate pro-
Policymakers should be keenly aware of signifi-
vides an incomplete and potentially misleading
cant economic differences across West Virginia
indication of labor market condition due to the
and ensure that economic development strate-
state’s underlying demographic characteristics
gies consider each region’s specific strengths
as well as the measure’s susceptibility to large
and weaknesses.The United States Economy | 3
CHAPTER 1:
The United States Economy
OVERVIEW
The United States economy remains in a relatively FIGURE 1.1: United States Real GDP Growth
steady period of economic growth seven years after
% Change, Year Over Year
the end of the Great Recession; however, it appears 5%
that the economy’s long-run rate of growth has fallen 4%
by around one-third in recent years.1 As such, the
3%
recent economic recovery ultimately proved to be the 30-Year Average
most lethargic, by most measures, of any US eco- 2%
nomic recovery in the post-World War II era. Overall, 1%
we expect this modest and steady growth to continue
0%
for the coming years. In this chapter we: a) explore
recent trends in the United States economy; b) provide -1%
a forecast of how the US economy is likely to evolve -2%
over the near-term; and c) explore several major chal-
-3%
lenges that have the potential to threaten US economic
stability and could alter the outlook. -4%
-5%
RECENT TRENDS AND SHORT-TERM
ECONOMIC OUTLOOK Sources: : US Bureau of Economic Analysis; IHS Markit.
GDP As illustrated in Figure 1.1, economic output, as Note: Quarterly GDP data used. Figure is adjusted for inflation, presented here in 2009 $.
measured by real Gross Domestic Product (GDP), has
grown at an average annual rate of around 2.2 percent
since the Great Recession ended in mid-2009, notice- reduction in household debt levels (which leaves less
ably weaker than the 2.5 percent per year averaged room for consumer goods), tight bank lending stan-
since 1987. Generally speaking, the US economy has dards, weak house price appreciation, and low con-
undergone a long-run structural change such that eco- sumer confidence—have largely or completely abated.
nomic growth since the Great Recession is now only This moderate improvement in consumer spending
slightly more than two thirds of what was observed if has buoyed the economy to some degree, it will not
one focuses on the 30 years prior to the Great Reces- likely enhance the overall pace of economic expan-
sion’s onset, and even less if one broadens the time sion in the foreseeable future. In short, given the high
horizon to the entire post-WWII era. degree of relative stability in consumption, efforts to
promote economic growth should generally focus on
US economic growth has been slow enough such that other components of spending, such as investment.
real GDP did not return to its long-run potential level
until 2016, around seven years after the Great Reces- INVESTMENT Spending on investment goods—capi-
sion ended and much longer than any recovery has tal goods that will enhance future productivity, such as
taken in the post-World War II era. Many questions industrial facilities and equipment—has been far more
remain around the causes of this long-run slowdown volatile over the recent business cycle. Total investment
in economic growth, some of which we address below. spending collapsed at an annualized rate of more than
After a first half of 2017 that has been consistent 20 percent at the nadir of the recent recession before
with recent averages, real GDP growth is expected staging a strong recovery over much of 2010 through
to accelerate moderately through 2018. Overall, our 2012. Since that point, however, growth in investment
forecast calls for growth to remain mostly below the spending has been more modest and was especially
30-year average during the five-year forecast period. weak in 2016, due in large part to sharp capital spend-
ing reductions by energy companies in the face of low
CONSUMPTION Spending on consumer goods and crude oil and natural gas prices. Investment activity is
services, which is by far the largest component of GDP, expected to return to a healthier growth rate of nearly
has shown a great deal of relative stability over recent 4 percent annually through 2022 and is looked to as 1. This section represents
the authors’ review,
years, as is typically the case. While the rate of growth a modest potential source of future economic growth. analysis, interpretation,
in consumer spending did fall short of the rate that However, consistent with its volatile nature, capital and summary of
information presented in
prevailed before the recession for several years dur- investment activity is uncertain, and there are potential the International Monetary
ing the recovery, gains are now more consistent with obstacles that could jeopardize businesses’ willing- Fund’s World Economic
Outlook (2017) and IHS
pre-recession norms. Several factors that have sup- ness to pursue their investment plans as expected. We Markit’ US Economic
pressed consumer spending in recent years—such as discuss several of these major concerns below. Outlook (2017).4 | WEST VIRGINIA ECONOMIC OUTLOOK 2018-2022
NET EXPORTS US net exports (exports minus Much of the recent volatility in exports has been driven
imports), while a relatively small share of total output, by weak economic growth in important US export
have been nonetheless an important contributor to markets, especially in the European Union, where
the volatility in GDP over recent years and are another economic output has not improved by any significant
potentially important source of future economic growth. measure over its 2007 level and in China, where growth
Net exports have shown extreme volatility over the has slowed considerably. Movements in global energy
past several years. The value of total US net exports markets has also been an important contributor in sev-
collapsed at an annualized rate of nearly 30 percent eral ways. Unfortunately, in the same vein as invest-
during the pit of the recent recession, improved to ment activity, the health of US net exports is uncertain
around 15 percent growth in 2010, fell again from 2011 given the myriad sources of potential economic pres-
through 2013, and have grown since 2014, reaching sure across the world, such as the ongoing economic
a rate of more than 20 percent in 2015 before return- struggles in Europe, a continuing economic slowdown
ing to around 4 percent in 2016. Net export growth in China, sluggish economic growth in Japan, and
is expected to come in at around 8 percent in 2017, political unrest in many other parts of the world.
improve over the following two years, and then slow
again during the latter part of the forecast period. PRODUCTIVITY Worker productivity, as measured
by output per hour worked, is the fundamental key
driver of economic prosperity over the long run. For
instance, very high levels of productivity fundamentally
FIGURE 1.2: Growth in Output per Hour in Nonfarm Business explain why nations such as the US and UK enjoy high
standards of living while very low levels of productivity
% Change, 3 year average annualized growth
4.5 explain why nations such as Haiti and Zimbabwe suf-
4.0
fer extremely low standards of living. In Figure 1.2 we
illustrate the intermediate-run growth in productivity in
3.5 the US over the last two decades or so. As illustrated,
3.0 productivity growth has been has been extremely low
since 2013 and this weak rate of productivity growth is
2.5
expected to continue through around 2018. The ques-
2.0 tion of what drives this low productivity figure is hotly
debated among economists and policymakers today.
1.5
1.0 GOVERNMENT SPENDING The recent evolution of
0.5 government spending in the US is reported in Figure
1.3. Total federal, state, and local government spend-
0.0
ing, which amounts to approximately one-third of US
GDP, increased substantially during the recession.
Sources: US Bureau of Labor Statistics; IHS Markit. This rise was driven by a concerted economic stimulus
effort that actively increased government spending
FIGURE 1.3: Growth in United States Government Spending and as safety net expenditures rose naturally as the
economy went into recession. After the economic
% Change, Year Over Year
8 recovery began, inflation-adjusted federal government
spending decelerated rapidly and started to decline
6 Federal Spending
outright, reaching an annual drop of nearly 6 percent
by 2013. Real federal government spending did rise
4 in 2016, but the forecast calls for slight year-to-year
declines throughout the outlook period.
2
This removal of government spending held down
0
broader economic growth to some degree, since much
-2
of government spending is itself part of GDP (GDP
State & Local
Spending includes government spending on goods and services
-4 such as infrastructure spending, education, police
protection, etc.; GDP excludes government spending
-6 on transfer programs, such as Social Security). Much
of the decline in federal spending has come as federal
Source: US Bureau of Economic Analysis; IHS Markit.
government transfer payments waned as an improving
Note: Figure is adjusted for inflation, presented here in 2009 $. economy reduced unemployment rolls, but also due toThe United States Economy | 5
the effects of federal budget sequestration policies. By It is worth noting that the share of all unemployed
comparison, real state and local government spending persons who have endured long unemployment spells
began rising by 2014 and will likely continue to grow (typically defined as 27 weeks or more) rose substan-
over the forecast period. However, state and local gov- tially during the recent recession, and remains at a level
ernment expenditures should more slowly than overall that is still above the historic average. As illustrated,
GDP, indicating spending by state and local govern- the share of all unemployed persons who have experi-
ments will account for a proportionately smaller part of enced long unemployment spells rose from 17 percent
the nation’s economy during the outlook period. of unemployed persons in 2007 to nearly 45 percent
by 2010, and remains at around 23 percent. However,
EMPLOYMENT Job growth was sluggish through as illustrated, the figure has improved dramatically in
much of the economic recovery. It is not uncommon recent years.
for employment to recover more slowly than output, as
businesses typically increase output through eliminat- There are two common criticisms associated with the
ing excess capacity, through capital investment, and conventional unemployment rate reported in Figure
through increasing worker hours, before adding new 1.5. The first is that the figure does not account for
workers. However, employment has become increas- workers who can only find part-time work but who
ingly slow to recover in each of the last several busi- would prefer a full-time opportunity, often referred to
ness cycles: employment growth in each recession of
the past two decades—in the early-1990s, the early-
2000s, and through the recent cycle—has progressively FIGURE 1.4: United States Total Employment
Employment (Millions)
slowed compared to earlier post-WWII recessions. 165
160
As depicted in Figure 1.4, total US employment from
the household survey fell substantially during the 155
recent recession, with losses in excess of 7 million Full Employment
jobs. Employment growth since early-2010 has been 150
slow such that, the US did not achieve its pre-reces-
145
sion peak until late-2014.2 Furthermore, the degree
to which the US economy deviated from what is 140
considered a full and sustainable level of employment
135 Total Employment
(termed “full employment” in Figure 1.4) was the most
severe of any recession since the Great Depression. In 130
fact, the US economy only reached full employment in
2016, around seven years after job growth began. On 125
a positive note, employment growth for the nation as
a whole has been consistently solid since the begin- Sources: US Bureau of Labor Statistics; IHS Markit
ning of 2014, with the addition of around 215 thousand
jobs in a typical month. We expect employment growth
FIGURE 1.5: United States Unemployment Statistics
to continue for the coming years, though the average
pace will be slower reflecting the economy’s current 12
Unemployment Rate, % Unemployed 27 Weeks or More, % of Total Unemployment
50
position in the business cycle.
45
10
UNEMPLOYMENT Turning to the unemploy-
40
ment situation, as noted in Figure 1.5, the national
8
unemployment rate peaked at around 10 percent in 35
late-2009. This was the second-highest jobless rate Unemployment Rate
experienced during the post-WWII era, exceeded only 6 30
by the 1982/1983 recession (a peak of 10.8 percent
25
in late-1982). The unemployment rate has improved 4
substantially over the past five years and now stands 20
even slightly below its long-run level of around four- 2
and-one-half to five percent. The figure is forecast to 15
Unemployed 27
remain at this long-run level over the next five years. Weeks or More
0 10
2. The statement that employment in the US economy is approximately equal to its Source: US Bureau of Labor Statistics; IHS Markit
2007 high does not account for population growth over the period; doing so would Note: Quarterly data used.
darken the employment growth figure.6 | WEST VIRGINIA ECONOMIC OUTLOOK 2018-2022
as “under-employed.” The second relates to discour- includes workers who are only able to find part-time
aged workers. Here, the idea is that if one is looking work for economic reasons (U-6). It is important to
for work for an extended period of time and is ulti- note that these criticisms are legitimate and that what
mately unsuccessful at landing a job, the individual many would consider to be “true” unemployment is
may become discouraged and quit looking for work higher than the conventional statistic indicates. How-
altogether. When this happens, the person is no longer ever, it is also important to note that the movement
counted as “unemployed” or part of the labor force at of the three figures over time is quite consistent and
all by the conventional measure, since the conventional despite their level differences, the unemployment situ-
measure only considers people we are actively looking ation has clearly improved since 2010 regardless of
for work. For both of these reasons, the conventional the chosen metric.
unemployment rate provides an underestimate of the
severity of the unemployment situation. LABOR FORCE PARTICIPATION The labor force
participation rate is a complementary measure to the
In Figure 1.6 we report the conventional unemploy- unemployment rate. The labor force participation rate
ment rate, as reported in the previous figure (referred captures the share of the adult population that would
to as U-3), along with a measure that also includes like to work—termed “in the labor force”—while the
discouraged workers (U-5), as well as a measure that unemployment rate captures the share of the labor
force that is unable to find employment at any given
moment in time. Ultimately, the labor force participation
FIGURE 1.6: United States Unemployment Statistics rate is a more fundamental descriptor of an economy’s
18
Unemployment Rate, % long-run employment situation.
16 Including Discouraged Workers In Figure 1.7 we report labor force participation for
and Part Time Workers for
14
Economic Reasons – U-6 the US since 1950. As illustrated, the figure peaked
in 2002 at 67 percent and has fallen substantially
Including Discouraged
12 Workers – U-5 since 2008, now standing at just under 63 percent.
10 The broad evolution of this figure is largely driven by
demographic processes, namely the emergence and
8
aging of “Baby Boomer” population. Notice that the
6 figure began to rise substantially around 1965, when
the first of the “Baby Boomers” turned 20 years old.
4 Conventional
Unemployment Rate – U-3
This measure continued to rise through around 1998,
2 when the first of this group turned 55 years old, but
then began to decline substantially around 2008—the
0
point when the first “Baby Boomers” approached the
conventional retirement age.
Sources: US Bureau of Labor Statistics; IHS Markit
Note: Quarterly data used.
In addition to the baby boomer effect, the post-WWII
structural change in labor force participation rates was
FIGURE 1.7: United States Labor Force Participation Rate driven in large part by large increases in the female
Civilian Labor Force Participation Rate, %
68 labor force that occurred through the mid-1990s.
Overall, the recent declines in labor force participation
could present a significant impediment to the nation’s
66
long-run economic growth potential as fewer workers
will be called upon to support more retirees vis-à-vis
64
private pension plans as well as Social Security and
other federal programs. Furthermore, many economic
challenges below might interact with a lower rate of
62 labor force participation in the long run, leading to a
significantly different performance for the US economy
over the long term.
60
HOUSING As is well known, the catalyst for the recent
58 financial crisis and economic recession was the dra-
matic decline that was suffered in the housing market
from 2007 to 2009. Single-family housing starts have
Sources: US Bureau of Labor Statistics shown notable improvement over the past five years,The United States Economy | 7
rising from 475 thousand in early-2012 to over 800 FIGURE 1.8: United States Housing Starts
thousand by mid-2017. As illustrated in Figure 1.8, the 1,800
Housing Starts (Thousands)
forecast does show continued optimism in calling for
1,600
continued growth over the next year or so before con-
struction activity begins to stabilize by late-2018. Multi- 1,400
family housing starts rebounded at a much stronger
1,200
pace than the single-family side of the market, return-
ing to pre-recession levels of new construction activity 1,000
by early-2013. Aggressive multifamily construction in 800 Single-Family
several large cities in the post-recession years has
now left these markets with moderate levels of excess 600
Multi-Family
supply. As a result, the forecast calls for the overall 400
pace of multifamily starts to increase only marginally
200
during the outlook period.
0
CONSUMER CONFIDENCE Recessions typically
have a catalyst in some exogenous shock (such as
Sources: US Census Bureau; IHS Markit Note: Housing starts statistics use quarterly data.
the bursting of a housing bubble or high oil prices),
falling consumer sentiment is often the key driver of
demand during recessions. Typically, the initial reces- FIGURE 1.9: Consumer Confidence
Index: 1966=100
sion catalyst reduces demand directly, and thereby 120
output. This drop in output reduces confidence, which
reduces demand further, and a vicious cycle ensues. 110
On the upswing of the business cycle, an economic
system is unlikely to ever achieve its full potential until 100
confidence is restored.
90
As reported in Figure 1.9, US consumer confidence
was in free fall in 2007 and 2008, and hit its all-time 80
low in 2009.3 However, despite a brief setback during
the summer of 2011 when fears of a double-dip US 70
recession emerged, consumer confidence has gener-
ally moved higher, although in a jagged manner, since 60
2009. Since 2015, confidence now stands roughly on
par with pre-recession levels. 50
CHALLENGES FACING THE US ECONOMY Source: Thomson Reuters and University of Michigan Surveys of Consumers. Note: Monthly data used.
GLOBAL ECONOMIC SLOWDOWN While the US
economic outlook remains relatively healthy, numerous FIGURE 1.10: Real GDP Growth – Select Economies
potential threats to sustained growth exist. Prominent % change, 5-Year Average Annualized Growth Rate
on this list is the possibility of an economic slowdown
among the nation’s primary trading partners, which
could threaten US exports and could create instabil- Euro Area + UK
ity along other dimensions. In Figure 1.10 we illustrate 2003-2008
2011-2016
variation in economic growth rates for three major
2017-2022
economies in the world, which collectively account for
over 60 percent of global economic output. The figure
United States
shows the rate of economic growth for five years lead-
ing up to the beginning of the global recession (grey
bar), growth during the past five years (yellow bars),
and expected growth over the coming five years. As
illustrated, economic growth is weakening substan- China
tially in all three economic regions. The Euro Area and
the US are expected to growth at rates of 1.2 percent
-4% -2% 0% 2% 4% 6% 8% 10% 12% 14% 16%
Source: International Monetary Fund World Economic Outlook
3. Economists have tracked consumer confidence since 1968.8 | WEST VIRGINIA ECONOMIC OUTLOOK 2018-2022
FIGURE 1.11: World GDP by Country and 2.3 percent on average over the coming five years,
2000 2016 respectively, compared to 7.1 percent and 2.2 percent
annually in the years leading up to the recession.
Even greater uncertainly exists in Europe now that the
United Kingdom is in the process of leaving the Euro-
United States Rest of World
United States pean Union. The turbulence in Europe is especially
36% 26% disconcerting since the region receives nearly one-fifth
Rest of World
31%
41% of total US exports.
Euro Area + UK CHINA While GDP in China grew by an average annual
17% 21% rate of over 15 percent from 2003 through 2008, Chi-
Euro Area + UK
China
24% nese growth has decelerated sharply in recent years
4%
and is expected to hover around 6 percent annually
China
in coming years. While this expected rate of growth
still well exceeds the global average, it is much weaker
Source: International Monetary Fund World Economic Outlook
when compared to what the country has experienced
over most of the past two decades and is dangerously
FIGURE 1.12: US Federal Debt Held by the Public as a Share of GDP low given growth in the country’s labor force. Should
80
Debt Share of GDP (%) Chinese growth slow further, it could impact the US
economy, especially given that China accounts for
75
Debt Held by Public as over 7 percent of US exports. In addition, concerns
70
a Share of GDP
over the stability of the Chinese economy remain a
65
pressing issue. Figure 1.11 illustrates the dramatic
degree to which China has risen as a share of the
60
global economy since 2000.
55
FEDERAL GOVERNMENT DEBT Although the situ-
50
ation has improved markedly in recent years, issues
45 related to the long-run sustainability of the US federal
30-Year Average
40 government budget remain a potential concern for
long-run economic growth. As such, we explore US
35
federal government budgetary issues through figures
30 1.12 through 1.15.
Sources: US Bureau of Economic Analysis; IHS Markit As depicted in Figure 1.12, federal debt held by the
public, which hovered between 31 percent and 36
FIGURE 1.13: Federal Deficit Share of GDP percent of GDP between 2000 and 2007, began ris-
ing dramatically in 2008 as tax revenues plunged and
Deficit Share of GDP (%)
12 the federal government ramped up spending in part to
stimulate the weakening economy. As of early-2016,
10 Deficit Share of GDP
the figure was around 76 percent of GDP, a rate that is
8
well above the 40 percent averaged over the past 30
years. The figure is forecast to remain relatively stable
6 over the next five years. However, in the long-run (not
shown) the figure is forecast to explode given the aging
4 of the US population and the additional public benefits
Post WWII Average that an older population receives (i.e. Medicare and
2
Social Security), barring any change in public policy.
0
A public debt level that surpasses a critical level can
-2 be detrimental to long-run economic prosperity if
the public debt becomes large enough to drive inter-
-4
est rates high enough that they ultimately crowd out
private-sector savings and investment activity—a key
Sources: US Bureau of Economic Analysis; IHS Markit. driver of productivity growth in the long-run. In a simi-
lar vein, while the historical average deficit/GDP ratio is
around 2 percent, the ratio surged to nearly 10 percentThe United States Economy | 9
in 2009—its highest level since the World War II-era. FIGURE 1.14: US Transfer Payments as a Share of Personal Income
After remaining at a very high level through 2012, the 19
Share of Personal Income, %
ratio has fallen substantially as the US economy has
improved and federal spending has fallen in response 18
to the winding down of military operations and seques- Transfer Payments as a
Share of Personal Income
17
tration. The deficit for 2017 is expected to be around
3.5 percent of GDP, and is forecast to begin to increase 16
at the end of the forecast period. However, the deficit’s
size relative to the economy is expected to rise sub- 15
stantially over the longer-term (not shown in the figure) 30-Year Average
14
due to the reasons described above.
13
TRANSFER PAYMENTS The recent dynamic involv-
ing US federal government debt is closely related to 12
the increase in transfer payments from the US federal
11
government. Examples of transfer payments include
Social Security, unemployment benefits, welfare ben-
efits, Medicare, and Medicaid. As illustrated in Figure Sources: US Bureau of Economic Analysis; IHS Markit
1.14, transfer payments increased substantially in
2008, reaching a high of around 18.6 percent of per- FIGURE 1.15: Components of US Federal Government Spending
sonal income, compared to a 30-year average of just
over 14 percent. This increase is attributable to two 1992 2016
major factors: a) falling income and rising unemploy-
ment during the recession, and b) more generous
Defense
public policy, such as the extension of unemployment Defense Spending
benefits. Since recovery began, the share has fallen Spending 16%
26%
to around 17.5 percent of personal income and is Mandatory
Nondefense
expected rise slightly over the near term. In the long- Spending Mandatory Discretionary
55% Spending
run, the figure is expected to rise again substantially Nondefense
Spending
67% 17%
with the aging of the US population, barring any policy Discretionary
Spending
changes, such as a reduction in benefits and/or an 19%
increase in the Social Security retirement age.
In Figure 1.15 we report the composition of US fed-
eral government spending for 1992 and 2016. As
Source: US Congressional Budget Office
illustrated, mandatory spending, which is primarily
composed of transfer payment spending such as
Social Security, Medicare, Medicaid, unemployment FIGURE 1.16: US Personal Savings as Share of Disposable Income
insurance, and the like, rose to 67 percent of all federal Savings Rate (%)
10
spending in 2016, up from 55 percent in 1992, largely
Savings rate
the result of an aging population. At the same time, 9
defense spending fell to 16 percent of total spending,
down from 26 percent in 1992. Nondefense discretion- 8
ary spending has fallen to 17 percent of total spending.
7
If the long-term debt burden is to be reduced, it will
have to be accomplished through either higher taxes, 6
or a reduction in one of these areas of spending, each 20-Year Average
of which carries along with it a set of concerns and 5
difficult political realities.
4
SAVINGS Savings is another potential factor that can 3
affect the US economy in coming years. The rate of
national savings, as reported in Figure 1.16, has fluctu- 2
ated fairly widely over the past decade or so. It fell to
a low of just over 2 percent in the mid-2000s, and then
Sources: US Bureau of Economic Analysis; IHS Markit
rose to a high of around 9 percent during the recent
recession. Savings has since fallen back to around 5.510 | WEST VIRGINIA ECONOMIC OUTLOOK 2018-2022
FIGURE 1.17: United States Inflation Rates percent, which is noticeably above the 20-year average
Percent Change Year over Year (%)
5 for the figure. However, savings is expected to increase
substantially over the coming five years, mainly driven
Total Personal Consumption Expenditures
4 by changing demographics in the economy. While this
projected, short-term rise in savings has the potential
to weaken consumption spending slightly, it will likely
3
be an overall positive in the economy over the long-
Targeted Inflation Rate run, as a higher savings rate enables a higher level of
2 capital investment.
1 INFLATION As reported in Figure 1.17, inflation has
Excluding Food and Energy
been stable by historic standards in the US since the
0 mid-1980s, rarely moving outside of the 1 to 3 percent
range. While overall inflation did reach a slight spike
of close to 4 percent for a brief period in 2008 due to
-1
surging oil prices in the first half of that year, inflation
has been below trend for the most part since the Great
Sources: US Bureau of Economic Analysis; IHS Markit Recession ended. Core inflation, which excludes food
and energy prices from the equation (yellow line in
FIGURE 1.18: Select United States Interest Rates figure), has been below the 2 percent figure that mon-
Percent (%) etary policymakers explicitly state as a target since the
10
beginning of 2012. Moreover, core inflation is expected
9 to remain below this level through the first half of the
8 outlook period, based on market-based expectations
(such as Treasury Inflation-Protected Securities) and
7 30-Year Mortgage Rate
the consensus of economic forecasts.
6
5 However, there is a chance that faster growth in price
levels could re-emerge. The US Federal Reserve (Fed)
4
has taken unprecedented steps to stabilize the econ-
3 Federal omy since 2008, and in so doing has increased the
Funds Rate
2 monetary base—primarily the volume of reserves held
10-Year Treasury Rate by banks—dramatically through its purchase of US
1
Treasury Securities and other assets, such as private-
0 sector mortgage-backed-securities. This monetary
stimulus has not translated into higher inflation due
Sources: Federal Reserve Board of Governors; Freddie Mac; IHS Markit to continued modest demand and banks’ reluctance
to lend. Inflationary pressures do have the potential to
build as lending and the broader economy improve. As
FIGURE 1.19: : Share of Aggregate Income by Quintile
that happens, the Fed will need to withdraw liquidity
Income Share by Quintile, %
55 from the monetary system so as not to create an envi-
50
Highest Quintile ronment for inflation to build. The uncertainty stems
from the fact that monetary policy across the globe is
45
in uncharted territory given the volume of the recent
40
monetary stimulus, the nature of the asset purchases,
35 and negative interest rates in the case of the European
30 Union, Japan and other areas.
Fourth Quintile
25
INTEREST RATES A related concern is the inevitable
20
Third Quintile rise in interest rates in the US economy in coming
15 years. This rise will, in part, stem from the Fed’s
10
Second Quintile ongoing “normalization” process wherein the Federal
Open Market Committee (FOMC) unwinds some of its
5 Lowest Quintile
previous asset purchase programs and other forms
0
of monetary stimulus discussed above. Short-term
interest rates have been on the climb in concert with
Source: US Census Bureau recent hikes in the discount rate by the Fed, but theThe United States Economy | 11
long of the rate curve has budged little from its range these individuals have often requested or proposed
of the past few years. If conditions change and rates public policies that could reverse this trend. Finding
rise too rapidly, it could precipitate much weaker levels an appropriate balance within public policy between
of investment and consumer spending growth. On promoting economic growth overall and achieving a
the other hand, if the Fed waits until too late to allow socially-acceptable income distribution can prove to
rates to rise, inflation would be a concern. Figure 1.18 be challenging in many cases.
reports the forecast for three key US interest rates, but
some appreciable disagreement exists among FOMC
members over how high and quickly short-term inter- FIGURE 1.20: Income Gap
est rates should be raised in the coming years. Mean Income by Quintile Ratios: Highest Quintile to Second Quintile
6.5
INCOME INEQUALITY The final concern that we con-
sider relates to rising income inequality in the US. In 6.0
Figure 1.19 we illustrate the share of aggregate income
in the US that is earned by households divided into 5.5
quintiles. As illustrated, the lowest-income quintile,
while representing 20 percent of households, earned
5.0
around 3 percent of the total income in the nation in
2015. The second lowest-income fifth of households
earned around 8.2 of the total income in the nation in 4.5
2015, and so on. The highest-income quintile earned
51 percent of the nation’s total income in 2015. Fur- 4.0
ther, as illustrated, the income share for the highest
quintile has risen by around 7 percentage points over
3.5
the period illustrated, corresponding to a decline in
the share earned by the other quintiles. Overall, many
individuals are concerned about the growing income Sources: US Census Bureau
concentration among higher income households and
Proud to Support WVU’s
Economic Outlook Conference
and to Invest in a Good Life
for all West Virginians
866.306.2400
www.mckinleycarter.com McKinley Carter is an SEC-registered investment adviser. For
information pertaining to McKinley Carter’s fees and services, please
contact McKinley Carter for a copy of our disclosure statement as set
forth on our Form ADV. For information pertaining to our registration
status, refer to the Investment Adviser Public Disclosure website
C H A R L E S T O N | W H E E L I N G | PA R K E R S B U R G | P I T T S B U R G H | D C M E T R O (www.adviserinfo.sec.gov).12 | WEST VIRGINIA ECONOMIC OUTLOOK 2018-2022
CHAPTER 2: The state’s economic performance since 2012 is a
The West Virginia Economy significant outlier from the overall national economic
backdrop. While US economic growth has lagged
RECENT ECONOMIC PERFORMANCE what has prevailed on average during post-WWII
West Virginia’s economy emerged from a sharp reces- economic expansions by many measures, the current
sion in mid-2016 and appears to be in the early stages expansion recently entered its 9th year and stands as
of a solid economic rebound. The state’s beleaguered the third-longest in duration as tracked by the National
coal industry has rebounded since the second half of Bureau of Economic Research. Nationally, employers
2016 following several years of precipitous declines in have expanded payrolls by 10 percent (or 13.3 million
both payrolls and output—especially in the southern jobs) since the beginning of 2012. By comparison,
West Virginia coalfields. Moreover, although activity total employment within West Virginia4 has been on a
within the state’s natural gas industry did not fall off downward trajectory for several years and, as of the
at anywhere near the same magnitude as that of coal, second quarter of 2017, remains nearly 3 percent (or
production was erratic for several quarters across just over 20,000 jobs) below the cyclical peak the state
2015 and 2016, but began to register solid growth over achieved in early-2012.
the second half of 2016 that continued into the first
half of 2017. STATE COMPARISONS While West Virginia’s per-
formance relative to the nation over the past several
years has been below average based upon most
FIGURE 2.1: Total Employment
economic indicators, the state has also managed to
West Virginia, Thousands United States, Millions lag the performance of its neighboring states. Indeed,
715 150
West Virginia has recorded average annualized
West Virginia
710 growth of less than 0.3 percent in real GDP since the
145
first quarter of 2012, trailing the next slowest-growing
705
state in the region (Virginia at 0.8 percent). Pennsyl-
140
700 vania, Ohio and Kentucky, states which also pos-
sess above-average exposures to energy markets,
695 135 saw real GDP grow at much faster rates overall. The
690
US
state’s relative growth deficit compared to its neigh-
130 bors since 2012 has been even more significant as
685 West Virginia is the only state in the region to see an
125 outright contraction in payrolls over this time period
680
while neighboring states saw average annual growth
675 120 range from no worse than 0.8 percent to as much as
1.8 percent.
Source: US Bureau of Labor Statistics
*Shaded regions indicate recessions
ENERGY SECTOR The primary driving forces behind
West Virginia’s economic struggles of the past several
years and the nascent recovery in economic activity
FIGURE 2.2: Economic Growth in West Virginia since the second half of 2016 are the state’s coal and
and Adjacent States, 2012Q1-2017Q1 natural gas industries. Overall, the coal and natural gas
industries combined to account for nearly 17,000 of
Kentucky the nearly 26,000 jobs lost on net statewide between
the first quarter of 2012 and fourth quarter of 2016.
Maryland The coal industry accounted for the wide majority
of energy-related job losses over this time period as
Ohio the reinforcing effects of market forces and previous
regulatory changes at the state and federal levels have
Virginia
dramatically reduced the use of West Virginia coal to
generate electricity in the US. Also, flagging demand
for thermal and metallurgical coal abroad, linked to
Pennsylvania
Real GDP
West Virginia Employment
4. Data sources are noted in each figure. All historic and forecast employment
-1.0% -0.5% 0.0% 0.5% 1.0% 1.5% 2.0% data for West Virginia come from the US Bureau of Labor Statistics Quarterly
Census of Employment & Wages program. For an explanation of these data,
Average annual growth, % including comparisons to the monthly CES payroll employment data, see
http://www.bls.gov/cew/cewfaq.htm.
Sources: US Bureau of Labor Statistics; Bureau of Economic AnalysisThe West Virginia Economy | 13
a severe excess capacity in global steel markets, a FIGURE 2.3: West Virginia Employment Distribution by Sector (2016)
strong dollar and rapid declines in coal use across por-
Financial Activities Other Services
tions of Western Europe, further contributed to the coal 3% 3% Information
1%
industry’s struggles in recent years.5 After averaging
Natural Resources
roughly 158 million short tons in 2008, coal production & Mining
fell to an annual total of 80 million short tons in 2016. 3%
With the sharp downward trend in production over this Construction
4% Government
time period, employment has followed suit as coal 20%
industry payrolls (excluding contract laborers) plunged Manufacturing
from their cyclical peak of 26,000 in early-2012 to a 7%
trough of 11,300 in mid-2016. Trade,
Professional & Transportation &
Business Utilities
However, the industry’s fortunes have improved Services 20%
Leisure &
appreciably over the past several quarters, leading 10%
Hospitality
to gains in both output and miner payrolls across the 11% Education &
Health Services
state’s northern and southern coal-producing regions. 18%
A sizable portion of this rebound is due to a surge in
Asia-Pacific metallurgical coal demand since last fall,
Source: US Bureau of Labor Statistics
combined with a temporary boost in demand for Cen-
tral Appalachian met coal supplies after Cyclone Deb-
bie damaged Australia’s rail infrastructure, but higher companies to maintain or expand production volumes
utilization rates of domestic coal-fired power plants such as re-fracking existing wells or find ways of rais-
through the first half of 2017 have also helped to pro- ing average well productivity rates.
pel growth in statewide coal production. Indeed, the
seasonally adjusted annualized rate of coal production Indeed, well productivity rates have increased rapidly
has increased from less than 75 million short tons in in recent years. Active well counts fell more than 14
early 2016 to more than 93 million short tons in the first percent between 2014 and 2016, reaching their lowest
six months of 2017. Statewide coal industry employ- total in more than a decade, but marketed production
ment has increased by approximately 26 percent since increased 26 percent over this two-year period. Prices
last fall, reaching a total of 14,300 during the second also faced pressure from insufficient pipeline infra-
quarter of 2017. structure, which created bottlenecks that left natural
gas supplies stranded rather than delivered to high-
Unlike coal, West Virginia’s natural gas industry did not demand areas, such as New England, and allowing
actually reach its peak in terms of employment or pro- prices between the areas to remain closer to parity for
duction growth until the end of 2014. From that point extended periods of time.
until the third quarter of 2016, however, the industry
registered only an 11 percent cumulative increase in Just as conditions within the coal industry have
marketed production volumes after having seen with- improved over the past three or four quarters, market
drawal volumes effectively double over the space of conditions for natural gas have improved enough to
the previous seven quarters. Drilling and exploration boost production and, to a lesser extent, payrolls.
companies and field service support firms ended up Overall gas production volumes in West Virginia
shedding roughly 3,000 workers over this time frame, through the first seven months of 2017 are estimated
leaving employment roughly at the same overall level to be roughly 11 percent above year-ago levels as
observed in mid-2009 (excluding contract laborers). recently-completed pipeline capacity has helped to
While final demand for natural gas has generally been improve uptake. Industry payrolls likely stabilized in the
on the rise over the past several years, particularly in second half of 2016, and while the productivity gains
the electric power sector, a protracted bear market of recent years will dampen job growth to some extent
pricing environment in the Appalachian Basin had in the near term, a doubling in the number of active
a significant negative impact on the industry during rigs deployed in West Virginia since August 2016, plus
2015 and much of 2016. Prices fell too far to justify announced plans for increased exploration activity and
new exploration and capital investment, but at the additional pipeline capacity coming on line in the very
same time accumulated debt obligations forced many near future, point to accelerating job growth, especially
once contract labor is taken into account.
5. For a more thorough discussion of West Virginia’s coal industry, along with CONSTRUCTION AND MANUFACTURING In addi-
an analysis of future trends and possible scenarios for coal production over the
long term, see Chapter 3 of this report as well as BBER report Coal Production in
tion to the direct impacts on output and employment
West Virginia: 2017-2040. in their respective industries, the coal industry’s steepYou can also read