Economics and Environment Assessment of Smart Energy Electricity Meter for Residency Monitoring
←
→
Page content transcription
If your browser does not render page correctly, please read the page content below
Vol 11, Issue 1, (2022) E-ISSN: 2226-3624

              Economics and Environment Assessment of
              Smart Energy Electricity Meter for Residency
                              Monitoring
              Nurfadzilah Ahmad1, Iman Syazwan Mohd Yusof1, Mohd
                               Firdaus Abdullah2
           1Solar   Research Institute (SRI), UiTM Shah Alam, Shah Alam, Selangor, 2School of Electrical
                      Engineering, College of Engineering, UiTM Permatang Pauh Pulau Pinang

To Link this Article: http://dx.doi.org/10.6007/IJAREMS/v11-i1/11136          DOI:10.6007/IJAREMS/v11-i1/11136
Published Online: 10 January 2022

         Abstract
         The energy meter is a device to measure energy utilities and is crucial to determine the daily
         energy usage. However, the current energy meter can only record the amount of power
         consumed but is still lacking in the monitoring system for power consumption. This paper
         implemented the concept of an IoT based energy meter using a simple low-cost NodeMCU
         microcontroller, an esp8266 Wi-Fi chip module and Blynk application. This device was
         constructed with an LED to represents the power consumption from the LED blinking with the
         base value set at 1000 pulse for 30 minutes, proportional to the energy meter time. This IoT
         based device will count the pulse from LED blinking and store the energy reading to identify
         the Maximum Demand (MD) in a residence based on the time and date of the reading taken.
         We set a certain limit for the power consumption and once the limit is reached, this IoT based
         device will send the notification through a Blynk application to enable users to control their
         energy consumption. This proposed design is beneficial in preventing any MD penalty to the
         users due to an excessive energy usage.
         Keywords: Energy Meter, Esp8266, LDR, Maximum Demand

         Introduction
         Energy usage in residential, commercials and industrial area can be measured by the energy
         meter (Vendrusculo et al., 2007). Tenaga Nasional Berhad (TNB) is a typical energy supplier in
         Malaysia and is currently in the replacement phase to replace its electromechanical meters
         with an electronic meter for an upgrade and all the meters have been calibrated and tested
         to meet Malaysian ISO / IEC 17025:2005 requirements (Mudaliar & Sivakumar, 2020). The
         reading of the energy consumed is defined by the LCD (Abate et al., 2019) of the meter
         provided the peak load from TNB whenever necessary. Because electricity cannot be stored,
         there must be efficient generation, transmission, and distribution capacities available for the
         highest demand (Abate et al., 2019). The Domestic Ordinary Power Consumers can be
         categorized into two types, single-phase and three-phase and all the electrical services can be
         measured in kilowatt-hours (kWh), referring to the kilowatt-hour energy consumption
         (Muralidhara et al., 2020). This device implements the IoT concept to the energy meter that

                                                          1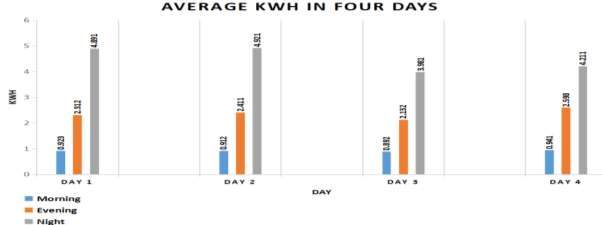
INTERNATIONAL JOURNAL OF ACADEMIC RESEARCH IN ECONOMICS AND MANAGEMENT SCIENCES
Vol. 1 1 , No. 1, 2022, E-ISSN: 2 2 2 6 -3624 © 2022

connects the device via the internet using a Wi-Fi module where the user can monitor their
consumption using only a mobile phone that can connect many user accesses from one device
to another. This device will monitor the4consumption of load by counting the pulse of the
energy meter, where the user will be notified when the pulse reaches the base line.
        Different technologies have been developed to measure the power consumption of
the consumer to measure the power consumption (Cebe & Akkaya, 2019) and one of the main
reasons for the breakthrough in the energy meter is that there is no software that notifies
users of their energy use (Rafsanjani et al., 2020). In addition, the industrial sector that uses
more power than the predestined level will be penalized. From the previous report, the IoT
energy meter was designed to track electricity demand by offering a system that can alert
users when the peak demand occurs, where notification would be sent when excessive
charges are used (Fettermann et al., 2020). When the energy usage can be registered,
consumption can be reduced, which, in effect, considerably reduces costs. Energy demand
measurement using an IoT applications is increasing, as both numbers and specifications
continue to rise for IoT devices. Modernization of an IoT based energy meter is new but a lot
of work can be done to apply the same concept to an energy meter with an IoT installation
(Pocero et al., 2017).
        The Internet of Things (IoT) technology enables a smooth and uncomplicated data
transferring between both the energy suppliers and consumers, resulting in an easy and
uninterrupted continuity of bill payments, and monitoring of energy usage (Pocero et al.,
2017). Using the Wi-Fi module that connects the device to the Internet, the IoT enables
machines and sensors to be interconnected through the web (Avancini et al., 2019). IoT allows
users to communicate or interact with non-living objects and also has the ability to move data
through the internet without interaction between humans and humans or interaction
between humans and computers (Diamantoulakis et al., 2015). Commencement of a Wi-Fi
module will interrelate computer equipment, mechanical and digital devices, objects,
animals, or people provided with unique identifiers (UIDs) to come out with a favorable IoT
device (Li et al., 2009). The consumer can track their consumption by using the IoT energy
meter through the internet, enable users to control and limit the usage (Li et al., 2009). Many
devices can be interfaced using IoT, and hence sensors and devices can be analyzed and
controlled at any moment in any place with the presence of Wi-Fi. Therefore, Internet of
Things (IoT) is medium that recommended for transferring the data over a network as
upgrading the communication ability from a GSM or Bluetooth module which using mobile
communication network to WiFi module which using local internet connection (Aziz et al.,
2020). Internet connection can provide strong connection which it is needed to monitor the
power consumption regularly in real time (Bansal et al., 2011). IoT also can save the data into
cloud-based application which it needed for analyzing the problem that transform into graph
or others way.
      Moreover, in a past few years, many recent studied and researched about the power
consumption pattern to get the profile load for demand response (Diamantoulakis et al.,
2015). However, in most studied and research, the power consumption pattern is not focus
on process of appliances on every cycling and operation. As for this study, the research is
more concern to the power consumption pattern on the operation mode of typical household
appliance to provide enough information to the user. The main reason underlying the home
appliance power consumption assumption is the lack of knowledge and information about
detailed home appliance operating characteristics, and the lack of openly available
measurement data (Hasanuzzaman et al., 2008). It is a difficult task to manually schedule the

                                                       2
INTERNATIONAL JOURNAL OF ACADEMIC RESEARCH IN ECONOMICS AND MANAGEMENT SCIENCES
Vol. 1 1 , No. 1, 2022, E-ISSN: 2 2 2 6 -3624 © 2022
operation of appliances and would be almost impossible for any consumer. So a scheduling
algorithm supported by suitable supporting technologies is needed to carry out the
scheduling work each day (Kim et al, 2011). This project is therefore focusing on monitoring
the real time of power consumption by using Internet of Things (IoT) based application.
Therefore, from the analyzed result, the power consumption pattern of the appliance can be
known in order to get power consumption algorithm or called as pattern of each different
appliance.
Materials and Methods
Flow Chart
Figure 14shows4the flow4chart of4IoT based energy4meter project. The4system
started4when the4node MCU is4uploaded to4the board4and after4the code4has been
uploaded, the4Wi-Fi4module4will connect4the project4to the Wi-Fi4and will4start
initializing4the RTC,4LCD and4SD card4module. The4LCD4will4show an4initial value4of
power4and4kWh and the4input sensor4which in4this case,4is the4LDR4module4will runs4by
detecting the4blinking at4the LED circuit. If4there are4any pulse reading,4the LCD4will
show4the result4of7kWh, but4if there4is no4pulse the4sensor will4read the4pulse at energy
meter4again. ESP82665WIFI4module will4upload the output4of energy4consumption in
Blynk4server. The data will4be uploaded every 30 minutes4and will be logged into an SD card.
If the4demand limit is4reached, an4alert notification4will be4sent to4the Blynk4apps. In4the
RTC (real time clock)4coding, the4time and4date will4be set4for the4first time4when
the4program uploaded.4Then, it will continue4to follow4the normal4time until4it is4upload
with an4updated.
3INTERNATIONAL JOURNAL OF ACADEMIC RESEARCH IN ECONOMICS AND MANAGEMENT SCIENCES
Vol. 1 1 , No. 1, 2022, E-ISSN: 2 2 2 6 -3624 © 2022
Figure 1: Flow chart of IoT based energy meter project
IoT based Electricity Meter
For this IoT based electricity meter to function accurately, the LDR was installed next to the
LED circuit to detect the blinking pulse from the residency energy meter and following the
input from the LED blinking, the LDR will send necessary information accordingly to the Node
MCU. Data was collected every 30 minutes and was stored in the SD card. The RTC DS3231
serves as a device to incorporate the battery input and maintaining the time accuracy if the
main power input was interrupted. This IoT based electricity meter also comprises of a Liquid
Crystal Display4(LCD) to demonstrate the reading for power and kWh, and the4ESP8266 Wi-
Fi4module was connected to the internet to enable the data sending to mobile phone via
cloud. For as long as the IoT based electricity meter is connected to the internet, monitoring
process of the energy usage can be done by consumers. To enable the monitoring directly
from the smart devices, Blynk apps will received the data from Blynk server and consumers
will be notified. Figure 2 shows4the block4diagram of4the IoT4based electricity4energy
meter.
4INTERNATIONAL JOURNAL OF ACADEMIC RESEARCH IN ECONOMICS AND MANAGEMENT SCIENCES
Vol. 1 1 , No. 1, 2022, E-ISSN: 2 2 2 6 -3624 © 2022
Figure 2: Block diagram of the Iot Based Electricity Energy Meter
For4Blynk4connection4the user4need token to be used to4login the4app. Thus,4the
token4must4be included4so the4user can4use the4Blynk app4in their4phone to4monitor
the4pulse count. To4connect the4Wi-Fi module to4the internet4the password4and
network4name must4be included4so the4Wi-Fi module4can connect4to internet4through
the4Wi-Fi. For4this device the notification alert will be sent to the user if the kWh reached its
limit as programmed. The limit of the kWh was set at 3 kWh for the testing, so if the power
exceeded 3 kWh the notification will be sent to the user by sending notification “Alert!! Reach
the limit!!” through the Blynk app. Attentively consumers will be alarmed of the total energy
consumption when the limit is reached. Figure 3 shows the baseline code of notification.
Figure 3: Baseline code of notification
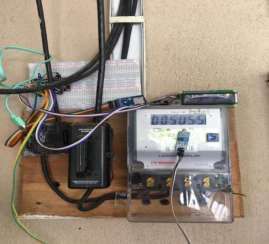
Figure 4 shows4the hardware4IoT based4energy meter4project4connected4to a4residency
energy meter. The working principle for this whole device starts from the LED blinking which
indicates the consumption. The LED on the meter will blink as an indicator4when counting
pulses and the LED placed next to the LDR sensor circuit caught the blinking pulses from the
energy4meter. In addition, this IoT energy meter was also equipped with an LCD to display
the power counting in kWh which was translated from the total pulses count in 30 minutes
duration. The LDR was also adjusted to the lowest sensitivity to prevent miscounting of pulse
blinking and since the LDR was made of a high resistance semiconductor, it4can have4a
resistance as low as several megaohms (Alahakoon & Yu, 2016). Wi-Fi modem was installed
to allow the device to be connected to the Wi-Fi internet connection via a Wi-Fi module as it
is crucial to have a very high-speed internet for an accurate reading (Kishore et al., 2010). For
monitoring purpose, Blynk application as the4graphic interface4for this4project was used and
this platform is available for installation in iOS and Android devices. From the4observation
during4the data collection4of the testing4device, the time4between one pulses from another
pulse was about 4 seconds. Hence for a duration of 1 minute (60 seconds), 15 pulses were
obtained resulting in 900 pulses per hour.
5INTERNATIONAL JOURNAL OF ACADEMIC RESEARCH IN ECONOMICS AND MANAGEMENT SCIENCES
Vol. 1 1 , No. 1, 2022, E-ISSN: 2 2 2 6 -3624 © 2022
Node MCU
LCD
SD Card
LDR
Energy Meter
Figure 4: Hardware IoT based energy meter project connected to a house energy meter
Results and Discussion
This section was divided into three sections, section A and section B were the hardware
testing at residency energy meter and household appliances respectively, and section C for
the monitoring through Blynk apps.
Section A: Result for hardware testing at residency energy meter
The testing was taken in the morning, evening and at nighttime at a terrace house. The IoT
based energy meter hardware was connected to the house’s energy meter for 30 minutes
data collection and was summarized for the final 2 minutes for tabulation process. Table 1
shows the data power usage during testing for last two minute in the morning, evening and
at night.
Table 1 shows the data during testing at a terrace house from 9am until 9.30am. This
data shows the last 2 minutes of the data. It shows that the reading of the data maintained
at 0.00 to 0.45 kWh since there was less power usage at home in the morning. The data were
also taken during testing at a terrace house from 12.51 pm until 1.21 pm and it shows the last
2 minutes of the data with the reading maintained at 0.00 to 2.548 kWh and for night, data
were taken from 8.51 pm until 9.16 pm. For the last 2 minutes, the data maintained at 0.00
to 4.614 kWh.
6INTERNATIONAL JOURNAL OF ACADEMIC RESEARCH IN ECONOMICS AND MANAGEMENT SCIENCES
Vol. 1 1 , No. 1, 2022, E-ISSN: 2 2 2 6 -3624 © 2022
Table 1
Data of power usage during testing
Morning Evening Night
TIME kWh TIME kWh TIME kWh
9:28:18 0.0392020 13:19:27 2.4372020 21:14:27 4.3262020
9:28:28 0.1332020 13:19:36 2.4482020 21:14:36 4.3582020
9:28:37 0.2052020 13:19:45 2.4602020 21:14:46 4.3892020
9:28:47 0.2952020 13:19:55 2.4712020 21:14:55 4.4192020
9:28:56 0.2952020 13:20:4 2.4812020 21:15:4 4.4452020
9:29:5 0.3062020 13:20:14 2.4882020 21:15:14 4.4742020
9:29:15 0.3282020 13:20:23 2.4942020 21:15:23 4.5022020
9:29:24 0.3282020 13:20:33 2.5002020 21:15:33 4.5342020
9:29:34 0.3342100 13:20:42 2.5092020 21:15:42 4.5652020
9:30:25 0.3353890 13:20:52 2.5182020 21:15:52 4.5942020
9:30:34 0.4214000 13:21:1 2.5272020 21:16:1 4.6192020
9:30:50 0.4512679 13:21:7 2.5402020 21:16:7 4.6412020
The average results for data collection in four days were summarized in table 4 and
figure 5. In figure 5, the x-axis shows the kWh value and the y-axis consists of the collected
data in four days in morning, afternoon, and night. From the bar chart, the energy
consumption shows highest usage at night while the energy consumed in the morning, least
energy usage was tabulated. The power usage at night is high because the household use the
air conditioner and light (Li et al, 2009). For these four days data, the power usage in the
morning maintain at an average of 0.90 kWh while in the evening the power usage maintained
at 2.0 kWh and at night the power usage maintained at 4.0 kWh.
Figure 5: The bar chart result in four days
Table 4
The average result kWh for four days
Day 1 Day 2 Day 3 Day 4
Morning 0.923kWh 0.912kWh 0.892kWh 0.941kWh
Evening 2.312kWh 2.411kWh 2.132kWh 2.598kWh
Night 4.891kWh 4.921kWh 3.981kWh 4.211kWh
7INTERNATIONAL JOURNAL OF ACADEMIC RESEARCH IN ECONOMICS AND MANAGEMENT SCIENCES
Vol. 1 1 , No. 1, 2022, E-ISSN: 2 2 2 6 -3624 © 2022
Section B: Result for hardware testing at household appliances
The power consumption pattern was observed on three different appliances for three
different categories which are motor load for refrigerator, heating element load for electric
oven and electronic load for LCD television at single phase 230V. The power consumption of
each appliance was recorded for every 15 second interval for a period.
Refrigerator
Toshiba brand was used as tested appliance for refrigerator. Figure 6 illustrates the graph of
refrigerator power consumption against time for interval of 90 minutes. From the graph in
Figure 6, there was a long duration spark of power at the region marked as ‘compressor on’
indicated that compressor and the fan motor started working at average of 200W for 55
minutes. Then the compressor stops working after the refrigerator achieves the desired
temperature. From the graph in Figure 6, at the red marked region of ‘compressor off’, the
average refrigerator power usage run was 110W. During data collection process, the door of
refrigerator was opened randomly to act as a normal daily life. As a result, the short spark of
power aligns with the door opened. This condition was due to the increase of convection heat
transfer inside refrigerator. Warm and moist air transferred from the outside surrounding
mixes with the cabinet cool air. Hence, energy required to cool down again since the
temperature inside of refrigerator dropped due to mix of warm air (Lu et al, 2019). The
average power consumption during the door opened was between 100W to 130W. The result
show that the compressor turned on and the door opened required power consumption. The
average power consumption was compared with the refrigerator wattage specification as
stated in Figure 7. The result was the average power consumption during the normal
condition was still in below of the rated power.
Figure 6: Refrigerator consumption
Figure 7: Refrigerator wattage specification
8INTERNATIONAL JOURNAL OF ACADEMIC RESEARCH IN ECONOMICS AND MANAGEMENT SCIENCES
Vol. 1 1 , No. 1, 2022, E-ISSN: 2 2 2 6 -3624 © 2022
Electric Oven
Pensonic brand was used as tested appliance for electric oven. Figure 8 illustrates the graph
of electric oven power consumption against time for a certain period. The total time interval
for electric oven data collection was 15 minutes. From the graph in Figure 8, the sudden
power increased when the temperature and the timer was turned on. The temperature was
set at 70° C origin and slowly increased until 190° C for 10 minutes. The result of the graph at
the red marked region of ‘temperature ON’ does not show the noticeable of sudden increased
of power. The average power consumption was 1140W. After 10 minutes, as the temperature
has been decreased until 70° C, the power was decreased until at a constant 40W as show in
Figure 4.5 at the red marked region of ‘temperature OFF’. The average power consumption
was compared with the electric oven wattage specification as stated in Figure 9. The result
was the average power consumption was still below of the rated power.
Figure 8: Electric oven consumption
Figure 9: Electric oven wattage specification
LCD Television
LG brand was used as tested appliance for LCD television. Figure 10 illustrates the graph of
LCD television power consumption against time for a certain period. The total time interval
for LCD television data collection was 15 minutes. From the graph in Figure 10, at the red
marked region of ‘standby mode’ was the situation when the television was opened in
standby mode operation. There was power consume during the standby mode which at
9INTERNATIONAL JOURNAL OF ACADEMIC RESEARCH IN ECONOMICS AND MANAGEMENT SCIENCES
Vol. 1 1 , No. 1, 2022, E-ISSN: 2 2 2 6 -3624 © 2022
average of 33W. This is because standby mode allows the television using a little electricity to
constantly read the signal from the remote control so that the television was ready to be
turned on (Mitra et al, 2016). The power increased as the television was turned on as shown
in Figure 10 at the red marked region of ‘turn ON’. The average power consumption during
the television turned on was at 93W. The average power consumption was compared with
the electric iron wattage specification as stated in Figure 11. The result was the average power
consumption was still below of the rated power.
Figure 10: Television consumption
Figure 11: Television wattage specification
Based on the three categories of appliances, the highest power consumption was the
heating element type appliances which is the electric oven with an average power
consumption of 1140W as compared to the refrigerator and LCD television with an average
power of 200W and 33W respectively. This is due to the current flows in the heating elements
encounter resistance to convert the electrical energy into heat energy. Basically, it requires
more current as compared to resistance in order to produce maximum heat energy
(Pipattanasomporn et al, 2014)
Section C: Notification through Blynk
In this section, the result of power and energy reading notification from the Blynk apps will
be explained. Blynk apps can be downloaded at an Android play store or IOS apple store.
During the testing the device baseline was set to 3 kWh and hence when the power reached
the baseline the device will send notification to notify the user to the mobile phone via Blynk
apps as shown in Figure 6. A strong internet connection is needed to collect the power reading
from the residency energy meter as well as to monitor the live reading. From figure 6, as the
10INTERNATIONAL JOURNAL OF ACADEMIC RESEARCH IN ECONOMICS AND MANAGEMENT SCIENCES
Vol. 1 1 , No. 1, 2022, E-ISSN: 2 2 2 6 -3624 © 2022
power exceeded the set limit, the Blynk app will send notification through mobile phone by
displaying “Alert!!Reach the limit!!” to notify and alert the users about their consumption.
Figure 8 shows the result of power and energy reading from Blynk apps defined from every
second detected from the pulse reading.
Figure 6: Example Notification through Blynk
Figure 7: The result from Blynk apps
This data was taken during the Movement Control Order (MCO) in Malaysia due to
pandemic Covid-19 situation worldwide. From the first wave of the disease in Malaysia from
25th January 2020 to 27th February 2020 (Naderipour et al., 2020) only 22 total cases were
reported with 20 patients were from the imported cases and only 2 cases were local
transmission. All the patients were discharged well after a handful treatment. Soon after the
first Covid-19 wave and following 11 days of zero reported case, the second wave hit Malaysia
tremendously on 27th February 2020 (Shah et al., 2020) and most of the cases came from a
Tabligh gathering in Seri Petaling. When the total number of positive cases hit 553 cases on
16th March 2020 (DG of Health, 2020), the Prime Minister announced the first phase of
Movement Control Order (MCO) for 14 days from 18th till 31st March 2020 (Ashley Tang,
2020). Malaysia has the total number of 7 MCO phases which are Phase 1 - Movement Control
Order (MCO) from 18th till 31st March 2020 (14 days), Phase 2 - Movement Control Order
(MCO) from 01st till 14th April 2020 (14 days), Phase 3 - Movement Control Order (MCO)
from 15th till 28th April 2020 (14 days), Phase 4 - Movement Control Order (MCO) from 29th
till 3rd May 2020 (5 days), Phase 5 - Conditional Movement Control Order (CMCO) from 4th
till 11th May 2020 (8 days), Phase 6 - Conditional Movement Control Order (CMCO) from 12th
May 2020 till 9th June 2020 (29 days), Phase 7 - Recovery Movement Control Order (RMCO)
from 10th June till 31th August 2020. Hence this project can help in giving an average value
for energy consumption during MCO and thus preventing the spike in the monthly electricity
bill.
11INTERNATIONAL JOURNAL OF ACADEMIC RESEARCH IN ECONOMICS AND MANAGEMENT SCIENCES
Vol. 1 1 , No. 1, 2022, E-ISSN: 2 2 2 6 -3624 © 2022
Conclusion
Implementing this project helps users focusing more on how by using the IoT could
assist in building a smart energy meter to supervise their energy consumption. Other than
that, during the peak and off-peak hours, consumer will be able to monitor their electricity
availability in the easiest way which is by using the mobile phone. Consumers can be more
aware of their energy usage anywhere and anytime. Thus, can help saving the monthly bill of
the electricity. This project also able to detect the reading of the energy meter of the Power
and Energy through the pulses number in every 30 minutes which they can log in and monitor
their energy usage. Moreover, it helps to notify the users when the power is surpassing the
limit that has been set by the user as well as the involvement of IoT delivers a huge
improvement to the users’ daily life in handling the energy consumptions. Consumers will
receive the notifications through mobile phone via the Blynk app when the power limit is
exceeded.
References
Abate, F., Carratu, M., Liguori, C., & Paciello, V. (2019). A low cost smart power meter for IoT.
Measurement, 136, 59–66.
https://doi.org/https://doi.org/10.1016/j.measurement.2018.12.069
Alahakoon, D., & Yu, X. (2016). Smart Electricity Meter Data Intelligence for Future Energy
Systems: A Survey. IEEE Transactions on Industrial Informatics, 12(1), 425–436.
https://doi.org/10.1109/TII.2015.2414355
Avancini, D. B., Rodrigues, J. J. P. C., Martins, S. G. B., Rabêlo, R. A. L., Al-Muhtadi, J., & Solic,
P. (2019). Energy meters evolution in smart grids: A review. Journal of Cleaner
Production, 217, 702–715.
https://doi.org/https://doi.org/10.1016/j.jclepro.2019.01.229
Aziz, N. A., Othman, J., Lugova, H., & Suleiman, A. (2020). Malaysia’s approach in handling
COVID-19 onslaught: Report on the Movement Control Order (MCO) and targeted
screening to reduce community infection rate and impact on public health and
economy. Journal of Infection and Public Health, 13(12), 1823–1829.
https://doi.org/https://doi.org/10.1016/j.jiph.2020.08.007
Bansal, P., Vineyard, E., & Abdelaziz, O. (2011). Advances in household appliances- A review.
Applied Thermal Engineering, 31(17–18), 3748–3760.
https://doi.org/10.1016/j.applthermaleng.2011.07.023
Cebe, M., & Akkaya, K. (2019). Efficient certificate revocation management schemes for IoT-
based advanced metering infrastructures in smart cities. Ad Hoc Networks, 92, 101801.
https://doi.org/https://doi.org/10.1016/j.adhoc.2018.10.027
Diamantoulakis, P. D., Kapinas, V. M., & Karagiannidis, G. K. (2015). Big Data Analytics for
Dynamic Energy Management in Smart Grids. Big Data Research, 2(3), 94–101.
https://doi.org/https://doi.org/10.1016/j.bdr.2015.03.003
Fettermann, D. C., Cavalcante, C. G. S., Ayala, N. F., & Avalone, M. C. (2020). Configuration of
a smart meter for Brazilian customers. Energy Policy, 139, 111309.
https://doi.org/https://doi.org/10.1016/j.enpol.2020.111309
Hasanuzzaman, M., Saidur, R., & Masjuki, H. H. (2008). Investigation of Energy Consumption
and Energy Savings of Refrigerator-Freezer During Open and Closed Door Condition.
October. https://doi.org/10.3923/jas.2008.1822.1831
Kim, S., Kwon, E. Y., Kim, M., Cheon, J. H., Ju, S., Lim, Y., & Choi, M. (2011). A Secure Smart-
Metering Protocol Over Power-Line Communication. IEEE Transactions on Power
12INTERNATIONAL JOURNAL OF ACADEMIC RESEARCH IN ECONOMICS AND MANAGEMENT SCIENCES
Vol. 1 1 , No. 1, 2022, E-ISSN: 2 2 2 6 -3624 © 2022
Delivery, 26(4), 2370–2379. https://doi.org/10.1109/TPWRD.2011.2158671
Kishore, S., & Snyder, L. V. (2010). Control Mechanisms for Residential Electricity Demand in
SmartGrids. 443–448. https://doi.org/10.1109/smartgrid.2010.5622084
Li, L., Hu, X., & Zhang, W. (2009). Design of an ARM-based power meter having WIFI wireless
communication module. 2009 4th IEEE Conference on Industrial Electronics and
Applications, 403–407. https://doi.org/10.1109/ICIEA.2009.5138237
Lu, H., Wu, X., & Liu, Q. (2019). Energy metering for the urban gas system: A case study in
China. Energy Reports, 5, 1261–1269.
https://doi.org/https://doi.org/10.1016/j.egyr.2019.09.001
Mitra, K., & Dutta, G. (2016). Electricity Consumption Scheduling with Energy Storage , Home
- based Renewable Energy Production and A Customized Dynamic Pricing Scheme
Keywords. Research and Publication.
Mudaliar, M. D., & Sivakumar, N. (2020). IoT based real time energy monitoring system using
Raspberry Pi. Internet of Things, 12, 100292.
https://doi.org/https://doi.org/10.1016/j.iot.2020.100292
Muralidhara, S., Hegde, N., & PM, R. (2020). An internet of things-based smart energy meter
for monitoring device-level consumption of energy. Computers & Electrical Engineering,
87, 106772. https://doi.org/https://doi.org/10.1016/j.compeleceng.2020.106772
Naderipour, A., Abdul-Malek, Z., Ahmad, N. A., Kamyab, H., Ashokkumar, V.,
Ngamcharussrivichai, C., & Chelliapan, S. (2020). Effect of COVID-19 virus on reducing
GHG emission and increasing energy generated by renewable energy sources: A brief
study in Malaysian context. Environmental Technology & Innovation, 20, 101151.
https://doi.org/https://doi.org/10.1016/j.eti.2020.101151
Pipattanasomporn, M., Kuzlu, M., Rahman, S., & Teklu, Y. (2014). Load profiles of selected
major household appliances and their demand response opportunities. IEEE
Transactions on Smart Grid, 5(2), 742–750. https://doi.org/10.1109/TSG.2013.2268664
Pocero, L., Amaxilatis, D., Mylonas, G., & Chatzigiannakis, I. (2017). Open source IoT meter
devices for smart and energy-efficient school buildings. HardwareX, 1, 54–67.
https://doi.org/https://doi.org/10.1016/j.ohx.2017.02.002
Rafsanjani, H. N., & Ghahramani, A. (2020). Towards utilizing internet of things (IoT) devices
for understanding individual occupants’ energy usage of personal and shared
appliances in office buildings. Journal of Building Engineering, 27, 100948.
https://doi.org/https://doi.org/10.1016/j.jobe.2019.100948
Rafsanjani, H. N., Ghahramani, A., & Nabizadeh, A. H. (2020). iSEA: IoT-based smartphone
energy assistant for prompting energy-aware behaviors in commercial buildings.
Applied Energy, 266, 114892.
https://doi.org/https://doi.org/10.1016/j.apenergy.2020.114892
Shah, A. U. M., Safri, S. N. A., Thevadas, R., Noordin, N. K., Rahman, A. A., Sekawi, Z., Ideris,
A., & Sultan, M. T. H. (2020). COVID-19 outbreak in Malaysia: Actions taken by the
Malaysian government. International Journal of Infectious Diseases, 97, 108–116.
https://doi.org/https://doi.org/10.1016/j.ijid.2020.05.093
13You can also read