Nordic and Baltic Sea Winter Power Balance 2022-2023 - 19.10.2022 Regional adequacy working group under Baltic Sea System Development Steering ...
←
→
Page content transcription
If your browser does not render page correctly, please read the page content below
Nordic and Baltic Sea
Winter Power Balance
     2022–2023

                                                 19.10.2022
                     Regional adequacy working group under
         Baltic Sea System Development Steering Committee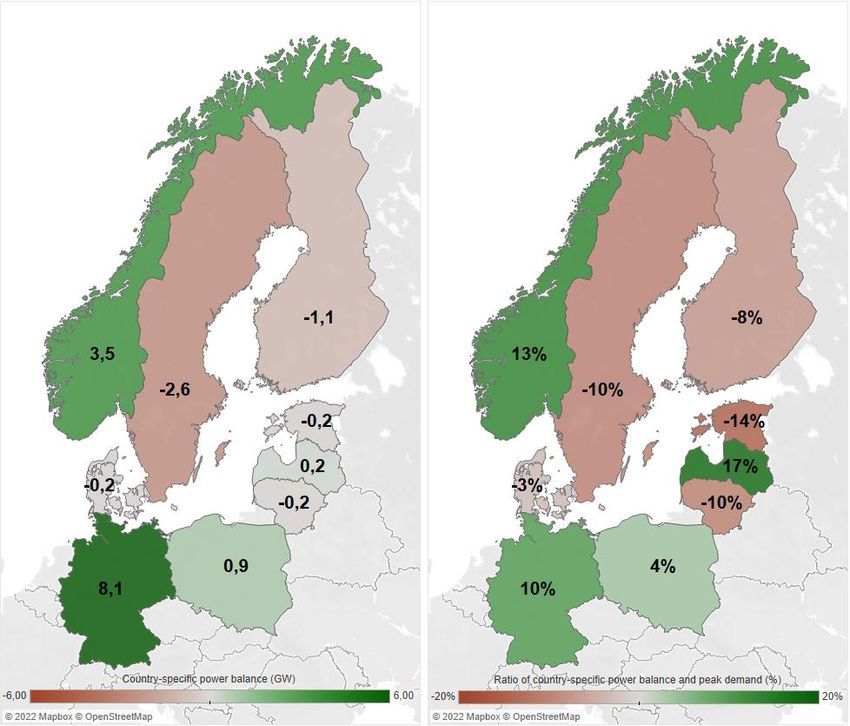
Overview of the report
1.   Executive summary
     •   Main messages
     •   Risk mitigation actions
     •   Situation description
2.   Methodology
3.   Winter Power Balance 2022–2023
     •   Regional power balances
     •   Country-specific power balances
4.   Winter Energy Balance 2022-2023
5.   Country comments
Appendix: supporting illustrations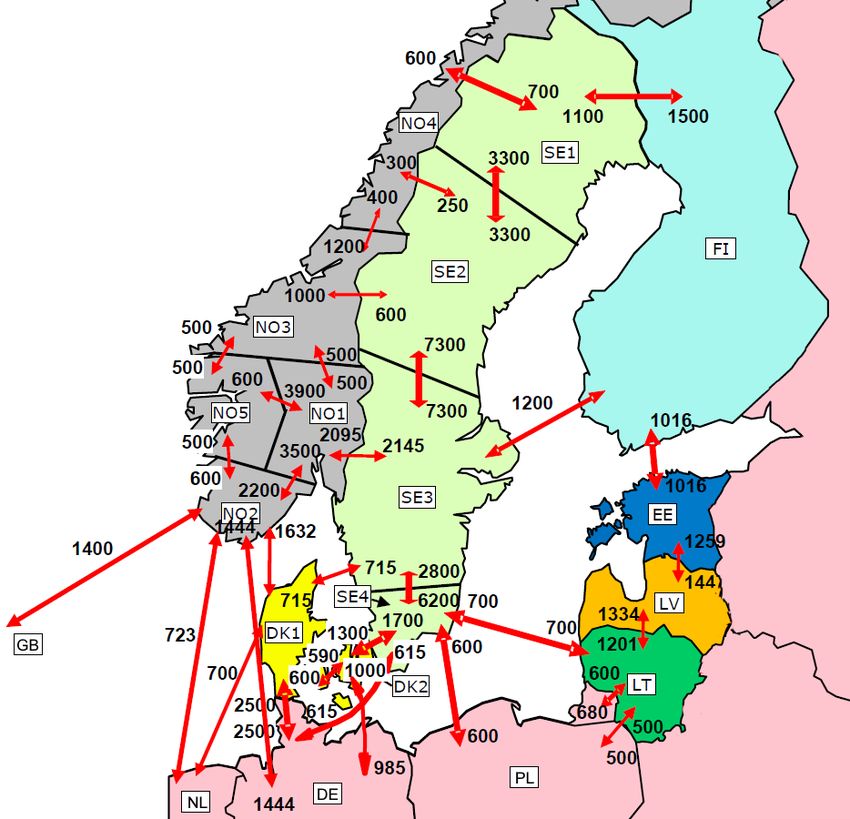
Executive summary
Executive summary
                                                                           Main messages

•   The Nordic and Baltic Sea region will experience one of the most challenging winters in recent history due to several unfavourable conditions in the European
    energy markets.
      •    The war in Ukraine is causing a lot of uncertainties in the electricity, gas, and coal markets as imports from Russia have been reduced or ended.
      •    Long drought during the summer in Europe has left hydro reservoir levels lower than usual before the winter.

•   Nordic and Baltic Sea region sees positive power balances for both average and cold winter, however, the margins are small (3…8%) with many uncertainties.
    The uncertainties are linked in the availability of electricity generation with gas, nuclear, hydro and wind, which could change the balance significantly.
      •    Even though the regional balance is positive, the excess is not distributed evenly between the countries. It calls for good coordination between system
           operators and high availability of the transfer capacities between the zones to deliver the energy to where it is most needed.
      •    If uncertainties take place, price areas might need to activate TSOs’ reserves to avoid demand curtailment. An analysis of this resolution does
           not identify the need for demand curtailment, but it is not impossible, and TSOs are informing the public and making contingencies to be prepared for it.

•   Regardless of electricity adequacy, it is expected that the electricity prices will be high throughout the winter due to limited supply of different fuels and general
    uncertainty in the energy markets. Therefore, it is beneficial for every consumer to analyse their electricity use, which also helps with the electricity adequacy.
      •    Currently around 5% of the electricity use in the region is price sensitive i.e. consumers lower their electricity use at certain price levels. Enabling more
           flexibility in the demand sector lowers prices and helps with the adequacy of electricity.

•   An energy balance was analysed on a regional level for two separate cases – an average winter consumption and the coldest projected winter’s consumption.
    In these cases, the Nordic and Baltic Sea region reaches an electricity demand of around 620 and 646 TWh, respectively.
      •    It is expected that around 70…75% of this could be generated from energy sources that do not have any issues with fuel supply. Remaining 25…30%
           would need to be generated from coal, lignite, or gas. Based on current analysis of fuel supply this can be covered.
      •    Wind power and hydro contribute the most to the energy balance during both average and coldest winter. This helps to conserve a lot of fossil fuels like
           coal, lignite and gas, which can be used during times with low renewable production.
Risk mitigation actions
What is being done to lower the risks?
Short term
• Several communication campaigns are ongoing which will inform the public of the awaiting challenges; guides on how to save energy and lower energy bills; how to act during
crisis etc.
• Electricity saving measures are being implemented. A mandatory 5% reduction in peak hours and additional voluntary target of 10% reduction for overall electricity
consumption will be implemented in all Member States.
• Contingency plans during gas shortage and/or electricity shortage are developed, rehearsed and improved.
• Decommissioning plans are being reviewed.
• The transmission system operators are closely monitoring all the developments in the electricity system. Security of supply analyses for gas and electricity are made on a
European level together with ENTSO-E and ENTSO-G. The system operators are also doing analyses on a regional and country level to identify risks before they occur.
• Insights from these will be shared with the public and market participants in the form of press releases, webinars, published analyses, interviews and social media.
• Different support schemes are implemented to help the energy consumers with their bills.
• Preparations of administrative actions in the energy market to save fuel or redistribute it if the need arises.
Long term
• The dependence from Russia in the energy sector is being decreased. The Baltics are preparing for desynchronization from the Russian grid. Fuel supply chains are being
diversified. Overall assessment of supply chains is taking place.
• Coordination between TSOs on unit outages is being developed.
• More ambitious plans on RES deployment and grid reinforcements are developed to manage new distributed energy sources.
• Flexibility markets are being developed and matured.Situation description
What are the main causes of current challenges in the European energy system?
• The energy markets in Europe are experiencing unforeseen challenges in the form of rapid price increase for most energy carriers and
major uncertainties on adequacy of fuels and electricity. These are mainly caused by three simultaneous troublesome events: war,
drought, and extensive maintenances due to aging of thermal power plants.
• Russia invaded Ukraine on the 24th of February 2022. As a response to the aggression the EU Member States have agreed to sanction
the energy imports from Russia, to cut off an important source of income for Russia.
• During previous years, Europe had relied on Russia for about 40 % of its natural gas supply. The supply is now reduced and is
considered unreliable. The situation is complex and reducing the reliance of Russian energy imports requires alternative fuel supply
chains, which may take years to set up. The reduced supply and little elasticity of demand for gas have significantly increased the natural
gas prices around Europe, for example the natural gas price on the Dutch TTF market in August 2020 was 11 €/MWh, in August 2021 it
was 50 €/MWh, in August 2022 it reached 349 €/MWh, but has since lowered to 169 €/MWh as of 3rd October 2022.
• In addition to different fuels, the Baltics and Nordics were also importing around 7 TWh of electricity last winter from Russia, which is now
completely cut-off. This reduction in imported electricity and shortage of fuels directly affects the electricity prices in Europe, which has
reached the market cap twice during the last 6 months. Electricity is also essential for the industrial sector, meaning that the price of
electricity is also one of the main drivers of inflation in Europe.
• In addition, the effects of climate change are becoming more evident, as Europe is experiencing the biggest drought in 500 years, which
reduces hydro electricity generation and further complicates the transporting of energy carriers like coal. Some rivers have dangerously
low water levels, which makes ship transportation harder.
• At the end of 2021, it was discovered that many French nuclear reactors have corrosion in the piping, which meant that a systemic
inspection must be conducted for the power plants. Around half of the French nuclear fleet is offline for maintenance and it is still unclear
when it will be back on the market.
• All these events combined are seriously challenging the European power market.Situation description
How does it affect the Nordics and the Baltic Sea area countries?
In addition to the system-wide challenges the Nordic and Baltic Sea area system operators have identified several local vulnerabilities, which are
related to the electricity system specifics of each country:
• The Baltic States: Estonia, Latvia, and Lithuania, have been preparing to disconnect from the IPS/UPS (Russian) electricity system and connect to
the Central European electricity system for several years now. According to the initial timeline synchronous work with central-EU should be
achieved by 2026, however, considering the current geopolitical situation the risks of being disconnected from the Russian system before 2026
have significantly increased. The Baltics’ system operators with many partners have prepared for an emergency disconnection and are able to
synchronize with the Central European system within hours if the need arises. The synchronization project, however, still has many other important
milestones and new equipment to be installed that would ensure a long-term safe operation. In addition, due to substantial installed capacity in gas-
fired power plants, secure operation of the Baltic power system depends on improving diversification of natural gas supply routes.
• In the southern part of Norway, the reservoir levels for hydro are very low due to an extraordinarily dry previous winter and summer.
Together with the overall energy crunch in Europe puts Norway in a position where production from hydro reservoirs needs to be reduced to be
sure to handle security of supply in case of a long cold winter with reduced inflow and import possibilities. For Norway, the most critical time horizon
is not winter, but the spring when the temperatures are still low, and snow has not yet melted because then the water levels are at its lowest. The
situation is carefully monitored by the system operator and national authorities.
• In Germany, coal-fired reserve power plants have been permitted to return to the market and coal-fired power plants that are planned to be shut
down in the next few months can be kept in the market with the aim to reduce the gas demand for electricity generation. In Germany, the operation
of the three remaining nuclear power plants Emsland, Isar 2 and Neckarwestheim 2, which were otherwise due to be decommissioned by end of
2022, shall be extended until April 15, 2023. The most critical concern for Poland is the shortage of coal. 87% of the total thermal capacity is using
either coal or lignite for fuel. Currently the coal storage facilities of power plants have reached low fuel stockpiles and coal import from Russia has
ended, resulting in decreased resupply. Poland also has domestic coal production, but it is not enough to cover the missing supply and increasing
production takes time, longer than what is left until winter.
• Finland, like other countries bordering Russia, had a notable import of natural gas and electricity from Russia. Both imports have been cut off in
May 2022, weakening gas and electricity supply. Fortunately, Olkiluoto 3 nuclear power plant is in test production phase and the regular electricity
production is scheduled to start on 14th of December. The gas import by pipeline is replaced by leasing a floating LNG terminal with a regasification
capability. There is on-going construction of port structures for the terminal both in Finland and Estonia to secure the gas supply.Analysis methodology
Methodology
                      Adequacy of electricity is analysed with a power & energy balances

                                                                                           Regional capacity
                                                                                           vs regional peak
                                                               Market-based                (cold & average)
                                                                resources
                                   Winter Power
                                Balance (snapshot                                          Country capacity
                                 at peak demand)                                           vs country peak
                                                                                           (cold & average)
                                                            All resources (with
    Winter adequacy                                           TSO reserves)
                                                                                           Regional capacity
                                                                                           vs regional peak
                                 Energy Balance                                            (cold & average)

                                                                Fuel supply                Country capacity
                                                                 analysis                  vs country peak
                                                                                           (cold & average)
Methodology: Power balance
Can the peak demand of the winter be covered with available resources?
• Deterministic approach assesses power balance (domestic generation – domestic consumption) of the expected annual
peak demand hour for the upcoming winter in the Nordic and Baltic Sea countries. The highest peak demand usually
occurs in January
• Focus is on Nordic and Baltic Sea region, which comprises of Norway, Sweden, Finland, Denmark, Germany,
Poland, Estonia, Latvia and Lithuania.
• Normal conditions refer to an expected (median) peak demand during winter months for each country. Severe
conditions refer to a highest expected peak demand for each country (using 95th percentile or equivalent method).
• Information about the available generation capacity of the upcoming winter was gathered by ENTSO-E in the end of
September. TSO-s are analyzing how much of the available capacity can contribute to covering of the demand
peak. No interconnectors or imports are included in the quantitative analysis, but these are considered qualitatively
• This analysis is using the same input data as the probabilistic, ENTSO-E Winter Outlook 2022-2023. Both are using
the PEMMDB (Pan-European Market Modelling Database) for input data.Methodology: Power balance
Can the peak demand of the winter be covered with available resources?
Production
• Net generation capacity is based on each TSOs data, which has also been submitted to the ENTSO-E Winter Outlook analysis
• Generation capacity is separated into market-based and all resources (including non-market-based resources such as strategic reserves or balancing reserves). The approach of all
resources quantifies what is the capacity at TSOs disposal before resorting to demand curtailment due to adequacy problems.
• Available generation capacity during peak demand period in January has been assessed for the analysis, which considers:
• Planned unavailability of generation units
• Country-specific availability of thermal and hydro generation is based on each TSOs estimates
• Region-specific availability of wind generation is based on regional analysis conducted by the TSO experts. Availability of wind generation is set to 11% for each country, which reflects
the lowest 5th percentile of wind generation in the region during January-February according to Pan-European Climate Database data
• Availability of solar generation is assumed to be 0% for each country
• Average availability of weather-dependent other non-RES and other RES generation in January based on PEMMDB.
Consumption
• Peak demand of each country is based on ENTSO-E Winter Outlook demand data, which considers interdependent climate data and is
adjusted according to expectations of the upcoming winter season
• Average winter power balance considers expected peak demand. P50 peak demand is the 50th percentile i.e. median of annual peak demand over the 35 climate years
• Cold winter power balance considers highest expected peak demand. This peak demand is the third highest peak demand over the 35 climate years and roughly equals to the “coldest 1
of 10 winters” scenario from the previous Winter Power Balance reports.
• Simultaneous regional peak demand is the highest same-time peak for all countries for one climate-year. This is always lower than sum of separate peak demand per country and is
mainly driven by countries with high demand.
• Price-sensitive demand or demand side response has been highlighted in the „all resources“ scenario
• During high-price periods, the price elasticity of consumption might reduce the peak demand compared to the presented values. The extent of this is not seen in the map but is seen
highlighted in the regional „all resources“ graphs.Methodology: Energy balance
How much electricity can be produced from sources without fuel supply issues?
• Based on weather conditions the winters might be significantly different from the system adequacy viewpoint.
• In this analysis two scenarios are chosen- winter with an average consumption and the winter with the highest overall
electricity consumption
• For the Baltic Sea region these values are 620 TWh and 646 TWh respectively during October until April.
• Corresponding available resources were analyzed by creating a simplified merit order based on whether there are strong
indicators of shortage of such a fuel on the market or not. The last fuels in the merit order are gas, coal, and lignite, which
were identified as critical.
• In this balance interconnector limits and hourly demand is not considered which simplifies the balance significantly, but
still enables an overview of what sources of energy are available in the region.
• The average and cold winter were analyzed by
• Assessing the theoretical maximum production from different sources if there would not be any shortage of fuel.
This was based on known availability of power plants, their forced outage rates and availability profiles depending
on the weather.
• Considering the known restrictions of fuel supply and seeing how much critical fuel would be needed in the Baltic
Sea region to cover its consumption for the winter.Winter Power Balance
2022–2023Regional power balances (1/2)
Market-based resources
• During a peak demand it is estimated that around 196 GW of market-based generation will be available in the region.
• The peak demand of the region is estimated to be 182 GW during an average winter. This makes the power balance
to be positive by 14 GW.
• The peak demand is estimated to be 191 GW during a cold winter and the power balance is positive by 5 GW.
All available resources
• In addition to the market-based resources there are also around 5 GW of non-market resources such as strategic
reserves and balancing reserves. This capacity is part of the available supply but will not participate in the day-ahead
electricity market.
• The activation of reserves is very situation specific- some might be activated before demand curtailment while other
still need to be held to balance outages in the energy system. It comes down to operational decisions of TSOs to
activate balancing reserves to cover demand.
• It is estimated that around 9 GW of demand is price sensitive during the peak hour and would lower its demand before
the market cap of 4000 €/MWh. Most of the other non-market resources will only be activated if the market-based
capacity is exhausted and price cap is achieved.Regional power balances (2/2)
Market-based resources All resources
210 210
5 5
5 7
7 9 9
180 14
180 9
13 9
24
24
150
150
28
27
120
120
30
GW
GW
30
90 181
172
90 181
172
60
60 93
91 30
30 33
32 0
Available supply Gas capacity and reserves Average winter peak demand Cold winter peak demand
0 Germany Norway Poland Sweden
Available supply Gas capacity Average winter peak demand Cold winter peak demand
Finland Denmark Baltics Demand side response
Germany Norway Poland Sweden Finland Denmark Baltics Gas capacity Demand side response Gas capacity Out of market resourcesCountry-specific power balances (1/2)
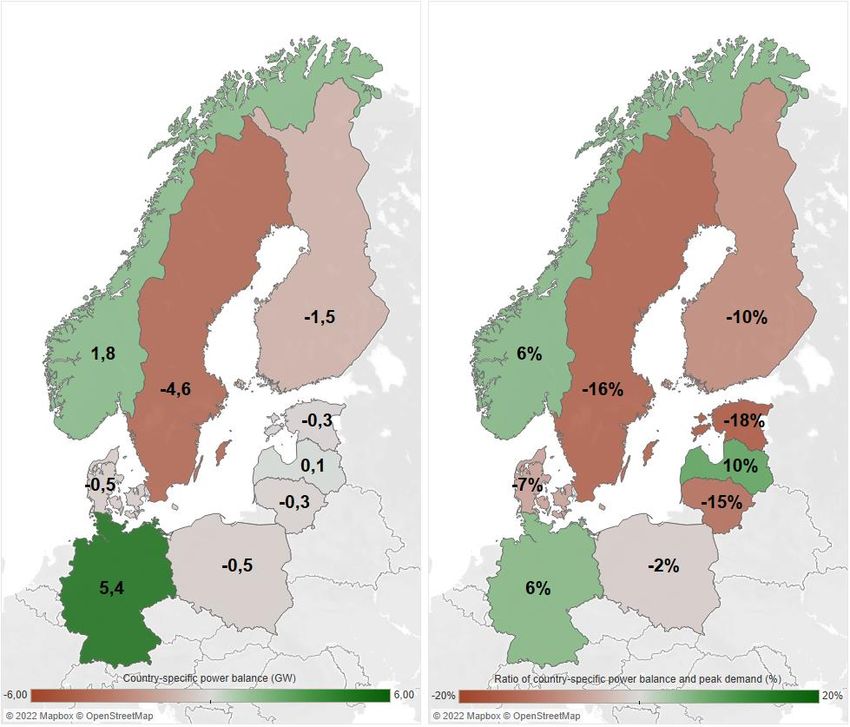
• The excess of supply that is seen from previous slide, regional balance, is distributed unevenly between the countries
and it is mostly in Germany and Norway. For it to reach where it is most needed a good coordination between system
operators and high availability of the transfer capacities must be ensured.
• Imports from neighboring countries can only happen if there is both available transmission capacity and a production
surplus in the exporting country, something that may be limited during periods of high demand in the region. A map
showing maximum transmission capacity between bidding zones can be found in the appendix.
• Based on the power balance Latvia, Germany, Norway and Poland can cover their peak demand in an average winter
with their local resources.
• Latvia, Germany and Norway can also cover the cold winter peak demand locally, but other countries need to rely on
imports from neighboring countries to meet the peak demands.
• It is expected that some of the demand will react to the price signals coming from the market and lower their
consumption. Some countries can also activate non-market resources if market-based resources, including DSR, and
import is not enough. More detailed graphs can be found in the appendix. The resolution of this analysis cannot
identify whether there is a need for demand curtailment, but it is not impossible. Some TSOs have made
communication campaigns towards the public to notify what steps are taken in that case.Country-specific power balances (2/2)
Average winter peak demand Cold winter peak demand
Ratio of power balance and peak demand Ratio of power balance and peak demand
Power balance (GW) Power balance (GW)
(%) (%)
Reminder: These country peak demands can happen at different times and should not be summed together. The regional simulateneous peak demand is always lower than sum of individual country peak demands.Winter energy balance 2022-2023
Regional energy balance based on only
availabilities
Average winter
•   Hydro generation would be able to produce the most
    energy in the region with 169 TWh, with gas generation
    second with 162 TWh wind generation is third with 156
    TWh. The contribution from renewables is significant and
    every MWh of energy produced from these sources means
    that fuel for dispatchable generation can be saved for times
    when intermittent renewables are not producing.
Coldest winter
•   Significant difference from the previous climate year can be
    seen in the wind generation, as it produces 13 TWh less
    than in the other scenario.
•   Generation units like CHP plants have a weather
    dependent electricity production. Many such plants fall
    under the biofuels category and have a higher availability
    during a colder winter- this means that 5 TWh of more
    electricity could be produced from biofuels.
•   Thermal plants that use nuclear, oil, lignite, coal and gas
    have the same availability as during an average winter.
    Their importance increases with a cold weather as demand
    grows and the share of renewable sources decreases.
Regional energy balance considering known
restrictions
Average winter
• By comparing available energy sources during winter
and total consumption while taking into account known
restrictions in the fuel supply for coal and lignite it can be
seen that Baltic Sea area could cover all of its
consumption without gas. This is a high-level overview,
and an hour-by-hour dispatch would show many
bottlenecks between regions and fuel availabilities.
Coldest winter
• In this case around 23 TWh of electricity is needed from
gas, which translates to around 48 TWh of gas for the
winter.
• For reference as of 11th October there is 291 TWh of
gas stored in gas storages around the Baltic Sea area
countriesCountry comments
Country comments
Germany
•   In Germany, coal-fired reserve power plants have been permitted to return to the market and coal-fired power plants that were planned to be shut down in the
    next few months can be kept in the market a little longer with the aim to reduce the gas demand for electricity generation.
•   German gas power plants previously contracted as non-market resource cannot return to electricity market due to the existing legislation.
•   In Germany the operation of the three remaining nuclear power plants Emsland, Isar 2 and Neckarwestheim 2, which were otherwise due to be decommissioned
    by end of 2022, shall be extended until April 15, 2023. The relevant legal framework shall be revised at short notice.
•   The probabilistic approach of the ENTSO-E Winter Outlook is state-of-the-art. National and geographically limited analyses should also be conducted based on
    probabilistic methods, otherwise (e.g. using power balances) a limited and misleading view on adequacy could be shown.

Denmark

The Danish Energy Agency has imposed on Ørsted to continue and reestablish the operation of the following three power plants: Esbjergværket Blok 3,
Studstrupværket Blok 4 and Kyndbyværket Blok 21.
•   Esbjergværket Blok 3 were supposed to be decommissioned on March 31st in 2023 and is consequently already counted in the power balance due to the cut-off
    date of 1st of January.
•   The two remaining power plants are currently being prepared to be recommissioned until 30th of June 2024 and Esbjergværket Blok 3 will continue operation
    until this date as well. However, Ørsted has not yet given a final date for when Studstrupværket Blok 4 and Kyndbyværket Blok 21 will be ready to produce -
    currently they are undergoing maintenance and being readied for operation as soon as possible. Consequently, their availability at the cut-off date of 1st of
    January is associated with some uncertainty, though as a best estimate their combined 620 MW of electricity capacity has been counted in the power- and
    energy balance.
Country comments Norway There is a worry about reservoir levels in Southern Norway for the winter. The reservoir fillings are at very low levels due to low precipitation and high export caused by high continental fuel and power prices since previous winter and up to now. Also limited transfer capacity from north to south in Norway and between Norway Sweden may have affected this situation. Some actions are taken by Statnett and the authorities, as rising attention level to yellow. There are still no restrictions on generation and/or export, but the producers are kindly requested to save water for the coming winter. To secure the supply in case of reduced import possibilities further actions may be taken. More restrictions may be imposed by the authorities during the autumn. Recently the authorities have increased the monitoring of the generation from the major reservoir generators in Southern Norway. This is reported by Statnett. Statnett has also been instructed to work out an analysis of extremely severe situations (SAKS) which was finished within 1st October. Under normal situations, there should be enough import capacity to cover any deficit. But if there is no generating surplus in other countries to export to Norway, there may be a problem. Rationing of demand may then be necessary in a short period before the snow melting starts in the spring. Especially if there will be low precipitation during the autumn and winter. Anyhow the high power prices are expected to lower the demand somewhat, both by customers reducing the demand and companies shutting down. And the demand is usually lower in spring than mid-winter. Before reservoirs run empty, available generating capacity is only reduced by minor amounts due to reduced head of water etc. If the reservoirs are empty, the generating capacity will be reduced dramatically. This capacity will then not be available in the market. Hence the issue in Norway is more lack of energy or water resources during the spring, rather than an adequacy problem during the winter. In many ways this is a similar problem as gas shortage in Europe. There is a significant higher level of uncertainty of several factors important for the energy sectors in the coming months. Sweden Sweden’s power balances show need for import during peak conditions. The power sector in Sweden is only to a very limited degree dependent on fossil fuel. However, the development in other countries may affect adequacy in Sweden, mainly relating to the availability of import. The Swedish Energy Agency has launched an information campaign to lower demand, and routines for load shedding are rehearsed. Northern Sweden (SE1 and SE2) have a strong surplus, while southern Sweden (SE3 and SE4) has a large power deficit. As such, transfer capacity from north to south is critical for adequacy, and very often runs at max available capacity. At times, southern Sweden is dependent on imports from other countries as well. The nuclear reactor Ringhals 4 is currently unavailable and is not included in the power balance figures in this report. The plant is planned to return on Jan 31, but the outage period could be prolonged which would lower adequacy for the late winter. Sweden has a strategic reserve of 562 MW, which is not included in the figures for market-based power balance.
Country comments
Finland
Fingrid has informed consumers that they should be prepared for power shortages in case of unfavorable scenarios. In typical and mild winters, the risk of power shortages is comparable
to the previous years. However, there are several uncertainties that increase the risk of a power shortage. These and other notable developments affecting adequacy include:

•   Schedule for the commissioning of the Olkiluoto 3 nuclear power plant. A possible delay in the commissioning of the plant would significantly reduce the adequacy of electricity in
    Finland.

•   Availability of imports from Sweden and Estonia. In previous years during peak consumption, significant amounts of electricity have been imported from Sweden and Estonia, as well
    as from Russia.

•   Possible failures of significant domestic power plants or electricity transmission connections in operation, as well as problems with the availability of power plant fuels, especially
    natural gas.

•   The rapid growth in wind power capacity contributes to improving the availability of electricity in Finland, but the impact of wind power on the adequacy of electricity is determined by
    wind conditions.

•   Energy saving and timing the use of electricity outside of peak morning/afternoon hours improves adequacy of electricity significantly. Finnish electricity use decreased by around 7 %
    in September 2022 compared to last year, and therefore the peak demand expectation during cold winter was decreased from around 15 100 MW to around 14 400 MW.

Estonia
We see that there is enough generation to meet the peak demands, however, compared to previous years the risks have increased significantly which is mainly caused by the Russian
aggression in Ukraine.

To accelerate the independence from Russia in the energy sector a close collaboration between European countries is a must.

The probability that demand curtailment is needed during the winter is low, however, should the risks realize we have developed contingency plans which least affect the consumer.
Country comments Latvia TSOs of the Baltic States and Poland have prepared an emergency synchronization solution in case if this could become necessary. In addition, steps had been made to accumulate a substantial amount of gas in the Latvian Inčukalns underground gas storage necessary for the 2022/2023 heating season. But, possible unplanned desynchronization from IPS/UPS power system could lead to increased generation and reserves adequacy risks during the next winter. In case of urgent desynchronization from IPS/UPS power system due to unexpected disconnection from Russian side there could be some problems with generation adequacy and system services. Latvian TSO is doing everything to mitigate these actions and keep secure system operation for the coming winter, but in case of urgent and unexpected desynchronization most likely we have to rely on electricity imports from neighboring countries. Lithuania Since the basis of traditional production in Lithuania is a few old gas-fired units, sufficiency is ensured by imports. During the winter period, similar as last winter period, the adequacy of the Lithuanian electricity system will be negative and ~200 MW of import capacity will be needed to meet the peak demand. Therefore, we see the risk that the situation in other power systems may lead to restrictions on import possibilities (cascading effect). Poland Current tight adequacy situation and concerns on coal and also gas supply availability makes all dispatchable generation to be very important for being able to ensure secure and adequate operation of the Polish power system. Significant reduction of coal supply will negatively affect the Polish load/generation balance and threaten security of supply. The exact extend of potential electricity generation shortages in the winter period will depend on the situation with respect to gas supply to EU. Also, in case of significant gas shortages in Europe, affecting gas generation in a number of EU countries, we expect a change of power flows pattern across Europe (transfer capacities for the market purpose).
Appendix:
Supporting illustrations of the report
Transfer capacities
Transfer capacities between bidding zones are important for power
adequacy. It enables a surplus area to support an area with deficit.
Shown in this map is maximum NTCs (net transfer capacities) for
2022. The actual capacity varies due to grid conditions, power
flows and maintenance and may be lower (or zero) for a given
hour.
Market-based power balances by countries
              8,0                                                     100,0                                                   35,0

                                                                       90,0
              7,0
                                                                                                                              30,0
                                                                       80,0
              6,0
                                                                       70,0                                                   25,0

              5,0
                                                                       60,0
                                                                                                                              20,0

              4,0                                                      50,0

                                                                                                                              15,0
                                                                       40,0
              3,0

                                                                       30,0                                                   10,0
              2,0
                                                                       20,0
                                                                                                                               5,0
              1,0
                                                                       10,0

              0,0                                                       0,0                                                    0,0
                      DK00     EE00     LT00     LV00                                     DE00                                         FI00    NO00      PL00     SE00
Supply                 6,8      1,4      1,8      1,5     Supply                          91,4                   Supply                12,9    29,9      26,6     23,6
Average winter peak                                       Average winter peak                                    Average winter peak
                      7,0       1,6      2,0      1,3                                      83,2                                        14,0     26,4     25,7     26,2
      demand                                                    demand                                                 demand
Cold winter peak                                          Cold winter peak                                       Cold winter peak
                      7,3       1,7      2,2      1,4                                      86,0                                        14,4     28,1     27,1     28,2
    demand                                                    demand                                                 demand

Supply                       Average winter peak demand   Supply                    Average winter peak demand   Supply                       Average winter peak demand
Cold winter peak demand                                   Cold winter peak demand                                Cold winter peak demand
All resources available before demand curtailment
8,0 DK 35,0 NO 16,0 FI 1,8 LV
7,0 14,0 1,6
30,0
6,0 12,0 1,4
25,0
1,2
5,0 10,0
20,0 1,0
GW
GW
GW
GW
4,0 8,0
15,0 0,8
3,0 6,0
0,6
10,0
2,0 4,0 0,4
1,0 5,0 2,0 0,2 30,0 PL
0,0 0,0 0,0 0,0 25,0
Supply Average Cold winter Supply Average Cold winter Supply Average Cold winter Supply Average Cold winter
winter winter winter winter 20,0
Price sensitive demand Price sensitive demand Price sensitive demand Price sensitive demand
GW
15,0
Inflexible demand Inflexible demand Inflexible demand Inflexible demand
10,0
Supply Supply Supply Supply
5,0
100,0 DE 30,0 SE 1,8 EE 2,5 LT 0,0
90,0 1,6 Supply Average Cold winter
80,0 25,0 2,0 winter
1,4
70,0
20,0 1,2 Price sensitive demand
60,0 1,5
1,0 Inflexible demand
GW
GW
GW
GW
50,0 15,0
0,8
40,0 1,0 Supply
30,0 10,0 0,6
20,0 0,4 0,5
5,0
10,0 0,2
0,0 0,0 0,0 0,0
Supply Average Cold Supply Average Cold winter Supply Average Cold winter Supply Average Cold winter
winter winter winter winter winter
Price sensitive demand Price sensitive demand Price sensitive demand Price sensitive demand
Inflexible demand Inflexible demand Inflexible demand Inflexible demand
Supply Supply Supply SupplyYou can also read