Economy-wide impact of changing water availability in Senegal: an application of the JRC.DEMETRA CGE model
←
→
Page content transcription
If your browser does not render page correctly, please read the page content below
Economy-wide impact of changing water availability in Senegal:
 an application of the JRC.DEMETRA CGE model

 Hasan Dudu, Emanuele Ferrari, Alfredo Mainar Causape and Martina Sartori

 April 2018
 Preliminary incomplete draft of the paper. Please do not quote and circulate.

Abstract
This study assesses the structural consequences of water availability scenarios in Senegal, following
a multidisciplinary approach and a sequential integrated modelling methodology. This includes an
assessment of future water availability, crop response to water availability change and a general
equilibrium macroeconomic analysis of changes in agricultural productivity.
Understanding the role of water as an economic resource is requires a complex integrated approach,
to account for the role of ecosystems in producing and storing water, and a thorough analysis of its
links with all sectors in the economy. We therefore follow an integrated and sequential modelling
approach, where models coming from different disciplines and working at different time and spatial
scales are soft-integrated. We advance the literature by coupling a dynamic computable general
equilibrium (CGE) model, tailored on the economic features of developing countries, with separate
water-hydrological and crop-biophysical models, where water is modelled explicitly with its links to
the water cycle and agricultural production. In such a set-up, changes in key parameters of the CGE
model reflecting changing in water availability are provided by the complementary models. The CGE
model is calibrated on a self-developed 2014 Social Accounting Matrix for Senegal, disaggregated
into the 14 Senegalese administrative divisions.

JEL codes: C68, Q25, O55.
Keywords: water scarcity, hydro-crop-economic modelling, agricultural productivity, water use
competition, socio-economic scenarios.

 1
1. Introduction
Water is crucial for human life, for the provision of essential ecosystem services and for many
economic activities. Water is also a scarce good, unevenly distributed across space. Its availability is
often season-dependent and highly vulnerable to future climate change (IPCC, 2014).
Agriculture is by far the biggest global user of freshwater resources and consequently highly
vulnerable to climate change as well. In most developing countries, the agricultural sector provides
the main livelihood and employment for most of the population and contributes considerably to
national GDP. Therefore, possible reductions in agricultural production caused by climate change in
the near future could seriously weaken food security and worsen the liveli hood conditions for the
rural poor (REF).
Senegal is among the developing countries that may be affected by changing water availability. This
country heavily relies on water resources provided by four large transnational hydrological systems,
of which the Senegal river basin is the largest. Currently, the country is not suffering a condition of
water stress, as only 8% of total available water resources are withdrawn for economic uses (World
Bank Statistic, 2018). However, the situation may worsen in the near feature as climate change is
expected to negatively affect the availability of water resources and runoff in the coastal countries
of West Africa (IPCC, 2014). A steadily decline in annual precipitations has been observed since the
end of the 1960s and the average temperature are expected to increase by about 1°C by 2030 under
the RCP4.5 scenario (Kriegler et al., 2012), affecting crop evapotranspiration. Droughts have become
more frequent since 1950 and rainfall per rainy day is expected to decrease in the near future, as
well as land suitable for cropping. Under this scenario, the Senegalese agricultural production is put
at risk as rain-fed agriculture represents about 80% of total production.
A second reason of concern comes from the demand side. Currently, agriculture in Senegal is
responsible for 93% of total water withdrawals. Agriculture is an important sector of the economy,
contributing to a substantial share of the GDP (17.5%) and employing one third of total labor. 1
Understanding to what extent water resources availability may constitute a bottleneck to economic
growth is therefore crucial, for a country whose well-being relies heavily on rain-fed and irrigated
agriculture (Roson and Damania, 2017). The remaining 7% is withdrawn by the industry and for
domestic uses. Fast industrialization, economic growth, increasing population and changing dietary
habits will increase the competition on the use of water among sectors, challenging the capacity of
water resources to ensure future food security (Oyebande and Odunuga, 2010). For example, under
the SSP2 "Middle of the Road" scenario (Kriegler et al., 2012; KC and Lutz, 2014; O’Neill et al., 2017),
GDP and population are expected to grow by about 160% and 50% with respect to the 2010 levels .
The aim of this research is assessing the structural economic consequences of changing water
availability in Senegal, with a focus on the agricultural sector, under uncertain climate change and
socio-economic scenarios as described in the Representative Concentration Pathways (RCPs) and
Share Socio Economic Pathway (SPPs), at the year 2030. In such a context, evaluating the effects of
changing water availability for the different economic sectors requires a complex modelling
approach, where separate models are integrated, possibly under shared and common assumptions.
Indeed, the modelling framework must capture both the economic processes at play and the
biophysical condition of the water and crop systems. Further, the representation of water in many
economic models is often "stylized", given the absence of water markets in most countries
(Robinson and Gueneau, 2013). Since there is often no economic transaction, water use is not
commonly reported in the national economic accounts, which hampers the analysis of water
resources with economic models (Calzadilla et al. 2013).

1
 For the other countries located in the Senegal river basin the agricultural sector is even more important, contributing to 20.2% (Guinea),
27.4% (Mauritania) and 42.1% (Mali) of total GDP. Source: https://data.worldbank.org

 2
In this study, we therefore follow an integrated and sequential modelling approach, where models
coming from different disciplines and working at different time and spatial scales are soft-integrated.
A number of studies propose a similar modelling integration, but focus on other countries and river
basins (Robinson and Gueneau, 2013; Kahsay et al., 2017), or take a global perspective (Liu et al.,
2017). We advance on this literature by coupling a dynamic computable general equilibrium (CGE)
model, tailored on the economic features of developing countries, with separate water-hydrological
and crop-biophysical models, where water is modelled explicitly with its links to the water cycle and
agricultural production. In such a set-up, changes in key parameters of the CGE model reflecting
changing in water availability are provided by the complementary models. The CGE model is
calibrated on a self-developed 2014 Social Accounting Matrix for Senegal, disaggregated into the 14
Senegalese administrative divisions.
The remainder of the paper is organized as follows. The next section explains how water has been
treated in the CGE modelling and water literature, and presents the DEMETRA model. The modelling
framework and details of the sequential modelling procedure are provided in Section 3. Section 4
describes the simulation results. A final section concludes.

 2. Water and Computable General Equilibrium models
Over the past decades, CGE models have been employed to investigate the interactions between
economic and natural systems. This kind of models may be the ideal tool, as they allow to analyse
the interlinkages between different sectors of the market economy and the competition on the use
of available resources. Current approaches to account for water resources into these economic
models are very useful as they provide a reference framework, yet they suffer from important
deficits, which are related to the peculiar characteristic of water resources (water is a no-market
good in most countries), the absence of reliable data and the weak link of CGE models with
hydrological models.
Introduction of water to the CGE models dates back to Berck et al. (1991) and since then became
quite popular in the CGE literature (Dudu and Chumi, 2008; Berrittella et al., 2005; Calzadilla et al.,
2016). Modelling water as a factor of production or intermediate input has become the standard
approach in the literature. Most of the effort spent refined this approach with better representation
of the substitution possibilities of water with other factors of production by using different nesting
structures (Dixon et al., 2010; Calzadilla et al,. 2011, Osman et al., 2016; Gómez et al., 2004;
Calzadilla et al., 2016) or by introducing different irrigation technologies or water types to the
models (Calzadilla et al., 2011; Decaluwé et al., 1999; Gomez et al., 2004). A number of contributions
focus on the use of CGE models to explore issues related to the availability, usage and management
of water resources (Berrittella et al., 2007), as well as the links between sustainable water use, food
security and energy production (Bazilian et al., 2011). On a global level, Calzadilla et al. (2013)
explicitly model water supply and the environmental linkages between agriculture and water.
The advantage of CGE models in analysing the economics of water is their ability to compare costs
and benefits of using water in different sectors of the economy or within agriculture for different
crop production systems. CGE models are indeed well capable of analysing the competition on water
use between food and energy production systems, and derive important lessons and policy
suggestions to better distribute water among alternative uses.
These studies have contributed significantly to the literature on the economics of water. However,
most of them rely on some key hypotheses and assumptions that limit their ability to properly
account for water resources within the economic modelling framework. Treating water as a factor of
production relies on the crucial assumption of the existence of a functioning market for water, which
is not the case for many countries in the developing world. In the lack of functioning water markets,
it is virtually impossible to determine the real value of water, income generated by water use and
distribution of this income among different economic agents. Although it i s possible to deduce the
information on the value added created by water by comparing the price of irrigated and rain -fed

 3
land, this requires the existence of functioning land markets, which is not always the case especially
in developing countries.
One major limitation regards the representation of the production function scheme. The typical way
of dealing with production functions in CGE models is through the Constant Elasticity of Substitution
(CES) function. In this specification, intermediate producti on factors (and/or intermediate inputs,
like e.g. water) can be substitutes to each other (e.g., the use of less water in exchange for more
land), when relative prices change, according to a given constant elasticity of substitution. The
production function can also assume the form of nested CES, where different substitutability
between production factors or intermediate is depicted (e.g., if the use of water is a direct substitute
of land use, they will enter the same nest of the CES). The CES representati on requires a careful
exercise by modellers and a good knowledge of the production technologies and (in this context)
crop yield response to changes in the use of different inputs, to describe the right substitution
possibilities among factors. For example, is water substitutable directly with land or with land and
fertilisers or with land and labour? Is it an efficient strategy to increase irrigation when fertilizers
adoption is too low? However, this way of modelling production function has some immediate
drawbacks. Firstly, the parametrization issue of the different CES nests is extremely complicated as
should rely on robust estimation based on production survey data which are rarely available.
Secondly, by definition, elasticities of substitution among factors are constant over time and cannot
change endogenously as economic conditions of the productive system evolve. This limits the
possibility to model rapidly developing economies or endogenous technological changes able to
increase productivity of factors and reduce their use.
Additionally, modelling water in CGE, as in any economic simulation model, has drawbacks directly
linked with the specificities of the water market around the world, which have not yet fully
addressed. Most of these models adopt market structure which implies perfect competition, zero
profit conditions while the water market is more close to what in economics can be defined as a
natural monopoly. This has great implication on the price formation mechanism to be associated to
this market. Moreover, all factors that enter the production function need to be evaluated in
monetary terms, as the calibration of the parameters is based on market transactions data. In fact,
most of the water used in agriculture comes freely to farmers from rain or groundwater reservoirs
(especially in some African and Middle East countries). As a non-market public good, its cost is not
entirely accounted for in the production costs. Water is also a scarce resource, and might rapidly
deplete if not employed sustainably. These aspects are especially relevant when employing a CES
function, because the marginal productivity of inputs/production factors never goes to zero. This
implies that a "zero price" production factor (like water and other natural non-marketed resources)
should be consumed in an infinite amount. All these considerations are rather complicated to be
translated into the simplified representation of the reality which the models are. Lastly, the value of
water is closely related to the climatic conditions and this makes the valuation issues even more
complicated.
Some criticisms have already been raised in this literature. They mainly concern the valuation of
water (Cakmak et al., 2008; Hassan and Thurlow, 2011); the perfect market assumption for water
(Fadali et al., 2012); ignoring the role of water rights, the links to bio-physical (Dudu and Cakmak,
2017) and hydrological phenomena (Nechifor and Winning, 2017; Smajgl, 2006; 2009), as well as
climate factors (Young and Ringler, 2010); the lack of direct links between investments in irrigation
infrastructure and water availability (Ponce et al., 2012); and the inability to link water issues to
poverty especially in the developing country context (Debela and Tamiru, 2016). Nonetheless, a
consensus around an alternative approach to describe water issues in a CGE model is still lacking. In
this paper, we make a tentative in this direction, following some pioneer contribution ( Robinson and
Gueneau, 2013; Kahsay et al., 2017; Liu et al., 2017). Clearly, the lack of an established and
theoretical methodology inevitably implies the presence of some caveats and limitations , which will
be discussed in the concluding section.

 4
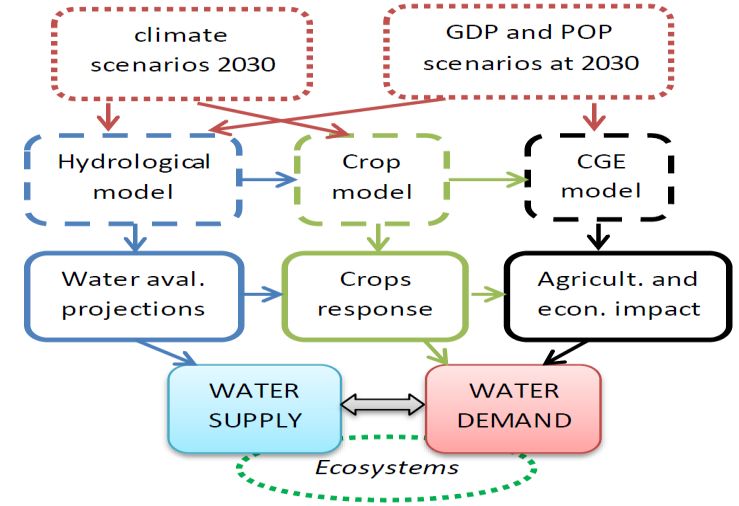
3. Methods
3.1 Modelling approach: Soft-link integration
The above discussed limitations can be overcome by adapting the modelling framework to the
information available in the data. This would require abandoning the approach to model water as a
factor of production. Since neither valuation nor the level and distribution of value added created by
water are available, it is more appropriate to introduce water indirectly to the production system.
Some recent studies follow indeed this approach (Roson and Sartori, 2015; Kahsay et al ., 2017;
Sartori et al., 2017), where water is not explicitly modelled, but is assumed to be an implicit or
hidden factor of production.
One appealing option to this purpose is to link the CGE model to bio-physical models, where water
resources are modelled explicitly with its links to the agricultural production. In such a set-up, key
parameters for the CGE model, such as the change in crop yields as water availability changes, can
be provided by the biophysical models. The latter do account for the water cycle and thus produces
the needed information on the availability of water and its impacts on the technical conditions of
agricultural production. The CGE model can then operate without the need to explicitly introduce
the "water resources factor of production" into the model, and any value added created by water
will be attributed to the irrigated land, which in general does not have any valuation or distribution
problem. Robinson and Gueneau (2013) propose an integrated modelling framework to analyse
water-economy links, and a dynamic CGE model is coupled with a re gional water basin management
model, to investigate the economy-wide impacts of changes in water resources in the Indus river
basin. A multi-scale hydro-economic modelling framework is proposed by Liu et al. (2017). They use
a global partial equilibrium grid-resolving model, SIMPLE-G, coupled with the global Water Balance
Model, to simulate the consequence of reducing unsustainable irrigation for food security, land use
change and terrestrial carbon. In all these examples, water is modelled as an indirect f actor of
production in the economic model. In Sartori et al. (2017) the GTAP CGE model is soft-linked with a
climate change damage model and the LUISA land-use change model.
In this sequential modelling methodology (Figure1), future water availability (i.e., water supply) is
first estimated by the hydrological model, under different RCPs and SSPs scenarios (Kriegler et al.,
2012; KC and Lutz, 2014; O’Neill et al., 2017).2 Crops response to changes in water supply is then
estimated by the crop model and incorporated into the CGE model as agricultural productivity
shocks. Counterfactual simulations are run on a baseline scenario consistent with the SSPs
projections of GDP and population growth. Water demand by industry is then estimated, using data
on agricultural, industrial and municipal water withdrawals provided by Aquastat and Mekonnen and
Hoekstra (2011). Among the water uses, water needs for the ecosystems services are also accounted
for. The ultimate aim is computing a water stress indicator (WSI) for Senegal, to investigate the
relationship between water availability, total use and the ecosystems needs.

2
 SSPs include a storyline or narrative, which describes plausible alternative changes in aspects of society such as demographic, economic,
technological, social, governance and environmental factors. RCPs are … In this preliminary version of the paper water availability is
estimated under the combined RCP4.5 and SSP3 only. This choice is due to the current availability of estimates by the hydrological model
used in this study. We are planning to extend the analysis to all SSPs socio-economic scenario as soon as estimates are available.

 5
Figure 1. Sequenti a l i ntegra ted model l i ng methodol ogy.

3.2 The JRC.DEMETRA CGE model, the LISFLOOD hydrological model and the EPIC crop model
In study the soft-modelling integration combines three models. The economic model is DEMETRA,
developed by the Joint Research Centre of the European Commission and derived from the
STAGE_DEV model (Aragie et al., 2017). DEMETRA is a single-country, recursive dynamic CGE model
used to analyse policy scenarios on agricultural economics, food security, fiscal policy and water
nexus issues in developing countries. The model has been recently employed to simulate an
expansion of small scale irrigation schemes through an increase in the supply of irrigated land and
water in the agricultural activities in Kenya (REF JRC Reports on Kenya). The model is designed for
calibration using a reduced form of a Social Accounting Matrix (SAM) that broadly conforms to the
UN System of National Accounts (SNA).
DEMETRA incorporates additional behavioural relationships that bette r account for economic
relationships in developing countries. In particular, it improves the representation of the dual roles
of semi-subsistent (agricultural) households as non-separable producers and consumers. In a
developing country context with a dominating agricultural sector and subsistence production, a
focus on and thus detailed disaggregation of the rural economy in terms of agricultural activities and
rural households is essential. Water is among the possible commodities that households either own-
produce from their own consumption employing internal labour sources or consume from the
market. Additionally, DEMETRA improves the representation of structural rigidities in developing
economies, including un/underemployment, the use of time for activi ties outside the "production
boundary", e.g., fetching water, introduces a detailed modelling of labour markets and migration,
and distinguishes between irrigated and rain-fed agriculture.
LISFLOOD is a GIS-based hydrological rainfall-runoff model that can simulate the hydrological
processes that occur in a catchment, primarily large river basins (van der Knijff et al., 2010; Burek et
al., 2013). The model is designed to be applied across a wide range of spatial and temporal scales ,
for long-term water balance simulations (using a daily time step), individual flood events (using
hourly time intervals, or even smaller) as well as the assessment of the effects of river regulation
measures, land-use change and climate change. The model is driven by meteorological variables,
which are precipitation intensity, potential (reference) evapotranspiration rate of a closed canopy,
potential (reference) evaporation rate from a bare soil surface, potential evaporation rate from an
open water surface, and average 24-hour temperature.
The Environmental Policy Integrated Climate (EPIC) model simulates crop production under different
farming practices and operations, including fertilization and irrigation application rates and timing,
and it considers nutrient losses to the environment. It has been thoroughly evaluated and applied
from local to continental scale (Gassman et al., 2005) and used in global assessments (Liu et al.,

 6
2008; Liu, 2009). The model has been applied for irrigation scheduling assessment (De Roo et al.,
2012; Wriedt et al., 2009), climate changes studies (Mearns et al., 1999), biofuels production (Velde
et al., 2009), crop management optimization (Pastori et al., 2011; Pastori et al., 2013) and yield
prediction (Balkovič et al., 2013).

3.3 Computing water supply and water demand at the year 2030
The actual water consumption is represented by the sum of water withdrawals for different sectors
of economy, including municipal uses. Data on current water withdrawals in Senegal are provided by
the AQUASTAT database. Agriculture is responsible for 93% of total water withdrawals. The
remaining is split between industrial (2.6%) and municipal (4.4%).
Water availability projections (Table 1) are generated by the LISFLOOD hydrological model, under
the RCP4.5 scenario for greenhouse gas concentrations and radiative forcing and the SSP3 socio-
economic scenario (O'Neill et al., 2014), by the Senegalese administrative divisions. Under the SSP3
it is assumed a slow economic growth, as a combination of multiple causes: lack of international
cooperation, slow technological progress, low education levels and high population growth. A lack of
development of clean technologies implies high global emission levels and thu s severe mitigation
challenges. The low income levels in developing countries, in turn, imply sev ere challenges to
adaptation.

 Saint-Louis Louga Thies Matam Dakar Diourbel Tambacounda
 2014 48,816.48 1,687.06 437.86 943.17 196.89 328.61 50,614.41
 2015 29,679.35 813.59 175.74 384.12 54.71 195.60 33,828.90
 2016 26,990.15 937.10 104.74 516.51 48.00 166.78 30,128.14
 2017 47,576.10 2,006.74 509.75 948.88 260.88 380.59 48,412.58
 2018 60,009.65 3,108.55 1,091.20 1,352.46 632.95 465.73 56,691.79
 2019 34,202.09 1,176.76 167.40 533.74 137.11 284.07 36,700.77
 2020 37,225.06 1,026.73 579.54 543.80 347.06 245.01 39,864.47
 2021 52,638.27 2,633.22 1,108.89 1,323.14 676.70 494.69 51,247.71
 2022 44,334.51 3,183.03 1,278.02 1,194.90 702.88 591.29 42,396.89
 2023 55,781.71 3,148.84 1,075.94 1,404.78 593.15 667.50 52,507.37
 2024 43,737.42 1,671.02 399.54 757.82 168.12 340.13 45,887.63
 2025 33,816.44 1,049.61 318.33 507.72 223.64 241.93 37,535.66
 2026 41,001.71 1,810.10 821.13 988.49 562.01 429.94 41,941.36
 2027 37,509.70 1,490.11 369.94 689.11 229.61 318.45 40,200.71
 2028 32,616.87 1,837.79 694.78 887.23 359.27 338.75 33,489.76
 2029 43,818.17 2,038.16 995.94 897.64 508.69 369.69 42,715.39
 2030 54,727.31 2,026.19 1,366.71 965.59 631.12 539.04 53,951.91

 Kaolack Kaffrine Fatick Ziguinchor Sedhiou Kolda Kedougou SENEGAL
2014 1,071.64 652.70 1,336.04 4,194.84 2,589.37 1,432.92 3,666.05 117,968.05
2015 327.56 197.54 335.36 2,488.33 1,460.59 889.89 2,561.92 73,393.20
2016 280.12 166.66 323.10 1,664.00 953.31 564.86 2,516.13 65,359.59
2017 1,526.27 962.21 1,953.40 4,339.76 2,660.95 1,462.74 3,552.44 116,553.28
2018 1,806.13 1,083.92 2,767.10 4,759.80 2,503.20 1,364.27 3,987.98 141,624.72
2019 818.61 535.40 860.54 2,568.77 1,604.27 892.64 2,980.39 83,462.54
2020 708.17 344.88 1,323.49 3,500.13 1,934.75 1,084.44 3,551.85 92,279.38
2021 1,727.82 920.89 2,522.75 4,449.00 2,637.83 1,420.29 3,689.19 127,490.39

 7
2022 2,009.46 1,058.66 2,737.20 3,426.04 1,933.42 1,088.91 2,901.81 108,837.00
2023 2,166.54 1,115.25 2,943.10 4,313.63 2,519.64 1,419.88 3,276.00 132,933.33
2024 912.14 531.02 1,023.24 3,162.05 2,173.45 1,281.14 3,386.05 105,430.77
2025 790.35 498.06 1,116.04 3,289.84 1,953.27 1,148.10 3,785.68 86,274.68
2026 1,541.86 850.99 2,334.28 3,529.82 1,891.82 1,049.54 2,975.12 101,728.16
2027 1,275.15 853.52 1,587.57 3,760.66 2,381.36 1,300.30 3,263.49 95,229.68
2028 989.29 576.51 1,398.65 2,944.68 1,630.70 892.47 2,734.10 81,390.86
2029 1,216.09 689.31 1,834.36 2,692.79 1,504.05 844.86 3,014.91 103,140.01
2030 1,897.60 965.54 2,928.15 4,956.52 2,832.67 1,542.15 3,776.66 133,107.19
Table 1. Projecti ons on water a vailability by a dmi ni s tra ti ve di vi s i ons (i n mi l l i ons of m³) . SSP3 a nd RCP4.5 s cena ri os .

The variation in water demand by the agricultural sector can only be assessed with a crop model
that captures the impact of climate on evapotranspiration. Evapotranspiration of both rain-fed and
irrigated crops is indeed dependent on several climatological factors including sunshine,
temperature, wind speed and humidity as well as crop specific physical and physiological features
(Allen et al., 1998). [analysis with EPIC and DEMETRA to be done]

 % var. in water % var. in % change in % change in
 availability (year- water availability Agric. Wat. Dem. Agric. Productivity
 by-year) (wtr 2014) (tbd) (tbd)
 2014 -38% -38%
 2015 -11% -45%
 2016 78% -1%
 2017 22% 20%
 2018 -41% -29%
 2019 11% -22%
 2020 38% 8%
 2021 -15% -8%
 2022 22% 13%
 2023 -21% -11%
 2024 -18% -27%
 2025 18% -14%
 2026 -6% -19%
 2027 -15% -31%
 2028 27% -13%
 2029 29% 13%
 2030 -38% -38%
Table 2. % cha nges i n wa ter a va i l a bi l i ty, a gri cul tura l wa ter dema nd a nd producti vi ty. SSP3 a nd RCP4.5 s cena ri os .

Among non-agricultural water demand, we distinguish industrial and municipal consumptions, as
well as ecosystems consumption.
Industrial and municipal water demand are estimated by following the procedure proposed by
Roson and Sartori (2015). For industrial water demand, they relate water demand to the industrial
output, which in turn is linked to changes in national income and in the share of manufacturing in
total value added:

 = 0.46 (1 + ) − 1

 8
where g is the yearly percentage growth rate in national GDP coming from the SSPs scenarios; s is
the (percentage change in the share of the manufacturing sector in total national value added
estimated by the DEMETRA model; and 0.46 is the elasticity of water demand with respect to the
industrial output volume estimated by Reynaud (2006). An improvement in water use efficiency by
1% per annum is also assumed Alcamo et al. (2003).
The annual growth rate of municipal water demand (m) is instead linked to variations in population
(p) and income (g) and computed as follows:

 = + 0.35 − 1

In addition to industrial and municipal water consumption, water resources are necessary to
preserve a number of natural environments. Indeed, any integrated water resources management to
support sustainable development cannot disregard environmental water allocation. According to
Hirji and Davis (2009), Environmental Flow Requirements (EFRs) refer to the quality, quantity, and
timing of water flows required to maintain the components, functions, processes, and resilience of
aquatic ecosystems that provide goods and services to people. For the Senegal river basin, a
reasonable share of water resources seems to be 23% of total water stock (Smakhtin et al. 2004).
Results are shown in Table 3.

 % change in % change in % of water for
 Ind. Wat. Dem. (tbd) Munic. Wat. Dem. EFR
 2015 4.38% 23%
 2016 4.38% 23%
 2017 4.38% 23%
 2018 4.38% 23%
 2019 4.38% 23%
 2020 4.38% 23%
 2021 4.06% 23%
 2022 4.06% 23%
 2023 4.06% 23%
 2024 4.06% 23%
 2025 4.06% 23%
 2026 4.06% 23%
 2027 4.06% 23%
 2028 4.06% 23%
 2029 4.06% 23%
 2030 4.06% 23%
 Table 3. % cha nges i n non-a gri cul tura l wa ter dema nd.

 4. Results
tbd

 5. Conclusions
tbd

 9
References
[to be upda ted]
Ara gi e, E., Dudu, H., Ferrari, E., Ma inar Ca usapé, A., McDonald, S., Thi erfi el der, K. (2017). STAGE_DEV - A va ri a nt of the
STAGE model for devel opi ng countri es , EUR 28627 EN, Publ i ca ti ons Offi ce of the Europea n Uni on, Luxembourg .
doi :10.2760/90737
Ba zi lian, M., Rogner, H. Howells, M., Hermann, S., Arent, D., Gielen, D., Steduto, P., Mül l er A., Komor, P., Tol , R.S.J., a nd
Yumkella, K.K. (2011). "Cons idering the energy, wa ter and food neus: Towards an integrated modelling a pproa ch" , Energy
Policy, 39(12): 7896-7906.
Berck, P., Robi nson, S., & Gol dman, G. (1991). The use of computable general equilibrium models to a ssess water pol i ci es .
In The economi cs a nd ma na gement of wa ter a nd dra i na ge i n a gri cul ture (pp. 489 -509). Spri nger US.
Berri ttella, M., Rehdanz, K., Roson, R., Tol, R.S.J. (2005). The Economic Impa ct of Wa ter Pri ci ng: A Computa bl e Genera l
Equi librium Analysis, Working Pa per FNU-96, Research Unit Sustainabil i ty a nd Gl oba l Cha nge Ha mburg Uni vers i ty a nd
Centre for Ma ri ne a nd Atmos pheri c Sci ence.
Berri ttella, M., Hoekstra A.Y., Rehdanz, K., Roson, R., Tol, R.S.J., (2007). "The Economic Impact of restricted water s uppl y: A
Computa bl e Genera l Equi l i bri um Ana l ys i s ", Water Research, 41(8): 1799-1813.
Burek, P, va n der Kniff, J., a nd de Roo, A. (2013). LISFLOOD – Distributed Water Balance a nd Flood Si mul a ti on Model . JRC
Report EUR 26162.
Ca l zadilla, A., Rehdanz, K., a nd Tol, R. S. (2011). The GTAP-W model: Accounting for water use in agriculture. Ki el Worki ng
Pa per No. 1745.
Ca l zadilla, A., Rehdanz, K., Betts, R., Falloon, P., Wi ltshire, A., a nd Tol , R. S. (2013). "Cl i ma te cha nge i mpa cts on gl oba l
a gri cul ture", Climatic Change, 120: 357-374.
Ca l zadilla A., Rehdanz, K., Roson, R., Sartori, M., Tol, R.S.J. (2016). "Review of CGE Models of Water Issues", book cha pa ter
i n The WSPC Reference on Natural Resources and Environmental Policy in the Era of Global Change , vol . 3: 101-123.
Debela G.M., a nd Tamiru, S. (2016). "Biofuels, Poverty, Food Securi ty a nd Growth i n Ethi opi a : A Computa bl e Gene ra l
Equi librium Mi crosimulation Analysis", i n: Heshmati A. (eds) Poverty a nd Well-Being i n Ea s t Afri ca . Economi c Studi es i n
Inequa l i ty, Soci a l Excl us i on a nd Wel l -Bei ng. Spri nger, Cha m.
Deyá Tortella, B. a nd Ti rado, D. (2011). "Hotel water consumption at a seasonal mass torustis destination. The ca s e of the
i s l a nd of Ma l l orca ", Journa l of Envi ronmenta l Ma na gement, 92(10): 2568-2579.
Di xon, P.B., M.T. Ri mmer and G. Wittwer. (2010). “Modelling the Australian government's buyback scheme with a dynami c
mul ti -regi ona l CGE model .” Centre of Pol i cy Studi es a nd the Impa ct Project, Genera l Pa per No. G -186.
Dudu, H., a nd Chumi, S. (2008). Economics of Irri gation Wa ter Management: A Li terature Survey with Focus on Partia l a nd
General Equilibrium Models. World Bank Policy Resea rch Worki ng Pa per Seri es , 2008, Number 4556. The Worl d Ba nk.
Devel opment Res ea rch Group, Sus ta i na bl e Rura l a nd Urba n Devel opment Tea m.
Fa dali, E., Rollins, K., a nd Stoddard, S. (2012). Determining water va lues with computa bl e genera l equi l i bri um mo del s .
Wa s hi ngton, DC: Na ti ona l Aca demy of Publ i c Admi ni s tra ti on.
FAO, (2012). Coping with water scarcity. An action framework for agriculture and food security. FAO Wa ter Reports 38.
Food a nd Agri cul ture Orga ni za ti on of the Uni ted Na ti ons , Rome.
FAO (2014). FAO Sta ti s ti ca l Yea rbook. Rome
Gomez, C., Ti ra do, D., a nd Rey-Maquiera, J., (2004). Wa ter Exchanges versus wa ter works : Ins i ghts from a computa bl e
general equi l i bri um model for Ba l a ea ri c Is l a nds , Wa ter Res ources Res ea rch, 40(10): doi : 10.1029/2004WR003235
Ha qiqi, I, Taheripour, F., Li u, J. a nd va n der Mensbrugghe, D. (2016). "Introducing Irri ga ti on Wa ter i nto GTAP Da ta Ba s e
Vers i on 9", Journal of Global Economic Analysis, 1(2): 116-155.
Hi rji , R a nd R Davis (2009). Envi ronmental flows in wa ter resources policies, plans, and projects: Ca s e s tudi es , The Worl d
Ba nk Envi ronment Depa rtment, Wa s hi ngton.
Inter-governmental Pa nel on Climate Cha nge (IPCC). 2014. Cl i mate Change 2014: Impacts, Adaptation, a nd Vul nera bi l i ty.
Pa rt A: Gl obal a nd Sectoral As pects . Contri buti on of Worki ng Group II to the Fi fth As s es s ment Report of the Inter -
governmenta l Pa nel on Cl i ma te Cha nge. Ca mbri dge Uni vers i ty Pres s . http://www.ipcc.ch/repor t/a r5/wg2/.
Ka hs ay, T.N., Kui k, O., Brouwer, R., a nd va n der Za a g, P. (2017), "The Economy-wi de Impa cts of Cl i ma te Cha nge a nd
Irri ga tion Development in the Nile Basin: A Computable General Equi l i bri um Approa ch ", Climate Change Economics, 08,
1750004
Li u, J., Hertel, T, La mmers, R.B., Prusevich, A., Ba ldos, U.L.C., Grogan, D.S., a nd Frolking, S. (2017). "Achievi ng s us ta i na bl e
i rri gation water withdrawals: gl obal impacts on food s ecurity a nd l a nd us e", Environmental Research Letters, 12, 104009.
Nechi for, N., a nd Wi nni ng, M. (2017). "Projecti ng i rri ga ti on wa ter requi rements a cros s mul ti pl e s oci o -economi c
devel opment futures – A gl oba l CGE a s s es s ment", Wa ter Res ources a nd Economi cs ,
https ://doi .org/10.1016/j.wre.2017.09.003.

 10
Ni cholson, S.E., B. Some and B. Kone, 2000. "An a nalysis of recent ra infall conditions i n Wes t Afri ca , i ncl udi ng the ra i ny
s ea s ons of the 1997 El Ni ño a nd the 1998 La Ni ña yea rs ", J. Clim., 13, 2628–2640.
O’Nei ll, B., Kri egler, E., Ri ahi, K., Ebi , K.L., Hallegatte, S., Ca rter, T.R., Ma thur, R., va n Vuuren, D.P., 2014. A new s cena ri o
fra mework for cl imate change research: the concept of s ha red s oci oeconomi c pa thwa ys . Clim. Change, 122, 387–400.
Os ma n, R., Ferrari, E., a nd McDonald, S. (2016). "Wa ter Scarcity a nd Irriga ti on Effi ci ency i n Egypt". Water Economics and
Policy, 2(04): 1650009.
Oyeba nde, L. a nd Odunuga, S. (2010). "Cl imate Change Impact on Water Resources a t the Tra ns bounda ry Level i n Wes t
Afri ca : The Ca s es of the Senega l , Ni ger a nd Vol ta Ba s i ns ", The Open Hydrology Journal, 4: 163-172.
Ponce, R., Bosello, F., a nd Giupponi, C. (2012). "Integrating Water Resources i nto Computable General Equilibrium Model s
– A Survey", i n C. Ca rra ro, Cl i ma te Cha nge a nd Sus ta i na bl e Devel opment Seri es .
Ri ngler, C., Wi llenbockel, D., Perez, N., Rosegrant, M., Zhu, T., a nd Ma tthews, N. (2016). "Global l i nka ges a mong energy,
food, a nd wa ter: a n economi c a s s es s ment", Journa l of Envi ronmenta l Studi es a nd Sci ences , 6(1): 161 -171.
Robi nson, S., and A. Gueneau (2013), CGE-W: An Integrated Model i ng Fra mework for Ana l yzi ng Wa ter-Economy Li nks
Appl i ed to Pa ki s ta n, GTAP Conference Pa per, Int. Food Pol i cy Res . Ins t., Wa s hi ngton, D. C.
Ros on R, a nd Damania, R. 2017. "The ma croeconomi c i mpa ct of future wa ter s ca rci ty. An a s s es s ment of a l terna ti ve
s cena ri os ", Journal of Policy Modeling, 39: 1141-1162.
Ros on, R., a nd Sartori, M. 2015. "Sys tem-wide i mplications of changing water a vailability a nd a gri cul tura l producti vi ty i n
the Medi terra nea n economi es ", Water Economics and Policy, 1(1): 1450001 – 1-30.
Sa rtori , M., Geneletti, D., Schiavo, S., a nd Scolozzi, R. (2017). To What Extent Will Climate and Land-Use Change Affect EU-
28 Agriculture? A Computable General Equilibrium Analysis. Uni versity Ca ' Foscari of Venice, Dept. of Economics Res ea rch
Pa per Seri es No. 19/WP/2017.
Schuenemann, F., Thurlow, J., Meyer, S., Robertson, R. a nd Rodri gues , J. (2018). "Eva l ua ti ng Irri ga ti on Inves tments i n
Ma l a wi : Economy-Wi de Impa cts under Uncerta i nty a nd La bor Cons tra i nt", Agricultural Economics. Forthcomi ng.
Sma khtin, V, C Revenga and P Döll (2004). A pilot gl obal assessment of environmental wa ter requi rements a nd s ca rci ty.
Wa ter Interna ti ona l , 29(3), 307–317.
Wi l liams, J.R., Jones, C.A., Ki niry, J.R., a nd Spa nel , D.A. (1989). "The EPIC crop growth model ". Transaction for the ASAE,
32(2): 497-511.
Zha o, Y., Wa ng, J. F., Ca i, H. J., (2008). "Review of CGE models on water resources", Shuikexue Jinzhan/Adva nces i n Wa ter
Sci ence 19(5): 756-762

 11
You can also read